The Glorious Glasgow Haskell Compilation System User's Guide ...
The Glorious Glasgow Haskell Compilation System User's Guide ...
The Glorious Glasgow Haskell Compilation System User's Guide ...

You also want an ePaper? Increase the reach of your titles
YUMPU automatically turns print PDFs into web optimized ePapers that Google loves.
<strong>The</strong> <strong>Glorious</strong> <strong>Glasgow</strong> <strong>Haskell</strong><br />
<strong>Compilation</strong> <strong>System</strong> User’s <strong>Guide</strong>,<br />
Version 6.10.4 27 / 224<br />
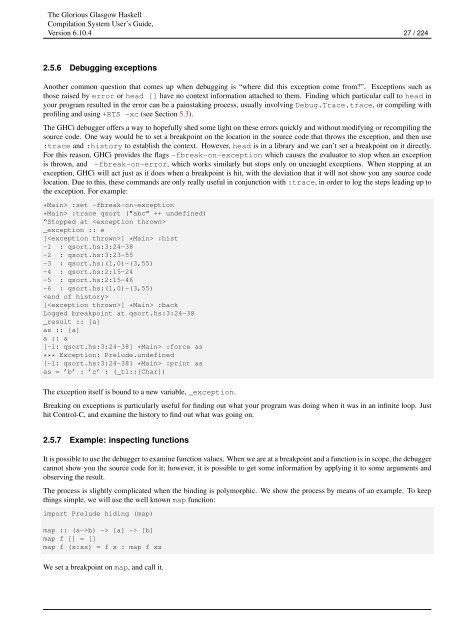
2.5.6 Debugging exceptions<br />
Another common question that comes up when debugging is “where did this exception come from?”. Exceptions such as<br />
those raised by error or head [] have no context information attached to them. Finding which particular call to head in<br />
your program resulted in the error can be a painstaking process, usually involving Debug.Trace.trace, or compiling with<br />
profiling and using +RTS -xc (see Section 5.3).<br />
<strong>The</strong> GHCi debugger offers a way to hopefully shed some light on these errors quickly and without modifying or recompiling the<br />
source code. One way would be to set a breakpoint on the location in the source code that throws the exception, and then use<br />
:trace and :history to establish the context. However, head is in a library and we can’t set a breakpoint on it directly.<br />
For this reason, GHCi provides the flags -fbreak-on-exception which causes the evaluator to stop when an exception<br />
is thrown, and -fbreak-on-error, which works similarly but stops only on uncaught exceptions. When stopping at an<br />
exception, GHCi will act just as it does when a breakpoint is hit, with the deviation that it will not show you any source code<br />
location. Due to this, these commands are only really useful in conjunction with :trace, in order to log the steps leading up to<br />
the exception. For example:<br />
*Main> :set -fbreak-on-exception<br />
*Main> :trace qsort ("abc" ++ undefined)<br />
“Stopped at <br />
_exception :: e<br />
[] *Main> :hist<br />
-1 : qsort.hs:3:24-38<br />
-2 : qsort.hs:3:23-55<br />
-3 : qsort.hs:(1,0)-(3,55)<br />
-4 : qsort.hs:2:15-24<br />
-5 : qsort.hs:2:15-46<br />
-6 : qsort.hs:(1,0)-(3,55)<br />
<br />
[] *Main> :back<br />
Logged breakpoint at qsort.hs:3:24-38<br />
_result :: [a]<br />
as :: [a]<br />
a :: a<br />
[-1: qsort.hs:3:24-38] *Main> :force as<br />
*** Exception: Prelude.undefined<br />
[-1: qsort.hs:3:24-38] *Main> :print as<br />
as = ’b’ : ’c’ : (_t1::[Char])<br />
<strong>The</strong> exception itself is bound to a new variable, _exception.<br />
Breaking on exceptions is particularly useful for finding out what your program was doing when it was in an infinite loop. Just<br />
hit Control-C, and examine the history to find out what was going on.<br />
2.5.7 Example: inspecting functions<br />
It is possible to use the debugger to examine function values. When we are at a breakpoint and a function is in scope, the debugger<br />
cannot show you the source code for it; however, it is possible to get some information by applying it to some arguments and<br />
observing the result.<br />
<strong>The</strong> process is slightly complicated when the binding is polymorphic. We show the process by means of an example. To keep<br />
things simple, we will use the well known map function:<br />
import Prelude hiding (map)<br />
map :: (a->b) -> [a] -> [b]<br />
map f [] = []<br />
map f (x:xs) = f x : map f xs<br />
We set a breakpoint on map, and call it.