Download - Hazen and Sawyer
Download - Hazen and Sawyer
Download - Hazen and Sawyer

Create successful ePaper yourself
Turn your PDF publications into a flip-book with our unique Google optimized e-Paper software.
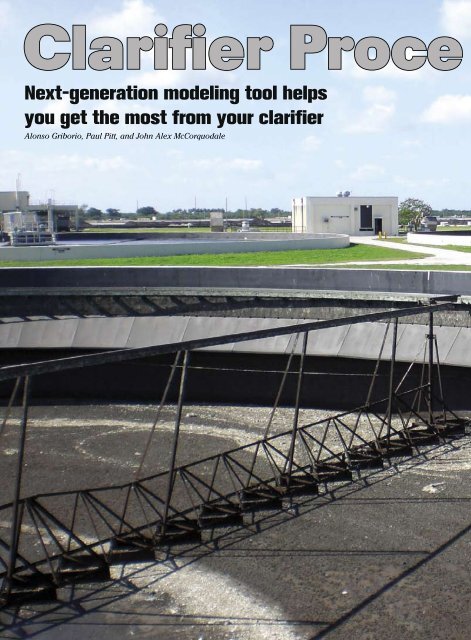
Clarifier Proce<br />
Next-generation modeling tool helps<br />
you get the most from your clarifier<br />
Alonso Griborio, Paul Pitt, <strong>and</strong> John Alex McCorquodale<br />
52 W E & T • w w w. w e f. o r g / m a g a z i n e © 2008 Water Environment & Technology All rights reserved
sses Revealed<br />
Clarifier performance depends on several interrelated factors.<br />
Hydrodynamics, settling properties, turbulence, flocculation, <strong>and</strong> solids<br />
rheology all have an impact, as do atmospheric conditions, tank<br />
geometry, internal features, <strong>and</strong> loading conditions. While the traditional<br />
clarifier design process does not account for all of these factors,<br />
computational fluid dynamics (CFD) can.<br />
A computational fluid dynamics model can be<br />
used to optimize clarifier internal features such<br />
as the Stamford baffle shown in this 59.4-mdiameter<br />
(195-ft-diameter) secondary clarifier.<br />
<strong>Hazen</strong> <strong>and</strong> <strong>Sawyer</strong><br />
© 2008 Water Environment & Technology All rights reserved<br />
o c t o b e r 2 0 0 8<br />
53
Figure 1. Flocculation Test<br />
properties but not for major features, such as<br />
tank hydrodynamics, internal configuration, <strong>and</strong><br />
density currents. State Point Analysis cannot<br />
predict the clarifier effluent suspended solids<br />
(ESS) or the position of the sludge blanket. CFD<br />
models, however, allow a much more accurate<br />
representation.<br />
<strong>Hazen</strong> <strong>and</strong> <strong>Sawyer</strong><br />
Stress testing<br />
data can be used<br />
in conjunction<br />
with CFD modeling<br />
to assess<br />
the real clarifier<br />
capacity under<br />
varying SVIs.<br />
Poor settling<br />
can severely<br />
compromise clarifier<br />
capacity <strong>and</strong><br />
produce washout<br />
during peak flow<br />
conditions.<br />
CFD is an advanced technique for clarifier<br />
design, troubleshooting, <strong>and</strong> optimization. It uses<br />
mathematical methods — <strong>and</strong> billions of calculations<br />
— to analyze systems that involve fluid motion,<br />
mass transfer, heat transfer, <strong>and</strong> associated<br />
phenomena, such as chemical <strong>and</strong> biological reactions.<br />
Today, it is one of the most advanced <strong>and</strong><br />
accurate ways to simulate clarifier performance.<br />
Clarifier Design <strong>and</strong> Optimization<br />
CFD modeling is not new. In fact, researchers<br />
developed it more than 30 years ago to study<br />
settling tanks. Since then, knowledge of clarifier<br />
processes <strong>and</strong> computer processor speed both<br />
have advanced, making exp<strong>and</strong>ed applications<br />
of CFD more viable.<br />
Traditionally, clarifiers have been designed<br />
based on empirical design guidelines or by<br />
applications of the solids flux theory, such as<br />
State Point Analysis. State Point Analysis is a<br />
box model approach that accounts for settling<br />
2Dc Clarifier Model<br />
One of a few CFD models now available for<br />
evaluating primary <strong>and</strong> secondary clarifiers is<br />
the 2Dc. This hydrodynamic model, developed<br />
at the University of New Orleans with funding<br />
from the U.S. Environmental Protection Agency,<br />
has two different versions, for circular <strong>and</strong> rectangular<br />
clarifiers. (The circular version includes<br />
a “swirl” component.) The beta version of the<br />
2Dc model, released in 2005, has been applied<br />
to projects in Canada, the United States, Japan,<br />
Korea, <strong>and</strong> Australia.<br />
The 2Dc research team wanted to address the<br />
deficiencies of previous CFD clarifier models <strong>and</strong><br />
create a tool for wastewater engineers with relatively<br />
simple calibration <strong>and</strong> validation methods.<br />
The new model features discrete, zone, <strong>and</strong> compression<br />
settling; flocculation; non-Newtonian<br />
flow; floatable particles; <strong>and</strong> variable internal<br />
tank options, including skirts <strong>and</strong> baffles. Its capabilities<br />
are detailed in the sidebar on p. 57.<br />
Stress Testing<br />
Model calibration was performed using data<br />
gathered during recent stress testing of a secondary<br />
clarifier system. There are six circular 22.9-mdiameter<br />
(75-ft-diameter) center-feed clarifiers at<br />
this 28,387-m 3 /d (7.5-mgd) facility. Clarifiers 1 <strong>and</strong><br />
2 are very shallow (side water depth of 2.7 m [9<br />
ft]) <strong>and</strong> currently are decommissioned. Clarifiers<br />
3 to 6 are 4 m (13 ft) deep with 4.9-m-diameter<br />
(16-ft-diameter) center wells. Clarifiers 3 <strong>and</strong> 4<br />
have outboard launders, while clarifiers 5 <strong>and</strong><br />
6 have inboard launders <strong>and</strong> are equipped with<br />
McKinney-type peripheral baffles.<br />
On stress-testing day, Clarifier 3 was taken<br />
out of service at 9 a.m., Clarifier 6 was taken out<br />
of service at 2:20 p.m., <strong>and</strong> flow was redirected<br />
to the remaining units. Clarifiers 3 <strong>and</strong> 6 were<br />
put back in service at about 5:30 p.m. after high<br />
blankets developed in clarifiers 4 <strong>and</strong> 5. The<br />
mixed liquor suspended solids (MLSS) for the<br />
duration of the stress testing was approximately<br />
3200 mg/L. The simulated surface overflow rates<br />
(SORs) varied between 0.21 <strong>and</strong> 1.36 m/h.<br />
Settling <strong>and</strong> Flocculation Properties<br />
The zone settling <strong>and</strong> compression rate of the<br />
54 W E & T • w w w. w e f. o r g / m a g a z i n e © 2008 Water Environment & Technology All rights reserved
solids are simulated in<br />
the 2Dc model using the<br />
Description<br />
Vesilind (exponential)<br />
equation. The two kinetic<br />
parameters of this<br />
equation, Vo <strong>and</strong> K, are<br />
determined in the field SVI = Sludge Volume Index.<br />
using batch column settling<br />
tests. In order to obtain the settling velocity<br />
as a function of solids concentration, the batch<br />
settling tests were conducted using different<br />
concentrations. The individual settling velocities<br />
are measured following the procedure described<br />
in St<strong>and</strong>ard Method 2710 E for the evaluation of<br />
the zone settling rate. The batch settling tests<br />
were performed using a 1.5-m-tall (5-ft-tall), 152-<br />
mm-diameter (6-in.-diameter) settling column<br />
provided with a stirring mechanism to minimize<br />
the wall effect.<br />
The resulting Vo <strong>and</strong> K values were 9.0 m/h<br />
<strong>and</strong> 0.539 L/g, respectively. These values are<br />
indicative of a poor settling sludge with poor<br />
compressibility that may strongly limit the clarifier<br />
capacity.<br />
The following differential equation is used in<br />
the 2Dc model to account for the shear-induced<br />
flocculation:<br />
dn<br />
2<br />
K<br />
B<br />
X G<br />
K<br />
A<br />
X n G<br />
(1)<br />
dt<br />
where<br />
X is the MLSS concentration (g/L),<br />
G is the root-mean-square velocity gradient<br />
P<br />
(s-1) = = dissipation rate obtained from the<br />
V<br />
power input to the jar test,<br />
K A is a floc aggregation coefficient (L/g),<br />
K B is a floc breakup rate coefficient (s), <strong>and</strong><br />
n is the primary particle concentration (g/L).<br />
The flocculation constants K A <strong>and</strong> K B are<br />
obtained using a simple batch flocculation test.<br />
A six-paddle stirrer was used to flocculate the<br />
activated sludge samples, assigning different<br />
flocculation times to each sample <strong>and</strong> measuring<br />
the supernatant suspended solids (see Figure 1,<br />
p. 54).<br />
Settling Properties Used for Clarifier Evaluation (Case History A)<br />
SVI<br />
(mL/g)<br />
Vo<br />
(ft/h)<br />
The maximum observed <strong>and</strong> predicted ESS<br />
<strong>and</strong> the RAS SS concentration during the stresstesting<br />
period were in good agreement, as were<br />
the observed <strong>and</strong> predicted sludge blanket<br />
heights. The ability of the model to reproduce<br />
observed ESS, RAS SS, <strong>and</strong> sludge blanket depth<br />
values indicates that it is well calibrated <strong>and</strong> can<br />
be used as a numerical tool for determining clarifier<br />
performance <strong>and</strong> predicting thickening <strong>and</strong><br />
clarification failures.<br />
K<br />
(L/g)<br />
Field sampling day (good settling properties) 110 31.1 0.406<br />
Historical — 95th percentile (poor settling properties) 145 28.1 0.540<br />
A settling column<br />
was used to<br />
determine settling<br />
properties.<br />
Model Calibration Results<br />
Using the geometry, loading, operational, <strong>and</strong><br />
solids properties data obtained during the stress<br />
testing <strong>and</strong> additional field sampling period, the<br />
2Dc model was calibrated. Three major comparisons<br />
were used to ensure proper calibration:<br />
the ESS from the clarifiers, the sludge blanket<br />
heights, <strong>and</strong> the returned activated sludge suspended<br />
solids (RAS SS) concentration.<br />
<strong>Hazen</strong> <strong>and</strong> <strong>Sawyer</strong><br />
© 2008 Water Environment & Technology All rights reserved<br />
o c t o b e r 2 0 0 8<br />
55
Figure 2. Effect of Polymer Addition on Clarifier Performance (Facility C)<br />
cost-effectiveness perspective.<br />
The modeling<br />
also can determine<br />
design <strong>and</strong> operational<br />
deficiencies not identified<br />
by traditional<br />
clarifier evaluation<br />
methods <strong>and</strong> allows<br />
development of sitespecific<br />
wet weather<br />
<strong>and</strong> sludge-bulking<br />
strategies.<br />
MLSS = mixed liquor suspended solids.<br />
SOR = surface overflow rate.<br />
At 5 p.m. on stress-testing day, both clarifiers<br />
4 <strong>and</strong> 5 showed high blankets <strong>and</strong> good ESS.<br />
However, the ESS of Clarifier 5 was slightly lower<br />
than that of Clarifier 4, probably due to the beneficial<br />
effect of the peripheral baffle.<br />
Application of CFD Models<br />
CFD models can be used to identify improvements<br />
to existing clarifier infrastructure that<br />
increase clarifier performance <strong>and</strong> capacity. A<br />
calibrated CFD model can serve to test design<br />
concepts <strong>and</strong> considerations, resulting in an<br />
optimized design from both a process <strong>and</strong><br />
Figure 3. Existing Final Settling Tanks Suspended Solids Contours (Facility D)<br />
FST = final settling tank.<br />
MLSS = mixed liquor suspended solids.<br />
SOR = surface overflow rate.<br />
RAS = return activated sludge.<br />
ESS = effluent suspended solids.<br />
WLR = weir loading rate.<br />
Predicting Clarifier<br />
Performance<br />
Perhaps the most<br />
important factor affecting<br />
secondary clarifier<br />
capacity is solids<br />
settleability. The most<br />
common test used for<br />
evaluating this is the<br />
Sludge Volume Index<br />
(SVI) test. As pointed out by many researchers,<br />
SVI is an unreliable measurement that is affected,<br />
among other things, by the solids concentration<br />
<strong>and</strong> the device used for measuring the settled<br />
volume.<br />
Most wastewater treatment plants only use<br />
SVI as a representation of solids settleability, <strong>and</strong><br />
its correlation to the model settling parameters<br />
(Vo <strong>and</strong> K) is needed to assess clarifier capacity<br />
under different settling conditions. The following<br />
CFD modeling application to a 56,775-m 3 /d (15-<br />
mgd) facility illustrates this procedure.<br />
At Facility A, there are three secondary circular<br />
center-feed clarifiers, 38.1 m (125<br />
ft) in diameter <strong>and</strong> with a 4.4-m (14.5-<br />
ft) side water depth. All clarifiers are<br />
provided with sloped bottom, inboard<br />
launder, spiral scrapers, a 4.9-m-diameter<br />
(16-ft-diameter), 0.9-m-deep<br />
(3-ft-deep) energy-dissipating inlet, a<br />
9.4-m-diameter (31-ft-diameter), 2.0-<br />
m-deep (6.5-ft-deep) center well, <strong>and</strong><br />
a Stamford-type peripheral baffle. The<br />
solids-settling properties, including<br />
the Vesilind parameters <strong>and</strong> the SVI,<br />
were measured at the field <strong>and</strong> are<br />
reported in the table on p. 55.<br />
The settling properties measured<br />
during the field visit are representative<br />
of the plant’s historical average<br />
solids-settling conditions. Clarifier capacity<br />
could be assessed using these<br />
properties; however, 50% of the time,<br />
56 W E & T • w w w. w e f. o r g / m a g a z i n e © 2008 Water Environment & Technology All rights reserved
the plant experiences poorer settling,<br />
<strong>and</strong> there is a process risk in using<br />
such properties. Risk can be substantially<br />
minimized by evaluating clarifier<br />
capacity under more critical settling<br />
conditions. In this particular case, the<br />
95th percentile of the SVI was selected<br />
to represent poor settling. Since the<br />
Vo <strong>and</strong> K for the 95th percentile SVI<br />
differ from the values measured during<br />
the field visit, it is necessary to correlate<br />
the two different measurements.<br />
Several researches have published a<br />
different relationship between these<br />
parameters, <strong>and</strong> it is the designer’s<br />
task to find the correlation that best<br />
fits the data set.<br />
Modeling results indicated that<br />
Facility A’s clarifier performance<br />
strongly depends on the settling properties<br />
<strong>and</strong> is severely compromised when the<br />
settling properties are poor. The model suggests<br />
that peak flow can be sustained only for 9 hours,<br />
after which time a significant loss of solids occurs<br />
through the effluent weirs. The model indicates<br />
this failure occurs due to thickening limitations.<br />
Total RAS flows of 0.66 m 3 /s (15 mgd, 50%) <strong>and</strong><br />
0.88 m 3 /s (20 mgd, 66%) were evaluated <strong>and</strong><br />
proved ineffective in controlling the rise of the<br />
blanket. Additional clarifier area or the implementation<br />
of a wet weather strategy is needed to<br />
prevent clarifier failure under these conditions.<br />
Validating Wet Weather Strategies<br />
Wet weather events usually pose additional<br />
challenges to the unit treatment processes.<br />
Successful post-storm treatment depends on a<br />
plant’s ability to retain the solids inventory <strong>and</strong><br />
maintain an active biomass. These factors, in<br />
turn, depend on secondary clarifier performance.<br />
If poor settling conditions occur simultaneously<br />
with peak flows, the performance of any secondary<br />
clarifier can be severely compromised.<br />
The 2Dc model was used to evaluate wet<br />
weather strategies in two scenarios. In Facility<br />
B, a calibrated CFD model was used to evaluate<br />
the effect that step feed <strong>and</strong> nonstep feed modes<br />
can have on clarifier performance. A calibrated<br />
model was used to predict the MLSS concentration<br />
under both scenarios for the case of a storm<br />
event in which the clarifier SOR rises from 0.54<br />
to 1.38 m/h in about 24 hours <strong>and</strong> the peak flow<br />
is sustained for other 24 hours. The analysis<br />
was conducted for two existing 39.6-m-diameter<br />
(130-ft-diameter), 3.7-m (12-ft) side-water-depth<br />
secondary clarifiers.<br />
Figure 4. Retrofitted Final Settling Tanks Suspended Solids Contours (Facility D)<br />
FST = final settling tank.<br />
MLSS = mixed liquor suspended solids.<br />
SOR = surface overflow rate.<br />
Modeling results demonstrated that the use<br />
of step feed considerably decreases the solids<br />
loading in the secondary clarifier, resulting in a<br />
lower ESS during the storm event. Without step<br />
2Dc Model Capabilities<br />
RAS = return activated sludge.<br />
ESS = effluent suspended solids.<br />
WLR = weir loading rate.<br />
Simulation Capabilities of General Model<br />
• Inlet, settling, <strong>and</strong> outlet zones<br />
• Steady <strong>and</strong> unsteady conditions for mass <strong>and</strong> hydraulic<br />
loadings<br />
• Dynamic inventory of the sludge blanket<br />
• Flocculation inside the tanks<br />
• Temperature variations <strong>and</strong> heat exchange<br />
• Density currents<br />
Additional Capabilities for Circular Clarifiers<br />
• Modeling of center-feed <strong>and</strong> peripheral-feed clarifiers<br />
• Modeling of inlet deflectors<br />
• Simulation of center-well, canopy, midtank (Crosby) baffle<br />
<strong>and</strong> peripheral (Stamford) baffle, positive or negative slope,<br />
inboard or outboard launder, <strong>and</strong> simple inlet arrangements<br />
• Simulation of solids removal systems (hopper or suction),<br />
constant or proportional recirculation flow rate, <strong>and</strong> rake or<br />
spiral scraper simulation<br />
Additional Capabilities for Rectangular Clarifiers<br />
• Modeling of solids or porous inlet walls<br />
• Modeling of different types of skits, positive or negative slope,<br />
inboard or outboard launder, <strong>and</strong> simple inlet arrangements<br />
• Modeling of perforated baffles<br />
• Simulation of solids removal systems, constant or proportional<br />
recirculation flow rate, <strong>and</strong> scraper simulation<br />
• Simulation of floatable <strong>and</strong> nonsettling particles<br />
© 2008 Water Environment & Technology All rights reserved<br />
o c t o b e r 2 0 0 8<br />
57
Model Calibration <strong>and</strong> Verification Data<br />
In general, the data needed for calibration <strong>and</strong> validation of the<br />
computational fluid dynamics model include the following:<br />
• Solids-settling properties (zone, discrete, <strong>and</strong> compression<br />
rates)<br />
• Flocculation parameters<br />
• Mixed liquor suspended solids<br />
• Effluent flow rate<br />
• Secondary clarifier effluent suspended solids concentration<br />
• Return activated sludge suspended solids concentration<br />
• Return activated sludge flow rate<br />
• Sludge blanket depth<br />
feed, the maximum ESS is about 162 mg/L, while<br />
step feed is able to reduce ESS to about 55 mg/L.<br />
The use of step feed also significantly reduces<br />
the solids loading rate to the clarifiers, resulting<br />
in lower sludge blanket depth <strong>and</strong> better clarifier<br />
performance.<br />
One other strategy is polymer addition.<br />
Polymers enhance clarifier performance by improving<br />
flocculation <strong>and</strong> the compressibility of<br />
the solids. Figure 2 (p. 56) shows CFD modeling<br />
results, with <strong>and</strong> without polymer addition, for<br />
a rectangular secondary clarifier under poor<br />
settling conditions (Facility C). The results demonstrate<br />
that adding polymers will improve the<br />
compressibility of the solids, preventing washout<br />
<strong>and</strong> considerably improving effluent quality.<br />
Improving Performance<br />
Generally, adding flocculating center wells to<br />
circular secondary clarifiers significantly benefits<br />
tank performance <strong>and</strong> capacity by providing an<br />
area where, at relative high-suspended-solids<br />
concentrations, dispersed particles can be incorporated<br />
into settleable flocs. The center well<br />
also improves tank hydrodynamics by reducing<br />
the entrainment of clarified liquid into the inlet<br />
zone, therefore reducing the strength of the<br />
density current <strong>and</strong> end-wall upflow. These two<br />
principles should similarly be applicable to rectangular<br />
secondary clarifiers.<br />
Rectangular tanks are commonly designed<br />
with target baffles to help distribute the incoming<br />
momentum, but these baffles sometimes are<br />
located too close to the inlet, making them less<br />
effective for promoting flocculation or controlling<br />
re-entrainment. In Facility D, a calibrated CFD<br />
model was applied to improve the performance<br />
of 61.0 m (200 ft) long × 20.7 m (68 ft) wide × 3.7<br />
m (12 ft) deep rectangular secondary clarifiers.<br />
The clarifiers have a transversal launder located<br />
2.3 m (7.5 ft) from the end wall.<br />
The modeling results indicated that clarifier<br />
performance is satisfactory at design mixed<br />
liquor concentrations of 1200 mg/L, but is compromised<br />
as the mixed liquor concentration approaches<br />
2000 mg/L when the surface overflow<br />
rate approaches 2.04 m/h. The poor performance<br />
is due to poor flocculation <strong>and</strong> hydrodynamic<br />
limitations. As illustrated in Figure 3 (p. 56),<br />
the existing final settling tanks exhibit a strong<br />
density current, which, coupled with a high weir<br />
loading rate, limits their capacity to treat peak<br />
flows. The existing tanks also lack a proper flocculation<br />
zone.<br />
To improve performance, different modifications<br />
were configured <strong>and</strong> evaluated. The results<br />
show that the definition of a flocculation zone,<br />
by replacing the target baffle with an inlet skirt,<br />
had a major benefit on the tank performance<br />
(see Figure 4, p. 57). The inlet skirt also improves<br />
the hydrodynamic of the tank by reducing the<br />
re-entrainment of clarified liquid into the inlet<br />
zone <strong>and</strong> reducing the strength of the density<br />
current. Replacing the single transverse launder<br />
by multiple longitudinal launders reduces the<br />
weir loading rate <strong>and</strong> improves performance. For<br />
the evaluated modifications, the best result was<br />
obtained by a combination of inlet skirt, raised<br />
ports <strong>and</strong> extended longitudinal launders.<br />
Ensuring Success<br />
CFD models are a powerful tool for clarifier<br />
design <strong>and</strong> optimization. As with any model,<br />
CFD must be used cautiously <strong>and</strong> with a good<br />
underst<strong>and</strong>ing of the processes <strong>and</strong> factors that<br />
affect, in this case, clarifier performance. Model<br />
calibration is an important step to enhance<br />
model accuracy <strong>and</strong> the user’s credibility in the<br />
model output.<br />
Alonso Griborio is a process engineer in the<br />
Hollywood, Fla., office, <strong>and</strong> Paul Pitt is director of<br />
wastewater technology at <strong>Hazen</strong> <strong>and</strong> <strong>Sawyer</strong> (New<br />
York). John Alex McCorquodale is a professor of<br />
environmental modeling in the Department of Civil<br />
<strong>and</strong> Environmental Engineering at the University<br />
of New Orleans.<br />
More Information Online<br />
For more data on the model calibration<br />
<strong>and</strong> clarifier performance discussed in this<br />
article, see this month’s “Features” at www.<br />
wef.org/magazine.<br />
58 W E & T • w w w. w e f. o r g / m a g a z i n e © 2008 Water Environment & Technology All rights reserved
When it rains, it pours.<br />
The Lakeside/Muhr HY-TEC screen is a horizontal screen, specifically designed<br />
to h<strong>and</strong>le excess flow from sanitary, combined or storm sewers. Wastewater<br />
<strong>and</strong> stormwater overflow solids are separated from the bypass flow stream <strong>and</strong><br />
continue to the treatment facility for ultimate removal. The end result is effluent<br />
clearer than ever before, giving you less to worry about.<br />
With an optimized overflow weir, sensor activation <strong>and</strong> optional pivoting weir <strong>and</strong><br />
pivoting screen design, there’s no doubt Lakeside has your rainy days covered.<br />
1022 E. Devon, P.O. Box 8448 / Bartlett, IL 60103 / 630/837–5640<br />
sales@lakeside-equipment.com / http://www.lakeside-equipment.com<br />
© 2008 Water Environment & Technology All rights reserved