Demographics of Persons under the age of 21 years with Hearing Aids
Demographics of Persons under the age of 21 years with Hearing Aids
Demographics of Persons under the age of 21 years with Hearing Aids

Create successful ePaper yourself
Turn your PDF publications into a flip-book with our unique Google optimized e-Paper software.
Summary <strong>of</strong> demographic details <strong>of</strong> persons <strong>under</strong> <strong>the</strong><br />
<strong>age</strong> <strong>of</strong> <strong>21</strong> <strong>years</strong> <strong>with</strong> a hearing impairment who are fitted<br />
<strong>with</strong> a hearing aid or cochlear implant at 31 December<br />
2011<br />
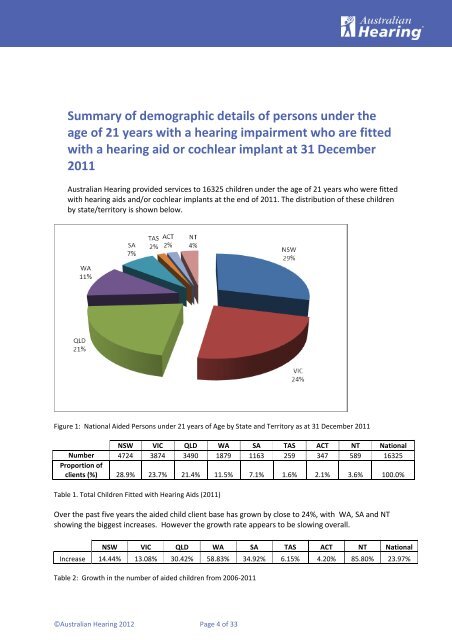
Australian <strong>Hearing</strong> provided services to 16325 children <strong>under</strong> <strong>the</strong> <strong>age</strong> <strong>of</strong> <strong>21</strong> <strong>years</strong> who were fitted<br />
<strong>with</strong> hearing aids and/or cochlear implants at <strong>the</strong> end <strong>of</strong> 2011. The distribution <strong>of</strong> <strong>the</strong>se children<br />
by state/territory is shown below.<br />
Figure 1: National Aided <strong>Persons</strong> <strong>under</strong> <strong>21</strong> <strong>years</strong> <strong>of</strong> Age by State and Territory as at 31 December 2011<br />
NSW VIC QLD WA SA TAS ACT NT National<br />
Number 4724 3874 3490 1879 1163 259 347 589 16325<br />
Proportion <strong>of</strong><br />
clients (%) 28.9% 23.7% <strong>21</strong>.4% 11.5% 7.1% 1.6% 2.1% 3.6% 100.0%<br />
Table 1. Total Children Fitted <strong>with</strong> <strong>Hearing</strong> <strong>Aids</strong> (2011)<br />
Over <strong>the</strong> past five <strong>years</strong> <strong>the</strong> aided child client base has grown by close to 24%, <strong>with</strong> WA, SA and NT<br />
showing <strong>the</strong> biggest increases. However <strong>the</strong> growth rate appears to be slowing overall.<br />
NSW VIC QLD WA SA TAS ACT NT National<br />
Increase 14.44% 13.08% 30.42% 58.83% 34.92% 6.15% 4.20% 85.80% 23.97%<br />
Table 2: Growth in <strong>the</strong> number <strong>of</strong> aided children from 2006-2011<br />
©Australian <strong>Hearing</strong> 2012 P<strong>age</strong> 4 <strong>of</strong> 33