Demographics of Persons under the age of 21 years with Hearing Aids
Demographics of Persons under the age of 21 years with Hearing Aids
Demographics of Persons under the age of 21 years with Hearing Aids

You also want an ePaper? Increase the reach of your titles
YUMPU automatically turns print PDFs into web optimized ePapers that Google loves.
Demographic Details<br />
<strong>of</strong> <strong>Persons</strong> <strong>under</strong> <strong>the</strong> <strong>age</strong> <strong>of</strong> <strong>21</strong> <strong>years</strong><br />
<strong>with</strong> a <strong>Hearing</strong> Impairment who are<br />
fitted <strong>with</strong> a <strong>Hearing</strong> Aid or Cochlear<br />
Implant - 2011<br />
©Australian <strong>Hearing</strong> 2012 P<strong>age</strong> 1 <strong>of</strong> 33
SUMMARY<br />
This circular contains summary data on children fitted <strong>with</strong> hearing aids or cochlear implants in<br />
Australia, who were <strong>under</strong> <strong>the</strong> <strong>age</strong> <strong>of</strong> <strong>21</strong> <strong>years</strong> at 31 December 2011 and who are provided <strong>with</strong><br />
audiological and hearing aid or speech processor support services through Australian <strong>Hearing</strong>.<br />
The data provides information at national and State / Territory level and has been collated from<br />
Australian <strong>Hearing</strong>’s electronic client and record man<strong>age</strong>ment system databases (as a “snapshot”)<br />
and includes:<br />
o<br />
o<br />
o<br />
o<br />
Number <strong>of</strong> hearing impaired children<br />
Number <strong>of</strong> newly fitted children in <strong>the</strong> 2011 calendar year<br />
Number <strong>of</strong> children by hearing loss groups<br />
Prevalence <strong>of</strong> hearing impairment.<br />
<strong>Hearing</strong> loss in <strong>the</strong> better ear is categorized according to <strong>the</strong> following groupings: 0 – 40 dBHL, 41 –<br />
60 dBHL; 61 – 90 dBHL and 91+dBHL. National data have also been presented using hearing loss<br />
categories described in all demographic reports prior to 2011, to facilitate comparison <strong>with</strong> past<br />
data, ie: 0-30 dBHL; 31-60dBHL; 61-90 dBHL and 91+dBHL.<br />
Differences in o<strong>the</strong>r data and calculations shown for similar birth <strong>years</strong> in previous reports prior to<br />
2007 are due to <strong>the</strong> timing <strong>of</strong> <strong>the</strong> ‘snapshot” nature <strong>of</strong> <strong>the</strong> report (data were previously collated on<br />
31 March each year) – i.e. <strong>the</strong> dynamics <strong>of</strong> <strong>the</strong> child population characteristics and demography in<br />
<strong>the</strong> database, updated information and calculation rounding at <strong>the</strong> time <strong>the</strong> report was compiled. In<br />
particular, actions across <strong>the</strong> organization that have taken place to review and update <strong>the</strong><br />
information on all aided child clients in <strong>the</strong> database, have also affected <strong>the</strong> “snapshot” counts and<br />
calculations.<br />
The major characteristics <strong>of</strong> <strong>the</strong> report show:<br />
All aided and implanted children up to <strong>21</strong> <strong>years</strong> <strong>of</strong> <strong>age</strong> at 31 December 2011 who are<br />
identified as being ‘current and active’ as at 31 December 2011<br />
Data on children who were first fitted <strong>with</strong> hearing aids from 1 January to 31 December<br />
2011.<br />
Care should be taken when comparing information from previous reports, and particularly prior to<br />
2007, due to <strong>the</strong>ir differing parameters.<br />
Taking <strong>the</strong> above comments into account this report shows that<br />
On 31 st December 2011, Australian <strong>Hearing</strong> supported 16325 clients <strong>under</strong> <strong>the</strong> <strong>age</strong> <strong>of</strong> <strong>21</strong><br />
<strong>years</strong> who had been fitted <strong>with</strong> a hearing aid or cochlear implant, a 1.4% increase compared<br />
<strong>with</strong> last year’s count <strong>of</strong> 16096. The growth in <strong>the</strong> numbers <strong>of</strong> aided children and young<br />
Australians <strong>under</strong> <strong>21</strong> <strong>years</strong> <strong>of</strong> <strong>age</strong> appears to be slowing, after a rapid increase from 2007 –<br />
2010.<br />
©Australian <strong>Hearing</strong> 2012 P<strong>age</strong> 2 <strong>of</strong> 33
Of <strong>the</strong> total group <strong>of</strong> aided children 1565 identified as being Indigenous (9.6%), similar to last<br />
year’s result <strong>of</strong> 10%<br />
2009 children were fitted <strong>with</strong> <strong>the</strong>ir first set <strong>of</strong> hearing aids in <strong>the</strong> 2011 Calendar year<br />
285 were
Summary <strong>of</strong> demographic details <strong>of</strong> persons <strong>under</strong> <strong>the</strong><br />
<strong>age</strong> <strong>of</strong> <strong>21</strong> <strong>years</strong> <strong>with</strong> a hearing impairment who are fitted<br />
<strong>with</strong> a hearing aid or cochlear implant at 31 December<br />
2011<br />
Australian <strong>Hearing</strong> provided services to 16325 children <strong>under</strong> <strong>the</strong> <strong>age</strong> <strong>of</strong> <strong>21</strong> <strong>years</strong> who were fitted<br />
<strong>with</strong> hearing aids and/or cochlear implants at <strong>the</strong> end <strong>of</strong> 2011. The distribution <strong>of</strong> <strong>the</strong>se children<br />
by state/territory is shown below.<br />
Figure 1: National Aided <strong>Persons</strong> <strong>under</strong> <strong>21</strong> <strong>years</strong> <strong>of</strong> Age by State and Territory as at 31 December 2011<br />
NSW VIC QLD WA SA TAS ACT NT National<br />
Number 4724 3874 3490 1879 1163 259 347 589 16325<br />
Proportion <strong>of</strong><br />
clients (%) 28.9% 23.7% <strong>21</strong>.4% 11.5% 7.1% 1.6% 2.1% 3.6% 100.0%<br />
Table 1. Total Children Fitted <strong>with</strong> <strong>Hearing</strong> <strong>Aids</strong> (2011)<br />
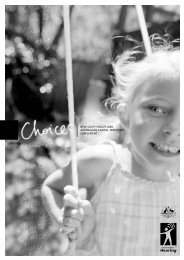
Over <strong>the</strong> past five <strong>years</strong> <strong>the</strong> aided child client base has grown by close to 24%, <strong>with</strong> WA, SA and NT<br />
showing <strong>the</strong> biggest increases. However <strong>the</strong> growth rate appears to be slowing overall.<br />
NSW VIC QLD WA SA TAS ACT NT National<br />
Increase 14.44% 13.08% 30.42% 58.83% 34.92% 6.15% 4.20% 85.80% 23.97%<br />
Table 2: Growth in <strong>the</strong> number <strong>of</strong> aided children from 2006-2011<br />
©Australian <strong>Hearing</strong> 2012 P<strong>age</strong> 4 <strong>of</strong> 33
Figure 2. Growth in <strong>the</strong> numbers <strong>of</strong> aided children, by state, from 2006-2011<br />
Figure 3. Growth in <strong>the</strong> total number <strong>of</strong> aided children
State NSW VIC QLD WA SA TAS ACT NT National<br />
Number 492 469 479 230 150 34 34 1<strong>21</strong> 2009<br />
Percent<strong>age</strong> 24.5 23.3 23.8 11.4 7.5 1.7 1.7 6.0 100.0<br />
Table 3. Children first fitted <strong>with</strong> hearing aids in 2011<br />
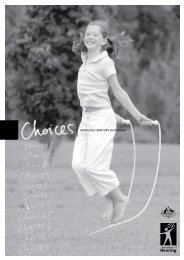
Figure 4 shows <strong>the</strong> number <strong>of</strong> children first fitted in 2011 according to <strong>the</strong>ir birth year and <strong>age</strong>. The<br />
greatest numbers <strong>of</strong> children fitted for <strong>the</strong> first time were born in 2011, which reflects <strong>the</strong> impact <strong>of</strong><br />
Universal Newborn <strong>Hearing</strong> Screening. However ano<strong>the</strong>r significant peak in first fittings occurs<br />
around school entry <strong>age</strong>.<br />
Over time, as early identification and fittings continue, <strong>the</strong> proportion <strong>of</strong> children being fitted for <strong>the</strong><br />
first time in later birth <strong>years</strong> may reduce to a certain degree. However, children <strong>with</strong> late onset<br />
and/or deteriorating hearing losses or <strong>with</strong> o<strong>the</strong>r reasons for later aid fitting will continue to be fitted<br />
for <strong>the</strong> first time at older <strong>age</strong>s.<br />
Figure 4. Number <strong>of</strong> children first fitted <strong>with</strong> hearing aids in Calendar Year 2011<br />
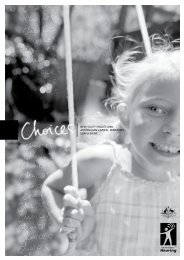
Figure 5 shows <strong>the</strong> numbers <strong>of</strong> children who are fitted at less than 6 months <strong>of</strong> <strong>age</strong> and less than 12<br />
months <strong>of</strong> <strong>age</strong>, at 31 December 2011. The “Less than 12 months” category includes children who<br />
were fitted before 6 months <strong>of</strong> <strong>age</strong>, and will not necessarily include all children born in 2011 who<br />
were fitted by 12 months <strong>of</strong> <strong>age</strong>.<br />
©Australian <strong>Hearing</strong> 2012 P<strong>age</strong> 6 <strong>of</strong> 33
Note: Data as <strong>of</strong> 31 Dec. 2011. Not all<br />
children born in 2011 will have been<br />
fitted <strong>with</strong> hearing aids by Dec 31, 2011.<br />
Figure 5. Children first fitted <strong>with</strong> hearing aids <strong>under</strong> 6 months and <strong>under</strong> 12 months <strong>of</strong> <strong>age</strong>.<br />
Expected and Actual numbers <strong>of</strong> children fitted @
AUSTRALIA<br />
Expected number based on 1.1 per 1000 births<br />
Birth year Expected Fit.less.6mo Fit.less.12mo#<br />
% expected fitted<br />
VICTORIA<br />
Expected number based on 1.1 per 1000 births<br />
Birth year Expected Fit.less.6mo Fit.less.12mo#<br />
% expected fitted<br />
WESTERN AUSTRALIA<br />
Expected number based on 1.1 per 1000 births<br />
Birth year Expected Fit.less.6mo Fit.less.12mo#<br />
% expected fitted<br />
TASMANIA<br />
Expected number based on 1.1 per 1000 births<br />
Birth year Expected Fit.less.6mo Fit.less.12mo#<br />
% expected fitted<br />
NORTHERN TERRITORY<br />
Expected number based on 1.1 per 1000 births<br />
Birth year Expected Fit.less.6mo Fit.less.12mo#<br />
% expected fitted<br />
Birth year<br />
(<strong>age</strong> in yrs) NSW VIC QLD WA SA TAS ACT NT National<br />
1991 (20) 0 0 0 1 0 0 0 0 1<br />
1992 (19) 1 0 0 1 0 0 0 0 2<br />
1993 (18) 0 0 0 1 0 0 0 4 5<br />
1994 (17) 0 0 2 0 0 0 0 2 4<br />
1995 (16) 2 0 0 0 1 0 0 2 5<br />
1996 (15) 1 0 1 0 0 0 0 2 4<br />
1997 (14) 2 0 2 1 0 0 0 4 9<br />
1998 (13) 2 0 0 2 2 0 0 1 7<br />
1999 (12) 4 1 2 5 2 0 0 5 19<br />
2000 (11) 0 1 2 4 1 0 0 5 13<br />
2001 (10) 1 1 3 3 2 0 0 10 20<br />
2002 (9) 1 0 2 1 3 0 0 7 14<br />
2003 (8) 2 0 10 7 3 1 0 8 31<br />
2004 (7) 2 0 8 7 1 0 0 16 34<br />
2005 (6) 2 1 13 7 2 0 0 11 36<br />
2006 (5) 3 0 4 4 3 0 0 5 19<br />
2007 (4) 4 0 5 1 0 0 0 4 14<br />
2008 (3) 1 1 4 2 2 0 0 5 15<br />
2009 (2) 0 0 0 0 0 0 0 2 2<br />
2010 (1) 1 1 3 0 0 0 0 0 5<br />
2011 (
Birth<br />
year NSW VIC QLD WA SA TAS ACT NT National<br />
1991 5 5 16 6 3 0 0 8 43<br />
1992 5 5 27 11 4 0 0 12 64<br />
1993 5 1 29 11 2 0 0 17 65<br />
1994 7 2 28 11 3 0 0 11 62<br />
1995 3 2 30 11 4 0 0 18 68<br />
1996 13 2 27 9 9 0 0 <strong>21</strong> 81<br />
1997 9 1 29 13 10 0 1 33 96<br />
1998 11 5 30 19 6 0 1 33 105<br />
1999 16 2 30 23 5 1 1 36 114<br />
2000 11 3 41 35 6 0 0 51 147<br />
2001 11 3 36 27 9 1 0 47 134<br />
2002 8 3 33 23 5 0 0 39 111<br />
2003 6 2 35 29 12 1 0 40 125<br />
2004 10 3 37 31 5 0 0 38 124<br />
2005 5 1 24 29 3 0 0 23 85<br />
2006 6 0 12 12 6 0 0 12 48<br />
2007 10 1 16 5 1 0 0 11 44<br />
2008 4 3 9 5 2 0 0 7 30<br />
2009 3 0 0 3 1 0 0 2 9<br />
2010 2 1 3 0 1 0 0 0 7<br />
2011 2 0 1 0 0 0 0 0 3<br />
Total 152 45 493 313 97 3 3 459 1565<br />
Table 14. Indigenous Children
Figure 6. Indigenous children as a proportion <strong>of</strong> <strong>the</strong> total aided children in each state/territory<br />
<strong>Hearing</strong> Loss Distribution<br />
<strong>Hearing</strong> loss is described according to <strong>the</strong> Three-Frequency-Aver<strong>age</strong> hearing loss (3FAHL) in <strong>the</strong><br />
better ear, that is, <strong>the</strong> aver<strong>age</strong> <strong>of</strong> hearing thresholds at 500 Hz, 1000 Hz and 2000Hz in <strong>the</strong> betterhearing<br />
ear in dBHL. Prior to 2011 <strong>the</strong> 3FAHL groupings were: 0-30dBHL, 31-60dBHL; 61-90dBHL and<br />
91+dBHL. In 2011 <strong>the</strong> hearing loss groupings were changed to reflect <strong>the</strong> fact that newborn hearing<br />
screening aims to detect losses <strong>of</strong> moderate or greater degree: 0 – 40 dBHL, 41 – 60 dBHL; 61 – 90<br />
dBHL and 91+dBHL. National data have been presented using both old and new hearing loss<br />
categories in order to facilitate comparison <strong>with</strong> previous <strong>years</strong>’ data.<br />
The majority <strong>of</strong> aided young persons <strong>under</strong> <strong>21</strong> <strong>years</strong> <strong>of</strong> <strong>age</strong> have a hearing loss <strong>of</strong> moderate or lesser<br />
degree in <strong>the</strong> better ear. Figure 6, Tables 14 and 15 show <strong>the</strong> hearing loss distribution according to<br />
<strong>the</strong> most recently-recorded 3FAHL in <strong>the</strong> better ear according to <strong>the</strong> new hearing loss categories;<br />
Tables 16 and 17 show <strong>the</strong> same data according to <strong>the</strong> hearing loss categories used in previous <strong>years</strong>,<br />
to enable comparison <strong>with</strong> past data.<br />
©Australian <strong>Hearing</strong> 2012 P<strong>age</strong> 15 <strong>of</strong> 33
Figure 7. Distribution <strong>of</strong> all aided children and young adults by 3FAHL Better Ear as at 31 December 2011.<br />
NSW VIC QLD WA SA TAS ACT NT National<br />
NSW VIC QLD WA SA TAS ACT NT National<br />
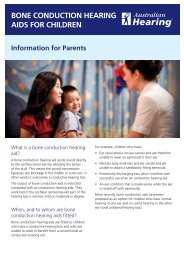
<strong>Hearing</strong> loss amongst children fitted for <strong>the</strong> first time in 2011.<br />
As described above, and seen in Figure 4, <strong>the</strong>re were two main peaks in <strong>the</strong> <strong>age</strong> <strong>of</strong> fitting for children<br />
who received <strong>the</strong>ir first hearing aids in 2011. Table 19 and Figure 9 show that majority <strong>of</strong> children<br />
who were fitted at school entry <strong>age</strong> and above have a mild degree <strong>of</strong> hearing loss in <strong>the</strong> better ear.<br />
Birth year<br />
Latest 3FAHL<br />
0-40 41-60 61-90 91+ Unknown<br />
Total<br />
Percent<strong>age</strong><br />
1991 25 1 2 1 0 29 1.4<br />
1992 16 2 0 0 1 19 0.9<br />
1993 22 7 1 0 0 30 1.5<br />
1994 35 5 0 0 0 40 2.0<br />
1995 37 5 1 0 0 43 2.1<br />
1996 39 4 0 0 2 45 2.2<br />
1997 35 6 0 0 0 41 2.0<br />
1998 51 3 2 0 0 56 2.8<br />
1999 68 5 1 1 1 76 3.8<br />
2000 72 16 2 1 1 92 4.6<br />
2001 79 11 3 0 0 93 4.6<br />
2002 82 4 2 1 1 90 4.5<br />
2003 117 9 0 1 2 129 6.4<br />
2004 153 17 4 1 1 176 8.8<br />
2005 148 18 3 2 5 176 8.8<br />
2006 115 33 2 2 3 155 7.7<br />
2007 87 19 12 3 2 123 6.1<br />
2008 52 24 4 4 5 89 4.4<br />
2009 40 24 12 7 4 87 4.3<br />
2010 76 58 31 16 5 186 9.3<br />
2011 89 66 40 35 4 234 11.6<br />
Total 1438 337 122 75 37 2009 100.0<br />
Table 19. Pr<strong>of</strong>ile <strong>of</strong> children first fitted <strong>with</strong> hearing aids in 2011, by better-ear 3 Frequency Aver<strong>age</strong><br />
<strong>Hearing</strong> Loss (dBHL) and year <strong>of</strong> birth.<br />
©Australian <strong>Hearing</strong> 2012 P<strong>age</strong> 18 <strong>of</strong> 33
Figure 9. Latest 3FAHL and birth year <strong>of</strong> children first fitted <strong>with</strong> hearing aids during 2011.<br />
Gender<br />
Males comprise a slightly higher proportion <strong>of</strong> <strong>the</strong> aided child & young Australians client base.<br />
Gender NSW VIC QLD WA SA TAS ACT NT National<br />
Female 44.6% 45.2% 44.6% 46.9% 48.3% 38.6% 48.4% 44.8% 45.3%<br />
Male 53.3% 51.6% 49.7% 50.8% 48.3% 57.9% 47.0% 54.2% 51.5%<br />
Data unavailable 2.0% 3.2% 5.7% 2.3% 3.4% 3.5% 4.6% 1.0% 3.3%<br />
Total 100.0% 100.0% 100.0% 100.0% 100.0% 100.0% 100.0% 100.0% 100.0%<br />
Table 20. Percent<strong>age</strong> Gender <strong>of</strong> Children
Birth<br />
year NSW VIC QLD WA SA TAS ACT NT National<br />
1991 <strong>21</strong>7 164 143 54 42 22 15 10 667<br />
1992 250 200 151 80 56 12 18 17 784<br />
1993 242 <strong>21</strong>0 134 73 51 13 22 24 769<br />
1994 263 201 163 82 57 15 13 16 810<br />
1995 251 222 191 92 71 15 16 23 881<br />
1996 266 <strong>21</strong>4 183 107 71 16 20 30 907<br />
1997 260 220 200 111 71 18 20 38 938<br />
1998 305 235 209 120 68 18 <strong>21</strong> 43 1019<br />
1999 307 233 <strong>21</strong>6 128 67 18 23 47 1039<br />
2000 287 <strong>21</strong>6 255 158 63 9 17 63 1068<br />
2001 290 240 222 137 91 15 16 54 1065<br />
2002 292 223 <strong>21</strong>6 129 64 12 <strong>21</strong> 45 1002<br />
2003 257 203 193 138 92 13 <strong>21</strong> 46 963<br />
2004 236 220 200 115 56 13 20 46 906<br />
2005 193 168 172 101 51 6 22 37 750<br />
2006 <strong>21</strong>7 162 142 76 49 12 14 18 690<br />
2007 156 137 132 55 34 9 12 17 552<br />
2008 148 122 114 37 31 9 14 9 484<br />
2009 118 107 100 42 34 8 9 3 4<strong>21</strong><br />
2010 99 104 102 26 31 5 7 2 376<br />
2011 70 73 52 18 13 1 6 1 234<br />
Total 4724 3874 3490 1879 1163 259 347 589 16325<br />
Table <strong>21</strong>. Children
Birth<br />
year NSW VIC QLD WA SA TAS ACT NT National<br />
1991 5 6 8 4 2 3 1 0 29<br />
1992 6 5 5 1 2 0 0 0 19<br />
1993 11 8 4 1 1 1 0 4 30<br />
1994 13 7 10 2 3 2 1 2 40<br />
1995 12 11 10 1 6 1 0 2 43<br />
1996 11 9 7 7 3 2 1 5 45<br />
1997 11 9 8 4 3 1 1 4 41<br />
1998 13 13 14 10 5 0 0 1 56<br />
1999 22 13 16 12 6 1 0 6 76<br />
2000 14 17 36 13 5 1 1 5 92<br />
2001 20 <strong>21</strong> 17 14 8 2 0 11 93<br />
2002 25 15 25 9 9 0 0 7 90<br />
2003 35 15 29 <strong>21</strong> 12 5 3 9 129<br />
2004 35 41 40 26 5 3 5 <strong>21</strong> 176<br />
2005 40 33 47 16 15 1 5 19 176<br />
2006 37 31 35 <strong>21</strong> 18 3 3 7 155<br />
2007 30 31 29 16 8 1 1 7 123<br />
2008 24 25 20 6 5 2 2 5 89<br />
2009 17 27 22 13 4 1 0 3 87<br />
2010 41 59 45 15 17 3 4 2 186<br />
2011 70 73 52 18 13 1 6 1 234<br />
Total 492 469 479 230 150 34 34 1<strong>21</strong> 2009<br />
Table 22. Children
Aided children<br />
Year first fitted<br />
1991 1992 1993 1994 1995 1996 1997 1998 1999 2000 2001 2002 2003 2004 2005 2006 2007 2008 2009 2010 2011 Total<br />
1991 15 77 82 41 48 54 45 28 18 24 19 14 <strong>21</strong> 10 23 22 23 25 22 27 29 667<br />
1992 12 77 65 52 58 56 48 51 40 31 27 31 39 <strong>21</strong> 24 <strong>21</strong> 39 37 36 19 784<br />
1993 19 81 50 45 66 72 63 50 29 37 26 23 28 24 28 25 41 32 30 769<br />
1994 25 85 75 43 58 62 53 59 34 31 31 35 37 24 33 41 44 40 810<br />
1995 15 89 77 48 68 75 72 52 55 51 38 36 46 39 39 38 43 881<br />
1996 27 92 82 55 62 78 66 63 50 48 50 37 49 49 54 45 907<br />
1997 29 90 85 69 62 74 92 79 63 53 43 47 57 54 41 938<br />
1998 31 87 75 64 72 93 86 75 92 75 66 74 73 56 1019<br />
1999 26 107 66 67 64 96 99 108 94 87 66 83 76 1039<br />
Birth year 2000 41 91 90 63 67 108 125 92 106 99 94 92 1068<br />
2001 38 102 71 63 80 115 131 140 134 98 93 1065<br />
2002 40 116 74 71 89 94 151 154 123 90 1002<br />
2003 69 99 73 62 75 132 170 154 129 963<br />
2004 84 100 71 52 88 136 199 176 906<br />
2005 108 97 47 62 108 152 176 750<br />
2006 131 136 75 88 105 155 690<br />
2007 149 115 80 85 123 552<br />
2008 178 126 91 89 484<br />
2009 200 134 87 4<strong>21</strong><br />
2010 190 186 376<br />
2011 234 234<br />
Total 15 89 178 <strong>21</strong>2 250 348 408 457 515 596 609 675 795 852 970 1136 1167 1457 17<strong>21</strong> 1866 2009 16325<br />
Table 23. Children <strong>under</strong> <strong>21</strong> <strong>years</strong> <strong>of</strong> <strong>age</strong> <strong>with</strong> hearing aids and cochlear implants, by birth year and calendar year first fitted<br />
©Australian <strong>Hearing</strong> 2012 P<strong>age</strong> 22 <strong>of</strong> 33
Age at first fitting<br />
Latest 3FAHL<br />
State
Summary Tables - Age at first fitting and 3 Frequency aver<strong>age</strong> HL details (TRADITIONAL 3FAHL Groups)<br />
Details <strong>of</strong> <strong>Persons</strong> <strong>under</strong> <strong>the</strong> <strong>age</strong> <strong>of</strong> <strong>21</strong> <strong>years</strong> <strong>with</strong> a <strong>Hearing</strong> Impairment who are fitted <strong>with</strong> a <strong>Hearing</strong> Aid<br />
AUSTRALIA<br />
Age at first fitting<br />
Latest 3FAHL<br />
Birth year Births<br />
12 to 18 to<br />
Total<br />
Summary Tables - Age at first fitting and 3 Frequency aver<strong>age</strong> HL details (NEW 3FAHL Groups)<br />
Details <strong>of</strong> <strong>Persons</strong> <strong>under</strong> <strong>the</strong> <strong>age</strong> <strong>of</strong> <strong>21</strong> <strong>years</strong> <strong>with</strong> a <strong>Hearing</strong> Impairment who are fitted <strong>with</strong> a <strong>Hearing</strong> Aid<br />
AUSTRALIA<br />
Age at first fitting<br />
Latest 3FAHL<br />
Birth year Births
Age at first fitting<br />
12 to<br />
Birth year Births
Details <strong>of</strong> <strong>Persons</strong> <strong>under</strong> <strong>the</strong> <strong>age</strong> <strong>of</strong> <strong>21</strong> <strong>years</strong> <strong>with</strong> a <strong>Hearing</strong> Impairment who are fitted <strong>with</strong> a <strong>Hearing</strong> Aid<br />
VICTORIA<br />
Age at first fitting<br />
Latest 3FAHL<br />
12 to 18 to<br />
Total<br />
Details <strong>of</strong> <strong>Persons</strong> <strong>under</strong> <strong>the</strong> <strong>age</strong> <strong>of</strong> <strong>21</strong> <strong>years</strong> <strong>with</strong> a <strong>Hearing</strong> Impairment who are fitted <strong>with</strong> a <strong>Hearing</strong> Aid<br />
QUEENSLAND<br />
Age at first fitting<br />
12 to<br />
Birth year Births
Details <strong>of</strong> <strong>Persons</strong> <strong>under</strong> <strong>the</strong> <strong>age</strong> <strong>of</strong> <strong>21</strong> <strong>years</strong> <strong>with</strong> a <strong>Hearing</strong> Impairment who are fitted <strong>with</strong> a <strong>Hearing</strong> Aid<br />
WESTERN AUSTRALIA<br />
Age at first fitting<br />
12 to<br />
Birth year Births
Details <strong>of</strong> <strong>Persons</strong> <strong>under</strong> <strong>the</strong> <strong>age</strong> <strong>of</strong> <strong>21</strong> <strong>years</strong> <strong>with</strong> a <strong>Hearing</strong> Impairment who are fitted <strong>with</strong> a <strong>Hearing</strong> Aid<br />
SOUTH AUSTRALIA<br />
Age at first fitting<br />
Birth<br />
12 to<br />
year Births
Details <strong>of</strong> <strong>Persons</strong> <strong>under</strong> <strong>the</strong> <strong>age</strong> <strong>of</strong> <strong>21</strong> <strong>years</strong> <strong>with</strong> a <strong>Hearing</strong> Impairment who are fitted <strong>with</strong> a <strong>Hearing</strong> Aid<br />
TASMANIA<br />
Age at first fitting<br />
12 to<br />
Birth year Births
Details <strong>of</strong> <strong>Persons</strong> <strong>under</strong> <strong>the</strong> <strong>age</strong> <strong>of</strong> <strong>21</strong> <strong>years</strong> <strong>with</strong> a <strong>Hearing</strong> Impairment who are fitted <strong>with</strong> a <strong>Hearing</strong> Aid<br />
AUSTRALIAN CAPITAL TERRITORY<br />
Age at first fitting<br />
Latest 3FAHL<br />
Birth year Births
Details <strong>of</strong> <strong>Persons</strong> <strong>under</strong> <strong>the</strong> <strong>age</strong> <strong>of</strong> <strong>21</strong> <strong>years</strong> <strong>with</strong> a <strong>Hearing</strong> Impairment who are fitted <strong>with</strong> a <strong>Hearing</strong> Aid<br />
Age at first fitting<br />
12 to<br />
Birth year Births