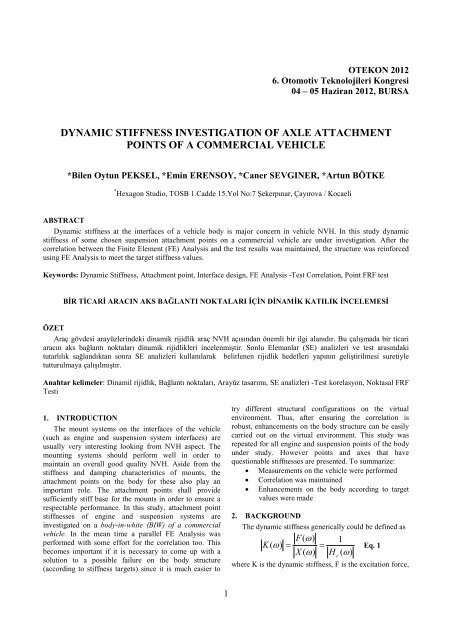
dynamic stiffness investigation of axle attachment ... - Hexagon Studio
dynamic stiffness investigation of axle attachment ... - Hexagon Studio
dynamic stiffness investigation of axle attachment ... - Hexagon Studio

You also want an ePaper? Increase the reach of your titles
YUMPU automatically turns print PDFs into web optimized ePapers that Google loves.
OTEKON 2012<br />
6. Otomotiv Teknolojileri Kongresi<br />
04 – 05 Haziran 2012, BURSA<br />
DYNAMIC STIFFNESS INVESTIGATION OF AXLE ATTACHMENT<br />
POINTS OF A COMMERCIAL VEHICLE<br />
*Bilen Oytun PEKSEL, *Emin ERENSOY, *Caner SEVGINER, *Artun BÖTKE<br />
* <strong>Hexagon</strong> <strong>Studio</strong>, TOSB 1.Cadde 15.Yol No:7 Şekerpınar, Çayırova / Kocaeli<br />
ABSTRACT<br />
Dynamic <strong>stiffness</strong> at the interfaces <strong>of</strong> a vehicle body is major concern in vehicle NVH. In this study <strong>dynamic</strong><br />
<strong>stiffness</strong> <strong>of</strong> some chosen suspension <strong>attachment</strong> points on a commercial vehicle are under <strong>investigation</strong>. After the<br />
correlation between the Finite Element (FE) Analysis and the test results was maintained, the structure was reinforced<br />
using FE Analysis to meet the target <strong>stiffness</strong> values.<br />
Keywords: Dynamic Stiffness, Attachment point, Interface design, FE Analysis -Test Correlation, Point FRF test<br />
BİR TİCARİ ARACIN AKS BAĞLANTI NOKTALARI İÇİN DİNAMİK KATILIK İNCELEMESİ<br />
ÖZET<br />
Araç gövdesi arayüzlerindeki dinamik rijidlik araç NVH açısından önemli bir ilgi alanıdır. Bu çalışmada bir ticari<br />
aracın aks bağlantı noktaları dinamik rijidlikleri incelenmiştir. Sonlu Elemanlar (SE) analizleri ve test arasındaki<br />
tutarlılık sağlandıktan sonra SE analizleri kullanılarak belirlenen rijidlik hedefleri yapının geliştirilmesi suretiyle<br />
tutturulmaya çalışılmıştır.<br />
Anahtar kelimeler: Dinamil rijidlik, Bağlantı noktaları, Arayüz tasarımı, SE analizleri -Test korelasyon, Noktasal FRF<br />
Testi<br />
1. INTRODUCTION<br />
The mount systems on the interfaces <strong>of</strong> the vehicle<br />
(such as engine and suspension system interfaces) are<br />
usually very interesting looking from NVH aspect. The<br />
mounting systems should perform well in order to<br />
maintain an overall good quality NVH. Aside from the<br />
<strong>stiffness</strong> and damping characteristics <strong>of</strong> mounts, the<br />
<strong>attachment</strong> points on the body for these also play an<br />
important role. The <strong>attachment</strong> points shall provide<br />
sufficiently stiff base for the mounts in order to ensure a<br />
respectable performance. In this study, <strong>attachment</strong> point<br />
<strong>stiffness</strong>es <strong>of</strong> engine and suspension systems are<br />
investigated on a body-in-white (BIW) <strong>of</strong> a commercial<br />
vehicle. In the mean time a parallel FE Analysis was<br />
performed with some effort for the correlation too. This<br />
becomes important if it is necessary to come up with a<br />
solution to a possible failure on the body structure<br />
(according to <strong>stiffness</strong> targets) since it is much easier to<br />
try different structural configurations on the virtual<br />
environment. Thus, after ensuring the correlation is<br />
robust, enhancements on the body structure can be easily<br />
carried out on the virtual environment. This study was<br />
repeated for all engine and suspension points <strong>of</strong> the body<br />
under study. However points and axes that have<br />
questionable <strong>stiffness</strong>es are presented. To summarize:<br />
• Measurements on the vehicle were performed<br />
• Correlation was maintained<br />
• Enhancements on the body according to target<br />
values were made<br />
2. BACKGROUND<br />
The <strong>dynamic</strong> <strong>stiffness</strong> generically could be defined as<br />
F(<br />
ω)<br />
K ( ω)<br />
=<br />
X ( ω)<br />
H c<br />
1<br />
( ω)<br />
= Eq. 1<br />
where K is the <strong>dynamic</strong> <strong>stiffness</strong>, F is the excitation force,<br />
1
X is the displacement and H (ω)<br />
is the <strong>dynamic</strong><br />
compliance. These quantities are <strong>of</strong> course on frequency<br />
domain. When the mount performance is <strong>of</strong> concern and<br />
only static <strong>stiffness</strong>es <strong>of</strong> mounts will be considered the<br />
phase information is not interesting. In fact in order to<br />
determine the efficiency <strong>of</strong> the mounts, only equivalent<br />
static <strong>stiffness</strong> <strong>of</strong> the <strong>attachment</strong> point is enough which<br />
can be defined as:<br />
The <strong>stiffness</strong> value that is read from the <strong>dynamic</strong><br />
<strong>stiffness</strong> plot on 0-2 Hz region after the rigid body modes<br />
are extracted from the system. Rigid body mode<br />
extraction can be really difficult to apply on measurement<br />
results. However it is applicable on a well-correlated FE<br />
analysis. For this reason a correlation effort has also been<br />
spent for this study.<br />
Another aspect to analyze could be possible modal<br />
weaknesses. In the other words equivalent static <strong>stiffness</strong><br />
<strong>of</strong> a certain <strong>attachment</strong> point may meet the targets but<br />
further along the frequency domain certain drops may be<br />
observed. That is also a major concern. In addition it is<br />
important to identify any kind <strong>of</strong> significant drop in<br />
<strong>dynamic</strong> <strong>stiffness</strong> if it is due to a global flexible mode or<br />
not. If not, necessary structural modifications could be<br />
made.<br />
3. TEST<br />
The <strong>dynamic</strong> response tests are crucial in this study;<br />
ensuring the FE Analysis scheme which is used for<br />
identifying any possible drops or over all inadequacy <strong>of</strong><br />
the point structural <strong>stiffness</strong> and <strong>of</strong> course the coming up<br />
with good possible solutions.<br />
3.1. Setup<br />
The common way <strong>of</strong> obtaining the <strong>dynamic</strong> <strong>stiffness</strong><br />
by test is to measure the acceleration. So point FRFs <strong>of</strong><br />
the points under concern collected with a single<br />
accelerometer and an impact hammer. The tools for<br />
Impact Hammer Tests are listed as:<br />
• Head Acoustics HEADLab system (labPWR l.2,<br />
labCTRL l.1, labV6<br />
• B&K Type 4507 B Accelerometer<br />
• B&K Type 8206 Impact Hammer<br />
The BIW structure is hanged with reasonably elastic<br />
strings on to the ro<strong>of</strong> to simulate the free-free condition.<br />
One <strong>of</strong> the <strong>axle</strong> <strong>attachment</strong> points can be seen on Figure<br />
1. The measurements are taken via a cube attached to one<br />
<strong>of</strong> the bolt holes. The FE Analysis point definition was<br />
also made accordingly.<br />
c<br />
Figure 1 - Left and Right Measurement points<br />
3.2. Coherence<br />
All point FRFs were checked for quality via coherence<br />
indicator. Figure 2 shows a sample coherence plot from<br />
right measurement point x-direction. (See Figure 3)<br />
Figure 2 - Coherence Plot, Right measurement point x-direction<br />
After the point FRFs were checked for possible<br />
inconsistencies and verified studies for coherence were<br />
initiated.<br />
4. INITIAL RESULTS AND CORRELATION<br />
After careful testing and accurate FE modeling the<br />
agreement <strong>of</strong> results were quite acceptable. There were<br />
some inconsistencies at the engine <strong>attachment</strong> points but<br />
they were improved by changing the FE model especially<br />
in terms <strong>of</strong> coherence and structural modifications.<br />
2
According to what has been put below, two main<br />
concerns exist for the points <strong>of</strong> interest:<br />
• The levels <strong>of</strong> <strong>stiffness</strong> values over all frequency<br />
band is below the target levels<br />
• There are two strong modes in each z and x<br />
direction which causes very low <strong>stiffness</strong> values<br />
around local frequency points.<br />
5. ITERATIVE MODIFICATIONS<br />
Thirteen different modification configuration was<br />
applied to the body structure housing the <strong>attachment</strong> point<br />
under concern but only four <strong>of</strong> them are presented in this<br />
paper. The results are presented on Figure 5, Figure 6 as<br />
<strong>dynamic</strong> <strong>stiffness</strong> and on Figure 7 as equivalent static<br />
<strong>stiffness</strong>.<br />
Configuration #6 and #13 are the best solutions to<br />
both <strong>of</strong> the problems stated above, namely in terms <strong>of</strong><br />
equivalent <strong>stiffness</strong> and <strong>dynamic</strong> <strong>stiffness</strong>.<br />
Figure 3 - Dynamic Stiffness- Test vs. FE Analysis x-directions<br />
The initial results and the indication <strong>of</strong> "how<br />
correlated the model is" can be seen on Figure 3. This<br />
initial configuration will be addressed as the base<br />
configuration from here and on.<br />
Looking at the result one can immediately detect the<br />
modes around 125 Hz at x-axis and 80 Hz at z-axis on<br />
both left and right measurement points. In this case the<br />
system does not bear load across y-axis so the y<br />
component <strong>of</strong> <strong>stiffness</strong> is ignored. Over all <strong>stiffness</strong> levels<br />
being under the red target curve is also a major concern.<br />
Figure 5-Dynamic Stiffness- FE Analysis iterations x-directions<br />
Figure 4- Dynamic Stiffness- Test vs. FE Analysis z-directions<br />
3
Figure 6 - Dynamic Stiffness- FE Analysis iterations z-directions<br />
Figure 7 - Equivalent Static Stiffness comparison between base and alternative configuration<br />
Figure 8 shows the base structure. Configuration 6<br />
(Figure 9) reinforces x and z directions by small brackets<br />
attached around the pr<strong>of</strong>iles where they meet with the<br />
thick rails <strong>of</strong> the body. Also their thickness is increased to<br />
the limit set by producibility.<br />
Figure 9 - Configuration 6<br />
Figure 8 - Base Configuration<br />
At configuration 13 instead <strong>of</strong> increasing the thickness<br />
<strong>of</strong> the pr<strong>of</strong>iles to the limit four <strong>of</strong> small pr<strong>of</strong>iles were<br />
added along the z direction and a small amount <strong>of</strong><br />
thickness added to the pr<strong>of</strong>iles. The brackets on top are<br />
also kept and the rest was cleaned up.<br />
4
6. CONCLUSION<br />
The results show that the configuration 13 shows the<br />
best results in terms <strong>of</strong> meeting the target <strong>dynamic</strong><br />
<strong>stiffness</strong> as well as the target <strong>dynamic</strong> <strong>stiffness</strong>. Since the<br />
main interest <strong>of</strong> this study is on lower frequency region, it<br />
has not been checked wheter the dominant modes <strong>of</strong> each<br />
x and z directions could shift the higher frequency region<br />
or not. This question could appear to be valid if higher<br />
frequencies may ever be <strong>of</strong> concern.<br />
Figure 10 - Configuration 13<br />
References<br />
Ewins, D. J. (2000). Modal Testing: Theory, Practice and<br />
Application. Badlock,Hertfordshire: Research Studies<br />
Press Ltd.<br />
5