
Create successful ePaper yourself
Turn your PDF publications into a flip-book with our unique Google optimized e-Paper software.
TEMPORAL AND SPATIAL VARIABILITY OF BLENNY (PERCIFORMES:<br />
LABRISOMIDAE AND BLENNIIDAE) ASSEMBLAGES ON TEXAS JETTIES<br />
A Thesis<br />
by<br />
Timothy Brian Grabowski<br />
Submitted to the Office of Graduate Studies of<br />
Texas A&M University<br />
in partial fulfillment of the requirements for the degree of<br />
MASTER OF SCIENCE<br />
December 2002<br />
Major Subject: Wildlife and Fisheries Sciences
TEMPORAL AND SPATIAL VARIABILITY OF BLENNY (PERCIFORMES:<br />
LABRISOMIDAE AND BLENNIIDAE) ASSEMBLAGES ON TEXAS JETTIES<br />
A Thesis<br />
by<br />
Timothy Brian Grabowski<br />
Submitted to the Office of Graduate Studies of<br />
Texas A&M University<br />
in partial fulfillment of the requirements for the degree of<br />
MASTER OF SCIENCE<br />
Approved as to style and content by:<br />
_____________________________<br />
André M. Landry, Jr.<br />
(Chair of Committee)<br />
_____________________________<br />
Jaime R. Alvarado Bremer<br />
(Member)<br />
_____________________________<br />
William H. Neill<br />
(Member)<br />
_____________________________<br />
Jay R. Rooker<br />
(Member)<br />
_____________________________<br />
Wyndylyn M. von Zharen<br />
(Member)<br />
_____________________________<br />
Robert D. Brown<br />
(Head of Department)
3<br />
ABSTRACT<br />
Temporal and Spatial Variability of Blenny (Perciformes: Labrisomidae and Blenniidae) Assemblages on<br />
Texas Jetties. (December 2002)<br />
Timothy Brian Grabowski, B.S. Texas A&M University<br />
Chair of Advisory Committee: Dr. André M. Landry, Jr.<br />
Structured, hard-bottom habitats and associated cryptic fish species were effectively absent from<br />
the northwestern Gulf of Mexico coast prior to jetty construction 120 years ago. Fishes in the Families<br />
Labrisomidae and Blenniidae now distributed across the northwest Gulf may have been influenced by jetty<br />
construction. Little is known about the species composition, population dynamics, or origin(s) of blenny<br />
assemblages on Texas jetties. In this study, blennies were dipnetted monthly from jetty habitats at<br />
Galveston, Port Aransas, and South Padre Island, Texas, during May 2000 through August 2001; and in<br />
Florida, once during December 2001 to characterize assemblage structure. All specimens (n=4555) were<br />
identified, enumerated, and measured and a subsample taken for otolith microstructure analysis (n=99) and<br />
mtDNA sequencing (n=67). Four blenniid species (Hypleurochilus geminatus, Hypsoblennius hentz,<br />
Hypsoblennius ionthas, and <strong>Scartella</strong> <strong>cristata</strong>) and one labrisomid (Labrisomus nuchipinnis) contributed<br />
to spatially distinct assemblages differing significantly in species composition, diversity and evenness<br />
across sampling sites. Galveston exhibited the highest diversity index values while Port Aransas yielded<br />
the most species (4). Temperature appears to be the driving factor behind species composition over time<br />
at each sampling site. <strong>Scartella</strong> <strong>cristata</strong> dominated blenny assemblages on Texas jetties regardless of local<br />
environmental conditions and was found to be a short-lived species with an extended spawning period.<br />
The Galveston population of S. <strong>cristata</strong> exhibited the statistically highest mean total length and age and<br />
demonstrated a close affinity to Florida conspecifics, thus indicating the eastern Gulf to be a likely source.<br />
<strong>Scartella</strong> <strong>cristata</strong> on the lower and middle Texas coast originated from at least two sources, suggesting<br />
two genetically distinct populations may exist in the Gulf. Jetty construction on the Texas coast has<br />
allowed these two populations to mix.
4<br />
DEDICATION<br />
This work is dedicated to the three special women in my life. To my grandmother, Dolores, who<br />
always taught me to be true to myself and though she is gone will never be forgotten. To my mother, Jane,<br />
who has never faltered in her belief in me. And to my wife, Laura, who is a source of constant inspiration<br />
because she looks upon this world with a sense of wonder and amazement that I envy. I succeed because<br />
of what each of you gives to me.
5<br />
ACKNOWLEDGMENTS<br />
No journey of discovery is taken alone and this was no exception. I would like to show my deep<br />
appreciation to my committee, André Landry, Jay Rooker, Jaime Alvarado Bremer, William Neill, and<br />
Wyndylyn von Zharen for their unwavering support, patience, and willingness to teach me. I would like to<br />
thank Raymond Bauer and his students Aaron Baldwin and Greg Hess at Louisiana State University at<br />
Lafayette, Scott Bean, Brian Bloodworth, Cristine Chapman, Danny English, Bert Geary, Laura<br />
Grabowski, Joseph Heaton, Casey Hughart, Lyndsey McDonald, Benjamin Rhame, Kelly Rullo, Tucker<br />
Slack, and Joanne Walczak for their assistance in both the field and laboratory, this project could not have<br />
been completed without them. I would like to thank the Department of Marine Biology at Texas A&M<br />
University at Galveston, the TAMUG Research Management Office, and Leonard Kenyon of the Sea<br />
Turtle and Fisheries Ecology Research Laboratory for their logistical support of this project. And last but<br />
not least, the Southeast Texas Sportfishing Association and The Aquarium at Moody Gardens for their<br />
generous financial support of this project.
6<br />
1 INTRODUCTION<br />
Fishes of the Families Blenniidae and Labrisomidae are cryptic residents of structured inshore<br />
and offshore marine habitats worldwide (Bond 1996). Blenniidae is a varied and speciose family with 345<br />
species in 53 genera, the majority of which occur in the Indo-Pacific (Nelson 1994). Because blenniids<br />
are typically restricted to structurally complex, hard-bottomed substrates such as reefs and rocky<br />
shorelines, the Texas Gulf shore probably represented a historical gap in their range prior to construction<br />
of jetties. Nevertheless, ten species in the Family Blenniidae occur on nearshore jetties, groins, and<br />
pilings; offshore oil platforms, banks, and reefs; and estuarine oyster reefs in the northwestern Gulf of<br />
Mexico (Britton and Morton 1989, Hoese and Moore 1998). Two of these, striped blenny, Chasmodes<br />
bosquianus (Lacepéde) and Florida blenny, Chasmodes saburrae Jordan and Gilbert, are restricted to low<br />
salinity, estuarine habitats (Springer 1959) and are not likely residents of nearshore or offshore waters.<br />
Additionally, C. saburrae is thought to be restricted to parts of Florida where there is a gap in the range of<br />
C. bosquianus (Hoese 1958, Springer 1959). Two other species, barred blenny, Hypleurochilus<br />
bermudensis Bebee and Tee-Van, and feather blenny, Hypsoblennius hentz (Lesueur), are not commonly<br />
encountered along the Texas coast (Hubbs 1939, Randall 1966, Hoese and Moore 1998). The only known<br />
records of Hypleurochilus bermudensis in the northwestern Gulf come from the West Flower Garden<br />
Banks (Randall 1966, Bright and Cashman 1974, Hoese and Moore 1998). Hypsoblennius hentz is<br />
somewhat more common, occurring on soft mud bottoms in south Texas bays rather than along jetties of<br />
the middle and upper Texas coast (Hubbs 1939, Smith-Vaniz 1980, Hoese and Moore 1998). Three other<br />
species, tessellated blenny, Hypsoblennius invemar Smith-Vaniz and Acero, redlip blenny, Ophioblennius<br />
atlanticus (Valenciennes), and seaweed blenny, Parablennius marmoreus (Poey), are frequently found on<br />
offshore reefs and production platforms but are uncommon in nearshore habitats (Bright and Cashman<br />
1974, Hoese and Moore 1998). Molly miller, <strong>Scartella</strong> <strong>cristata</strong> (Linneaus), and crested blenny,<br />
Hypleurochilus geminatus (Wood) are common on jetties and groins but have been known to occur on<br />
structured habitats in estuarine systems (Lindquist and Chandler 1978, Hoese and Moore 1998). Hoese<br />
This thesis follows the style of Marine Ecology Progress Series.
7<br />
and Moore (1998) indicate that Hypleurochilus geminatus is the most frequently encountered blenny on<br />
the lower Texas coast and imply that <strong>Scartella</strong> <strong>cristata</strong> is relatively scarce on the middle and upper coast.<br />
The freckled blenny, Hypsoblennius ionthas (Jordan and Gilbert), also is a typical inhabitant of jetties and<br />
groins but occurs more frequently on estuarine oyster reefs (Hubbs 1939, Clarke 1979, Smith-Vaniz 1980,<br />
Hoese and Moore 1998).<br />
The Family Labrisomidae is another group of blennies occurring on Texas jetties (Hoese 1958,<br />
Springer 1958, Hoese and Moore 1998). While there are 102 known labrisomid species in 16 genera<br />
(Nelson 1994), not much is known about their ecology, life history, or population dynamics (Springer<br />
1958, Hoese and Moore 1998). The hairy blenny, Labrisomus nuchipinnis (Quoy and Gaimard), is the<br />
only species regularly occurring on the Texas coast (Hoese 1958, Hoese and Moore 1998). Little is<br />
known about L. nuchipinnis except that it ranges throughout the tropical and subtropical Atlantic (Springer<br />
1958, Hoese and Moore 1998) but avoids sandy beaches, river deltas, and mangroves (Springer 1958).<br />
Blennies have been the focus of diverse research efforts ranging from behavior to aquatic<br />
toxicology. However, existing information on population dynamics of blennies in the northwestern Gulf<br />
of Mexico is limited, particularly when compared to that of counterparts in the Caribbean, Mediterranean,<br />
and northeast Atlantic Ocean. These studies tend to focus on a single species and not multi-species<br />
systems where differences in biology of constituent species can be determining factors in assemblage<br />
structure. The Texas coast encompasses a wide range of environmental and climatic regimes (Britton and<br />
Morton 1989) that have the potential of influencing growth. Growth is an important aspect in structuring<br />
species assemblages (Jones 1991); however, there is no information available on the growth rates of Gulf<br />
of Mexico blennies. Therefore an attempt to characterize these assemblages would be incomplete without<br />
recognizing the importance of an age and growth component.<br />
Blennies and the “New” Texas Coast<br />
The Texas coast has historically been an unbroken 650 km stretch of sandy beaches. Rocky shore<br />
habitats are practically absent in nearshore waters of the northwest Gulf, with the nearest natural rocky<br />
shores occurring at Punta Jerez in Tamaulipas, Mexico (Britton and Morton 1989). There is significantly<br />
more hard-bottom habitat in offshore waters of the northwest Gulf but these areas are relatively small, low
8<br />
relief features isolated from each other by large expanses of flat mud bottoms (Bright 1977, Dennis and<br />
Bright 1988). With the exception of the Flower Gardens Banks and other smaller associated banks, few if<br />
any of these naturally occurring hard-bottom habitats are suitable for blenny colonization as a result of the<br />
Gulf’s oceanographic and bathymetric characteristics (Rezak et al. 1985). Other structure-dependent<br />
fishes such as lutjanids and serranids flourish not only on banks and reefs of the northwestern Gulf but on<br />
low relief features, such as shell ridges, while blenniids are absent from these habitats (Rezak et al. 1985,<br />
Harper 2002). Sediment input from the Mississippi River creates a sunlight-blocking layer of suspended<br />
material known as the nephloid layer that effectively limits the depth to which algae can grow on<br />
nearshore features of the northwest Gulf. Consequently, the distribution of herbivorous blenniid species is<br />
restricted to features that extend above the nephloid layer. Extensive oyster reefs located in primary and<br />
secondary bays behind barrier islands are the only other naturally occurring hard-bottom habitats along the<br />
Texas coast. However, fluctuations in temperature and salinity associated with these estuarine<br />
environments limit blenny assemblages to species such as Chasmodes and Hypsoblennius spp. that tolerate<br />
these changing conditions (Springer 1957, Crabtree and Middaugh 1982, Britton and Morton 1989, Hoese<br />
and Moore 1998).<br />
Human activities have altered the physical nature of the Texas coast dramatically over the past<br />
140 years. Ensuring the flow of commerce and protecting beaches have resulted in the creation of a<br />
limited amount of rocky shore habitat in the form of jetties and groins. Jetty construction along the Texas<br />
coast began in 1868 and continued into the 1920’s (Alperin 1977). Currently seven major passes are<br />
protected by jetties: Sabine Pass, Bolivar Roads, Freeport Ship Channel, Matagorda Ship Channel,<br />
Aransas Pass, Mansfield Cut, and Brazos Santiago Pass. Many other small jetties and groins such as those<br />
at Fish Pass on Mustang Island, Texas and at Veracruz and Tampico, Mexico protect passes and shoreline<br />
along the western Gulf. Groins were constructed along the Galveston Island beachfront in the 1930’s to<br />
protect both the beach and seawall (Alperin 1977).<br />
Jetties represent structurally stable and permanent habitats to associated fauna in contrast to a<br />
coastline characterized by shifting sand and bottoms of unconsolidated muds and sands (Bohnsack et al.<br />
1991). Texas jetties are essentially new “islands” in the Gulf of Mexico where planktonic spores, eggs,
9<br />
and larvae of organisms that must settle on solid substrate to survive have suitable habitat on which to<br />
recruit. Many fish species probably are still colonizing and establishing new populations on Texas jetties<br />
but unfortunately no comprehensive study of these processes has been undertaken. Due to jetties’ recent<br />
construction and relative isolation, their biotic community may be impoverished when compared to that of<br />
naturally occurring rocky shores and reefs of the eastern Gulf, southern Gulf, and Caribbean as well as<br />
estuarine oyster reefs (Britton and Morton 1989).<br />
Blennies are recent arrivals to the Texas Gulf coast, utilizing jetties as surrogate habitat. The<br />
blenniid species found on the Texas coast have probably closed a gap in their historic range by colonizing<br />
jetties (Hoese and Moore 1998, Britton and Morton 1989); yet their original source population(s) of<br />
individuals comprising this recruitment has not been identified. It also is unknown if blennies have<br />
established self-maintaining populations—a possibility in light self-recruitment in reef fish populations<br />
(Stobutzki and Bellwood 1997, Jones et al. 1999, Swearer et al. 1999), or if their persistence is dependent<br />
upon recruitment from outside sources.<br />
The three components of the present study (habitat and assemblage characterization; age and<br />
growth; population genetics) enabled broad questions regarding the past, present, and future of these<br />
assemblages to be addressed. The history of blenny assemblages on Texas jetties was reconstructed using<br />
molecular techniques and focused on the question: do assemblages present on Texas jetties today represent<br />
an extension from a single source or a convergence of multiple populations? The current status of blenny<br />
assemblages was documented through collections along the Texas coast and focused on the question: how<br />
are blenny assemblages on jetties structured along the Texas coast? Combining these data with<br />
characterization of jetty habitat and age and growth of the dominant species allowed questions regarding<br />
the underlying reasons for observed patterns to be raised. The future of blenny assemblages on Texas<br />
jetties also was considered including the long-term impact jetties may have on the genetic structure of<br />
blenny populations in the Gulf and potential practical applications of this study to conservation and<br />
management of marine resources.
10<br />
OBJECTIVES<br />
1.) Characterize blenny assemblages on Texas jetties and groins.<br />
a. Document the species composition and size structure of these assemblages and<br />
assess their spatial and temporal variability.<br />
b. Determine the species diversity and evenness of these assemblages.<br />
c. Identify hydrographic parameters critical to observed distribution.<br />
2.) Characterize age and growth patterns of the dominant blenny species on Texas jetties.<br />
a. Compare mean age of local populations across sampling sites.<br />
b. Determine growth rates across sampling sites.<br />
c. Assess spawning periodicity of conspecifics across sampling sites.<br />
3.) Document the genetic structure of the dominant blenny species on Texas jetties.<br />
a. Determine the genetic interaction/differentiation among sites in Texas.<br />
b. Determine the genetic interaction/differentiation among sites in Texas and Florida.<br />
c. Identify the most likely origin(s) of recruits to Texas jetties.
11<br />
METHODS<br />
Study Areas<br />
Blenny assemblages of Texas jetties were characterized at upper, middle, and lower coast<br />
locations (Fig. 1). The upper coast study area consisted of an 8 km stretch of beachfront on Galveston<br />
Island in Galveston County, Texas (Fig. 2). Ten groins, each extending gulfward from the Galveston<br />
beachfront for approximately 50 m, collectively comprised the only sampling station on the upper coast<br />
(Table 1). Groins were sampled in Galveston as opposed to the South Jetty at Bolivar Roads on the east<br />
end of the island due to safety concerns. Surf conditions and currents at the South Jetty were typically<br />
much more severe than those at the groins. Integrating the 10 smaller groins into one station was designed<br />
to reduce mortality associated with repeated sampling at these sites. Although the majority of effort was<br />
concentrated on two groins (the 44 th and 49 th Street groins), samples taken from other groins did not differ<br />
in CPUE, species composition, or size of individuals from those taken from more heavily fished<br />
counterparts during the same month.<br />
The South Jetty bordering Aransas Pass in Port Aransas, Nueces County, was the middle coast<br />
study area (Fig. 2). This jetty runs extends gulfward in a south-southeast direction for approximately 2000<br />
m. Two collection stations were established at the South Jetty, station 2 on the north or Aransas Pass side<br />
and station 3 on the south or Gulf side. Both stations were sampled concurrently whenever possible, but<br />
wind and surf conditions frequently rendered monthly samples possible at only one station.<br />
Lower Texas coast collections were made at the North Jetty protecting Brazos Santiago Pass on<br />
South Padre Island, Cameron County (Fig. 2). This jetty extends east-west into the Gulf for approximately<br />
2000 m. Like those for the middle coast, two collection stations were established at the North Jetty-station<br />
4 on the north or Gulf side and station 5 on the south or channel side near a protected cove (Dolphin<br />
Cove).<br />
Characterization of Blenny Habitat<br />
Blenny habitat was characterized by describing two distinct aspects of the jetty environment:<br />
hydrographic conditions and substrate complexity. Hydrographic characterization was based on water
12<br />
N<br />
Gulf of M exico<br />
W<br />
E<br />
S<br />
29° 15.00’<br />
Texas<br />
Houston<br />
Galveston<br />
28° 10.00’<br />
Corpus Christi<br />
Port Aransas<br />
27° 05.00’<br />
Gulf of Mexico<br />
26° 00.00’<br />
Brownsv ille<br />
South Padre Island<br />
98° 35.00’<br />
97° 30.00’<br />
96°25 .00’<br />
9 5° 20.00’<br />
94°15.00’<br />
Fig. 1. Map of upper, middle, and lower coast study areas used to<br />
characterize blennyassmeblages on Texas jetties from May 2000 to August<br />
2001. Highlighted boxes represent study areas sh own in greater detail in Fig.<br />
2.
13<br />
29° 18.8’<br />
29° 16.2’<br />
Galveston Bay<br />
Galveston Island<br />
1<br />
Galveston<br />
STATION 1<br />
May 2000-<br />
August 2001<br />
29° 13.8’<br />
94° 55.8’<br />
94° 53.5’<br />
94° 50.9’<br />
94° 48.4’<br />
94° 45.9’<br />
27° 51.5’<br />
27° 50.8’<br />
27° 49.9’<br />
San Jose Island<br />
Aransas Pass<br />
2<br />
Mustang Island<br />
South Jetty<br />
3<br />
Port Aransas<br />
STATIONS 2 and 3<br />
May 2000-<br />
August 2001<br />
27° 49.1’<br />
97° 10.4’<br />
97° 08.2’<br />
97° 06.0’<br />
97° 03.8’<br />
97° 01.6’<br />
26° 05.0’<br />
26° 04.3’<br />
26° 03.5’<br />
Laguna Madre<br />
South Padre<br />
Island<br />
4<br />
Brazos Santiago Pass<br />
North Jetty<br />
5<br />
South Padre<br />
Island<br />
STATIONS 4 and 5<br />
July 2000-<br />
August 2001<br />
97° 11.1’<br />
97° 10.3’<br />
97° 09.6’<br />
97° 08.9’<br />
97° 08.2’<br />
Fig. 2. Collection stations at Galveston (STATION 1), Port Aransas<br />
(STATIONS 2 and 3) and South Padre Island (STATIONS 4 and 5), TX study<br />
areas.
14<br />
Table 1. Location of Gal veston Islan d, TX stations and the months each w as sampled.<br />
STATION NAME M ONTH(S) SAMPLED<br />
1A 19 th Street groin DEC 00<br />
1B 21 st Street groin JUL 00<br />
1C 24 th Stree t groin OCT 00, JUN O1<br />
1D 27 th Street groin JUN 00, JUN 01<br />
1E 33 rd Street groin MAY 00, JUN 00<br />
1F 37 th Street groin MAR 00<br />
1G 40 th Street groin JUL 00<br />
1H 44 th Street groin APR 00, AUG 00, APR 01<br />
1I 49 th Street groin JUN 00-NOV 00, JAN 01-MAR 01, MAY 01- AUG 01<br />
1J 51 st Street groin MAR 01, APR 01<br />
temperature, salinity, and turbidity measurements made prior to each sampling event. Surface water<br />
temperature was measured to the nearest degree Celsius using an alcohol-filled thermometer. Salinity was<br />
measured to the nearest part per thousand using an optical refractometer. Turbidity was measured to the<br />
nearest 0.1 centimeter using a 0.26-m diameter secchi disc.<br />
Substrate complexity of each collection site was assessed by measuring rugosity of the<br />
constituent jetty surface. Rugosity was measured with 1-m lengths of 20-gauge stainless steel wire<br />
molded to the surface of the jetty below the water line. The shortest straight-line distance between the two<br />
ends after the wire was molded to the jetty’s surface was then measured. The inverse ratio of this distance<br />
to the original length of the wire yielded an index value of rugosity. Rugosity was measured at three<br />
different locations chosen at random along the length the 15-m transects established for sampling after<br />
each collection effort. The structural complexity of blenny habitat also was assessed qualitatively through<br />
visual examination by noting fouling community coverage and species composition as well as general jetty<br />
construction (i.e. small vs. large boulders, placements of boulders, occurrence of crevices).<br />
Characterization of Blenny Assemblages<br />
Surf conditions permitting, three collections were conducted monthly at each upper, middle,<br />
lower coast station from May 2000 through August 2001 (July 2000 to August 2001 for South Padre<br />
Island). Blennies were captured in a 25.4 x 17.5 cm rectangular dipnet randomly swept along a 15-m<br />
transect against the jetty. Each collection was based on approximately 60 minutes of sampling for a total<br />
of 3 hours of effort expended at respective stations every month. If more than one collector was present,
15<br />
each worked a different 15-m transect for the same amount of time with their efforts considered two<br />
distinct collections. A paired sample t-test indicated no significant difference between collections made<br />
by different collectors at the same time and station. Depth of capture ranged between that of algae mats at<br />
the supralittoral fringe to approximately 1.5 m below the surface; however, water depth at most stations<br />
was considerably deeper than the area within reach of the sampling gear. Captured blennies were held in<br />
aerated 18.9-L buckets until completion of the collection. Other captured fishes were noted and released.<br />
Blennies were then sacrificed by immersion in MS-222, rinsed, and stored in 70% ethanol. Blennies were<br />
identified to species, enumerated, and measured (total length) to the nearest millimeter.<br />
Mark and Recapture Studies<br />
A mark-recapture study was conducted at respective locations to estimate relative abundance of<br />
constituent blenny species. Three mark-recapture experiments based on a minimum of 50 blennies<br />
collected from 10-m transects were conducted at each location. Each collection was initially placed in an<br />
aerated 18.9-L bucket and eventually transferred to another 18.9-L bucket containing seawater and the fish<br />
anesthetic quinaldine. Anesthetized fish were identified to species and marked using visible fluorescent<br />
elastomer injected subdermally above the anal fin (Guy et al. 1996, Gibson 1999). Marked fish were<br />
placed into another aerated 18.9-L bucket and allowed to recover before being released near their capture<br />
site. The same 10-m transects of jetty at each location were re-sampled 24 hours later and the number of<br />
marked and unmarked blennies within respective species recorded. Blennies captured in this second<br />
collection were sacrificed and used in the protocols described under Characterization of Blenny<br />
Assemblages (p. 10).<br />
Otolith Microstructure Analysis<br />
Sagittal otoliths were removed from <strong>Scartella</strong> <strong>cristata</strong> (n=106) captured from Galveston, Port<br />
Aransas, and South Padre Island from May through September 2000. S. <strong>cristata</strong> was chosen because it<br />
was encountered across all three localities. Individuals representing the range of sizes and collection dates<br />
were selected for further analysis. Otoliths were prepared following the protocols outlined by Secor et al.<br />
(1991) and Rooker and Holt (1997). Otoliths were individually mounted in blocks of Spurr resin and<br />
sectioned using an Isomet isometric saw (Buehler, Lake Bluff, IL). Each section was then attached to a
16<br />
microscope slide with Crystal Bond glue (Aremco Products Inc., Ossining, NY) and polished to the core<br />
on both sides using 240, 320, 400, and 600 grit Carbimet paper discs, Microcloth polishing cloth, and<br />
Micropolish 0.3 micron alpha alumina (Buehler, Lake Bluff, IL). Age of each individual was then<br />
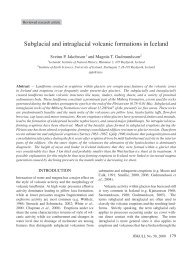
determined by counting daily growth increments from the core to the post rostrum (Fig. 3) under a<br />
compound light microscope using OPTIMAS ® version 6.0 image analysis software (Media Cybernetics,<br />
Inc., Silver Spring, MD).<br />
Daily increment formation was validated by marking otoliths with alizarin complexone. Thirtyfour<br />
<strong>Scartella</strong> <strong>cristata</strong> were held in a 250 mg/L alizarin complexone-seawater solution for approximately<br />
60 minutes to stain their otoliths. Individuals were then maintained in 75.8-L aquariums and sacrificed<br />
after 10 days (n=14), 17 days (n=6), and 30 days (n=14). Sagittal otoliths were removed from these<br />
specimens and prepared as outlined above. Both the number of growth increments and distance between<br />
the alizarin complexone mark and otolith’s post-rostral edge were measured. Least squares linear<br />
Fig. 3. Li ght mi crosc ope photograph of the sa gi tal otolith of <strong>Scartella</strong> <strong>cristata</strong> viewed at 100 X magni ficati on.<br />
Arrows in di cate a representative sample of daily growth rings.<br />
regression and ANOVA were performed to evaluate the relationship between the amount of otolith growth<br />
and time. The validation model was confirmed through analysis of covariance (ANCOVA) comparing 10-<br />
20 day increments measured at randomly chosen positions on the otolith to increment widths calculated
17<br />
for the same time period by the model. The validation trial confirmed that one ring represented one day’s<br />
growth but there was some uncertainty in reading the most recent rings on the otolith’s edge. Based on the<br />
alizarin complexone marking, otoliths grew at the rate of 0.33 μm/day. The validation model was<br />
compared to a least squares regression of a series of readings along short transects on the otolith surface<br />
(Fig. 4). While not a perfect match, ANCOVA validated the regression estimates of growth rate (p=0.943)<br />
and size-at-hatching (p=0.171).<br />
Age-length relationships were used to estimate growth of <strong>Scartella</strong> <strong>cristata</strong>. Hatch dates for all S.<br />
<strong>cristata</strong> captured under 270 mm TL were calculated by subtracting the estimated age in days from the date<br />
of capture. Individuals that exceeded 270 days old were excluded from the analysis due to an inability to<br />
discern their daily growth rings. No attempt was made to weigh large individuals during analysis to<br />
account for the cumulative effect of mortality on an age class because no published estimate of blenny<br />
mortality was found.<br />
20<br />
Increment width (um)<br />
15<br />
10<br />
5<br />
Increment Width=0.4078*Days+5.74 61<br />
R 2 =0.4157<br />
VAL ID ATIO N MODEL<br />
Increment Width=0.33*Days-0.34<br />
0<br />
5 10 15 20<br />
25 30 35<br />
Days<br />
Fig. 4. Comparison between the va lidation model of otolith growth increments and daily rings on the sagital otoliths of<br />
<strong>Scartella</strong> <strong>cristata</strong> a nd least squares regression of readings a nd increment width measures on the otolith surface.
18<br />
Mitochondrial DNA D-Loop Analysis<br />
Genetic analysis was performed on a subsample of <strong>Scartella</strong> <strong>cristata</strong> to identify relationships<br />
between sample sites and determine the origin(s) of individuals on Texas jetties. The null hypothesis that<br />
Texas jetties represented a single undifferentiated population originating from a single source population<br />
was tested. To this end, individuals ranging from 40 to 50 mm TL were selected from Galveston (n=20),<br />
Port Aransas (n=19), and South Padre Island (n=19) samples to minimize variation that may occur<br />
between age classes (Fig. 4). An additional nine individuals were collected from Gulf Islands National<br />
Seashore on Santa Rosa Island, Florida in December 2001 for use in this analysis (Fig. 5). DNA was<br />
extracted from these individuals following protocols described by Greig (2000) with minor modification.<br />
Galveston Island, Texas<br />
n=20<br />
Santa Rosa Island, Florida<br />
n=9<br />
Port Aransas, Texas<br />
n=19<br />
South Padre Island, Texas<br />
n=19<br />
Fig. 5. Capture locations of <strong>Scartella</strong> <strong>cristata</strong> used in mtDNA an alysis.<br />
Briefly, approximately 0.05 g of epaxial muscle tissue was added to a labeled 1.5 μL microfuge tube with<br />
200 μL of TENS solution (50 mM Tris-HCl [pH 8.0], 100 mM EDTA, 100 mM NaCl, 1.0% SDS) and 20
19<br />
μL of Proteinase K (10mg/ml) and incubated 10-12 hours at 55 C on a heat block. Nucleic acids were<br />
precipitated by adding 20 μL of 5 M NaCl and then spun at 14,000 g for 10 minutes. The sample<br />
supernatant was pipetted into a second microfuge tube and approximately 400 μL of 100% cold ethanol<br />
was added to precipitate DNA. The sample was spun again at 14,000 g for 10 minutes and the resulting<br />
supernatant discarded. DNA pellets were washed by adding 300 μL of 70% cold ethanol, spun again at<br />
14,000 g, and the resulting supernatant was discarded. Pellets were allowed to air-dry overnight. The<br />
DNA was resuspended in 100 μL of TE buffer (10 mM Tris-HCl [pH 8.0], 1 mM EDTA) and placed on a<br />
heat block at 65 C until the pellet fully dissolved. The presence and quality of extracted DNA was verified<br />
by electrophoresis of 3 μL of resuspended DNA through a 1.0% agarose gel at 100 V for approximately 30<br />
minutes. DNA was visualized using ethidium bromide.<br />
Polymerase chain reaction (PCR) was performed to amplify a 380 base pair segment of the<br />
mtDNA D-loop region using the heavy strand primer CSBD-H (5’-CCGGTCTGAACTCAGATCACGT-<br />
3’) and light strand primer L15998-PRO (5’-TACCCCAAACTCCCAAAGCTA-3’). PCR was conducted<br />
in Eppendorf Mastercycle Gradient (Brinkmann Instruments Inc., Westbury, NY) with the following<br />
reaction profile: initial denatuaration for 2 minutes at 94.0 C followed by 35 cycles (denaturation, 30<br />
seconds at 94.0 C; annealing, 45 seconds at 50.0 C; extension, 1 minute at 72.0 C) and a final extension<br />
for 3 minutes at 72.0 C. Electrophoresis through a 1.2 % agarose gel at 100 V for approximately 30<br />
minutes was used to examine the quality of PCR product and check for contamination. Again, ethidium<br />
bromide was used for visualization. Upon successful PCR, the product was cleaned of excess dNTP,<br />
primers, and AmpliTaq ® using ExoSAPIT ® (USB Corporation, Cleveland, OH) following manufacturer’s<br />
recommendations. Clean PCR products were prepared for cycle sequencing using a BigDye ® terminator<br />
cycle sequencing ready reaction kit (Applied Biosystems, Foster City, CA). Cycle sequencing was<br />
performed in an Eppendorf Mastercycler Gradient with the following reaction profile: 25 cycles<br />
(denaturation, 10 seconds at 96.0 C; annealing, 5 seconds at 50.0 C; extension, 4 minutes at 60.0 C). Upon<br />
completion of cycle sequencing, the product was cleaned using RapXtract ® II dye terminator removal kit<br />
(Prolinx, Bothell, WA) and diluted in 30 μL of dd H 2 O. Single strand nucleotide sequences were obtained
20<br />
using the ABI Prism 310 Genetic Analyzer (Applied Biosystems, Foster City, CA) at the Molecular<br />
Ecology and Fisheries Genetics Laboratory at Texas A&M University at Galveston.<br />
Data Analysis<br />
With the exception of DNA sequence data, all data analysis and statistical tests were performed<br />
using SPSS for Windows version 10.0.1 (SPSS Inc., Chicago, IL). Means are reported ± 1 standard<br />
deviation unless otherwise noted. The assumptions of parametric testing (normality, equality of variance,<br />
etc.) were validated and transformations were conducted when necessary. In the cases where a violation<br />
of assumptions could not be reconciled through transformation, the data (salinity and turbidity) were log<br />
transformed to minimize any effects of excessive variability and the appropriate test performed<br />
(Underwood 1981, 1997).<br />
Habitat characterization: Hydrographic measurements were grouped by season for analysis and a mean<br />
calculated for each parameter during summer (June-August), autumn (September-November), winter<br />
(December-February), and spring (March-May). Means for respective parameters were compared across<br />
seasons within a given location and between localities during each season using one-way analysis of<br />
variance (ANOVA). Significant differences (α=0.05) were identified with the Tukey post-hoc test.<br />
Turbidity data were log transformed to meet ANOVA’s assumption of equal variance.<br />
Mean rugosity for each location was compared using a one-way ANOVA and Tukey post-hoc<br />
test to determine if substrate complexity of collection sites at upper, middle, and lower coast jetties<br />
differed significantly from one another (α=0.05). Log transformation was necessary to satisfy the<br />
assumption of equal variance. Qualitative data were used to validate rugosity measures and to account for<br />
any observed differences.<br />
Blenny assemblage characterization: Species diversity was measured for each collection using the<br />
Shannon-Wiener diversity index,<br />
H<br />
nlog<br />
n −<br />
=<br />
i=<br />
1<br />
′<br />
k<br />
∑<br />
n<br />
f log f<br />
i<br />
i
21<br />
where n is the total number of blennies captured and f represents the number of individuals of each blenny<br />
species (Zar 1996). Species evenness, J ′ , was calculated as<br />
J ′ =<br />
H ′<br />
′<br />
H max<br />
where<br />
H<br />
′ and k represents the number of blenny species (Zar 1996). The mean monthly<br />
max<br />
=<br />
log k<br />
values of H ′ and J ′ for upper, middle, and lower coast stations were calculated and compared using oneway<br />
ANOVAs with Tukey post-hoc tests to identify significant differences (α=0.05).<br />
Catch per unit effort (CPUE), defined as the number of blennies per sampling-hour, was<br />
calculated for constituent species in each collection while mean seasonal CPUE was calculated for each<br />
species. Mean seasonal CPUE was compared across sites and among seasons at each locality with<br />
ANOVA and Tukey post-hoc tests. Analysis of covariance (ANCOVA) was used to determine if<br />
temperature, salinity, turbidity, date, or location correlated with CPUE. Inverse transformation<br />
(transformed CPUE=CPUE -1 ) allowed for all assumptions to be met.<br />
The monthly and overall mean total length were calculated for each species and compared within<br />
locations over time and between locations using ANOVA with Tukey post-hoc tests or t-tests where<br />
appropriate (α=0.05). Length-frequency distributions also were generated for constituent species in each<br />
collection. The total length data could not be reconciled with the assumptions of parametric testing. All<br />
analysis was conducted with log-transformed data.<br />
Mark and recapture: Population size within respective species was estimated using the Petersen equation,<br />
M ( C + 1)<br />
N =<br />
R + 1<br />
where N is the population estimate, M is the number of blennies initially marked, R is the number of<br />
marked blennies recaptured, and C is the total number of fish captured in the second sampling effort (Guy<br />
et al. 1996).<br />
Age and growth: Differences in growth rates of <strong>Scartella</strong> <strong>cristata</strong> among the three study sites were<br />
determined through linear regression and ANCOVA. Age-length relationships generated for each site
22<br />
were used to estimate the age of every <strong>Scartella</strong> <strong>cristata</strong> captured from that site during the study. Overall<br />
mean age at each site was calculated and compared among locations using ANOVA with Tukey post-hoc<br />
tests.<br />
Genetic analysis: DNA sequences were visually aligned and edited using BioEdit Sequence Alignment<br />
Editor version 5.0.7 (Hall 1999). DNA polymorphisms in the aligned sequences and genetic variation<br />
within samples were assessed through calculations of nucleotide diversity (π) and haplotype diversity (h)<br />
using DnaSP version 3.51 (Rozas and Rozas 1999). Genetic distances were estimated using the Tamura-<br />
Nei model with pairwise deletion, and a neighbor-joining tree with 500 bootstrap replicates was<br />
constructed using MEGA version 2.1 (Kumar et al. 2001). TCS version 1.13 (Clement et al. 2000) was<br />
used to identify haplotypes and determine haplotype relationships. Analysis of molecular variance<br />
(AMOVA) was performed using Arlequin version 2.000 (Schnieder et al. 2000) to determine the<br />
proportion of genetic diversity within and among sample sites (Φ ST ). AMOVA calculates the difference<br />
between mean heterozygosity among population subdivisions and potential frequency of heterozygotes<br />
using a modification of Wright’s F-statistic (Excoffier et al. 1992). It operates under the assumptions that:<br />
individuals in the sample are selected independently and at random; individuals within the population can<br />
interbreed randomly and non-assortatively; and there is no inbreeding within the population (Excoffier<br />
1992). The number of migrants per generation (N m ) among samples sites also was estimated using<br />
Arlequin. Mismatch distributions of the frequency of a given number of pairwise differences were<br />
generated for each location with Arlequin. These distributions were compared to a Poisson distribution<br />
with the same mean as the using chi-square test. Distributions that differed significantly (α=0.05) from the<br />
Poisson distribution indicated samples were taken from a population of constant size, whereas failure to<br />
reject the null hypothesis suggested the population has been growing exponentially for an extended period<br />
of time (Slatkin and Hudson 1991). Mantel’s test with 1000 permutations was performed using TFPGA<br />
version 1.3 (Miller 1997) to determine if a significant relationship existed between genetic distances and<br />
geographical distances among locations.
23<br />
RESULTS<br />
Habitat Characterization<br />
Water temperature at the three study sites was similar (Fig. 6). Temperatures peaked in late<br />
summer and early fall (Galveston: 32.0°C; Port Aransas: 31.0°C; South Padre Island: 31.7°C) and then<br />
declined to their minimum in December and January (Galveston: 13.0°C; Port Aransas: 14.0°C; South<br />
Padre Island: 14.0°C). Overall mean water temperature from spring 2000 to summer 2001 was 23.1±6.7,<br />
25.0±6.1, and 24.1±4.9°C for Galveston, Port Aransas, and South Padre Island, respectively. Significant<br />
seasonal differences in temperature were observed at each study site (Galveston: p
24<br />
less variable from north to south along the coast. Galveston had significantly lower overall mean salinity<br />
than did Port Aransas (p=0.016) and South Padre Island (p=0.007). There was no significant difference<br />
between Port Aransas and South Padre Island (p=0.92).<br />
Turbidity, as estimated by secchi disc measurements, remained relatively constant in Galveston<br />
(25-55 cm) during the study period. In Port Aransas turbidity peaked in spring 2001 (40 cm) and was<br />
lowest in summer 2001 (144 cm) while that at South Padre Island ranged from 135 cm in fall 2000 to 51<br />
cm in summer 2000. Turbidity typically decreased from north to south, with overall mean estimates for<br />
Galveston, Port Aransas, and South Padre Island being 34.2±11.4, 79.7±52.6, and 88.0±54.8 cm,<br />
respectively. Galveston yielded significantly higher overall mean turbidity (p
25<br />
the Galveston beachfront were largely bare rock with a poorly developed fouling community of barnacles,<br />
oysters, and filamentous epilithic algae. While the rocks of the South Jetty at Aransas Pass did not appear<br />
to differ structurally from those of Galveston, the biological complexity of their fouling community was<br />
much greater. The South Jetty was mostly covered by dense mats of filamentous and foliose epilithic<br />
35<br />
30<br />
Temperature (C)<br />
25<br />
20<br />
15<br />
10<br />
5<br />
0<br />
40<br />
35<br />
30<br />
Salinity (ppt)<br />
25<br />
20<br />
15<br />
10<br />
5<br />
0<br />
250<br />
Secchi disc reading (cm)<br />
200<br />
150<br />
100<br />
50<br />
0<br />
SPRING<br />
20 00<br />
SUMMER<br />
2000<br />
FALL<br />
2000<br />
WINTER<br />
2000-01<br />
SP RING<br />
2001<br />
SUMMER<br />
2001<br />
Galveston Port Aransas South Padre Island<br />
Fig. 6. Mean seasonal water temperature, salinity, and secch i di sc estimates<br />
of turbidity at Galveston, Port Aransas, and South Padre Islan d, TX from<br />
Spr ing 2000 to Summer 2001. Error bars represent standard error.
26<br />
algae that often grew on extensive beds of mussels and barnacles. The North Jetty at Brazos Santiago Pass<br />
exhibited little difference in the structural complexity of the rocks, but the arrangement of the rocks on the<br />
channel side of the jetty created habitats that were similar to tide pools. Its rocks also were almost<br />
completely covered by thick epilithic algae mats comprised of structurally complex species in the genera<br />
Caulerpa and Padina. In places, calcareous remains of Padina formed growths resembling hermatypic<br />
coral. Density and distribution of mussel and barnacle beds on the North Jetty were more restricted than<br />
that at the other two sites (Fig. 7).<br />
Characterization of Blenny Assemblages<br />
A<br />
1.25<br />
1.00<br />
Rugosity Index<br />
0.75<br />
0.50<br />
0.25<br />
0<br />
B<br />
Galv eston Port Aransas South Padre<br />
Island<br />
Galveston Port Ara nsas South Padre<br />
Islan d<br />
Fig. 7. Comparison of quan titati ve and quali tative measures of habi tat<br />
complexity at Texas groins and jetties. (A) Mean rugosity indices for the<br />
groins/jetties at Galveston, Port Aransas, and South Padre Island. Error bars<br />
represent standard error. (B) Examples of the typical development of the<br />
jetty fouling community.
27<br />
Species Composition<br />
A total of 4555 blennies representing five species (Labrisomus nuchipinnis, Hypleurochilus<br />
geminatus, Hypsoblennius hentz, Hypsoblennius ionthas, and <strong>Scartella</strong> <strong>cristata</strong>) was captured from the<br />
three study sites during May 2000 through August 2001. Catch statistics for these species and study sites<br />
are summarized in Table 2. Catch per unit effort (CPUE) of blennies and species composition varied<br />
temporally and spatially. Temperature (p
28<br />
24<br />
40<br />
CPUE (# of blennies/net-hour)<br />
21<br />
18<br />
15<br />
12<br />
9<br />
6<br />
3<br />
35<br />
30<br />
25<br />
20<br />
15<br />
10<br />
5<br />
Salinity (ppt) and Temperature (C)<br />
0 0<br />
MAY<br />
JUN<br />
JUL<br />
AUG<br />
SEP<br />
OCT<br />
NO V<br />
DEC<br />
Hypleurochilus geminatus Hy psoblennius ionthas <strong>Scartella</strong> crista ta<br />
Salinity<br />
Temperature<br />
Fig. 8. Blen ny catch pe r u nit effort (CPUE), salinity (ppt) and water tem perature (C) at groins on the Galve ston Island, TX<br />
beachfront during May 2000 through August 2001.<br />
JAN<br />
FEB<br />
MAR<br />
APR<br />
2000 2001<br />
MAY<br />
JUN<br />
JUL<br />
AUG<br />
35.4±42.9. <strong>Scartella</strong> <strong>cristata</strong> was the dominant blenny with CPUE ranging from 0.7 to 141.9 and an<br />
overall mean of 33.9±42.9. CPUE remained relatively high throughout the year but peaked in late summer<br />
24<br />
237.7 99.9 55.6 76.7<br />
40<br />
CPUE (# of blennies/net-hour)<br />
21<br />
18<br />
15<br />
12<br />
9<br />
6<br />
3<br />
NO EFFORT<br />
NO EFFORT<br />
NO EFFORT<br />
0 0<br />
MA Y<br />
JUN<br />
JUL<br />
AUG<br />
SEP<br />
OCT<br />
NO V<br />
DEC<br />
JAN<br />
FEB<br />
MAR<br />
APR<br />
MAY<br />
JUN<br />
JUL<br />
AUG<br />
2000 2001<br />
Labrisomus nuchipinnis Hypl euro chilus gemin atus<br />
<strong>Scartella</strong> crista ta<br />
35<br />
30<br />
25<br />
20<br />
15<br />
10<br />
5<br />
Salinity (ppt) and Temperature (C)<br />
Salinity<br />
Temperature<br />
Fig. 10. Blenny ca tch per unit effort (CPUE), salinity (ppt) and wa ter temperature (C) at the North Jetty on South Padre Island,<br />
TX during May 2000 through August 2001.
29<br />
and declined quickly by mid winter (Fig. 9). Except for one Hypleurochilus geminatus, S. <strong>cristata</strong> was the<br />
only species captured on the Gulf side of the jetty (station 3) where its overall mean CPUE was 96.8±94.9.<br />
Although S. <strong>cristata</strong> also dominated blenny catches on the channel side of the jetty (station 2), its overall<br />
mean CPUE (10.8±9.9) was significantly lower (p
30<br />
1.7 to 237.7. CPUE did not differ significantly (p=0.882) from Gulf side (station 4: 48.0±67.7) to the<br />
channel side (station 5: 53.5±82.4) of the jetty. It peaked in summer and early fall then declined during<br />
winter (Fig. 10). Labrisomus nuchipinnis’ monthly mean CPUE ranged from 0 to 6.0 with an overall<br />
mean CPUE of 1.7±1.9. No significant difference (p=0.69) was found between its overall mean CPUE on<br />
the Gulf side (1.1±2.3) and that on the channel side (1.9±1.8). CPUE for this species peaked in mid to late<br />
summer and declined through fall (Fig. 10). Hypleurochilus geminatus, caught at South Padre Island only<br />
in spring-early summer of 2001, exhibited a relatively low overall mean CPUE (0.7±2.0) with monthly<br />
catch rates ranging from 0 to 9.6.<br />
Size Structure<br />
Total length (TL) of <strong>Scartella</strong> <strong>cristata</strong> captured ranged from 8 to 115 mm with site means at<br />
Galveston, Port Aransas and South Padre Island being 51.9±22.3, 36.1±15.9, and 36.3±15.9 mm,<br />
respectively (Table 3, Fig. 11). Mean TL of S. <strong>cristata</strong> in Galveston was significantly larger than that<br />
Table 3. Number and mean total lengths (TL) of individuals representing five blenny specie s captured at<br />
Galveston, Port Aransas, and South Padre Island, TX during May 2000 through August 2001.<br />
Galveston Port Aransas South Padre Island<br />
Species n mean TL (mm) n mean TL (mm) n mean TL (mm)<br />
Labrisomus nuchipinnis 0 9 59.00 80 60.49<br />
Hypleurochilus geminatus 199 37.49 65 40.94 24 22.17<br />
Hypsobl ennius hentz 0 6 25.83 0<br />
Hypsoblennius ionthas 59 26.41 0 0<br />
<strong>Scartella</strong> <strong>cristata</strong> 194 51.93 1867 36.08 2052 36.28<br />
from South Padre Island (p
31<br />
60<br />
n=195<br />
50<br />
TL (mm)<br />
40<br />
30<br />
n=1867 n=2052<br />
20<br />
10<br />
0<br />
Galveston<br />
Port Aransas<br />
South Padre Island<br />
Fig. 11. Me an total length (TL) and its standard error for <strong>Scartella</strong> <strong>cristata</strong> at Galv eston, Port Aransas, and South Padre<br />
Island, TX from Ma y 2000 to August 2001. n represents the number of indiv iduals sampled from each location.<br />
Hypleurochilus geminatus ranged from 15 to 94 mm TL with the largest size classes (81-90 and<br />
91-100 mm) collected only in Galveston (Appendix A). Overall mean TL for conspecifics from<br />
Galveston, Port Aransas, and South Padre Island was 37.49, 40.94, and 22.17 mm, respectively (Table 3,<br />
Fig. 13). Port Aransas yielded the largest individuals (Galveston: t=-3.344, p=0.001; South Padre Island:<br />
t=6.880, p
32<br />
(Fig. 12) as a result of no recruitment pulses. Individuals less than 40 mm TL were captured only during<br />
summer (Appendix A).<br />
200<br />
175<br />
G<br />
150<br />
125<br />
100<br />
75<br />
50<br />
25<br />
0<br />
200<br />
175<br />
PA<br />
TL (mm)<br />
150<br />
125<br />
100<br />
75<br />
50<br />
25<br />
NO EFFORT<br />
0<br />
200<br />
175<br />
SPI<br />
150<br />
125<br />
100<br />
75<br />
50<br />
25<br />
NO EFFORT<br />
NO EFFORT<br />
NO EFFORT<br />
0<br />
MAY<br />
Labrisomus<br />
nuchipinnis<br />
JUN<br />
JUL<br />
AUG<br />
SEP<br />
Hypleurochilus<br />
geminatus<br />
OCT<br />
NOV<br />
DEC<br />
JAN<br />
FEB<br />
MAR<br />
APR<br />
2000 2001<br />
Hypsoblenni us<br />
hentz<br />
MA Y<br />
Hypsoblennius<br />
ionthas<br />
JUN<br />
JUL<br />
AUG<br />
<strong>Scartella</strong><br />
<strong>cristata</strong><br />
Fig. 12. Monthly mean total length (TL) and its standard error for five blenny<br />
species at Galveston (G), Port Aransa s (PA) and South Padre Island (SPI), TX from<br />
May 2000 to August 2001.
33<br />
Hypsoblennius hentz and Hypsoblennius ionthas did not exhibit seasonal size trends. Both<br />
species were captured across relatively narrow size ranges and at similar mean TL (H. hentz: 22-31 mm<br />
TL, mean=25.83 mm; H. ionthas: 12-50 mm TL, mean=26.41 mm) (Table 3, Fig. 12). Length frequency<br />
distributions indicated relatively strong recruitment of H. ionthas at Galveston in late spring of 2000, with<br />
those cohorts persisting through August and virtually absent thereafter (Fig. 12, Appendix A).<br />
50<br />
n=65<br />
40<br />
n=199<br />
TL (mm)<br />
30<br />
20<br />
n=24<br />
10<br />
0<br />
Galveston<br />
Port Aransas<br />
South Padre Island<br />
Fig. 13. Mean total length (TL) and its standard error for Hypleurochilus geminatus at Galveston, Port Aransas, and South<br />
Padre Island, TX from May 2000 to August 2001. n represents the number of individuals sampled from each location.
34<br />
80<br />
n=9<br />
70<br />
n=80<br />
60<br />
TL (mm)<br />
50<br />
40<br />
30<br />
n=0<br />
20<br />
10<br />
0<br />
Galveston<br />
Por t Aransas<br />
South Padre Island<br />
Fig. 14. Mean total length and its standa rd error for Labris omus n uchipin nis at Galveston, Port Ara nsas, and South Padre<br />
Island, TX from May 2000 to August 2001. n represents the number of individuals sampled from each location.<br />
Species Diversity and Evenness<br />
Monthly mean blenny diversity ( H ′ ) was 0.23±0.02, 0.11±0.11, and 0.09±0.08 for Galveston,<br />
Port Aransas, and South Padre Island, respectively (Fig. 15). Galveston had significantly higher diversity<br />
than did other sites (p=0.001). Monthly diversity never exceeded 0.4 at any site and was never greater<br />
than 0.22 at South Padre Island. Although highly variable, diversity generally peaked in late spring,<br />
declined through summer and fall, and increased by late winter. This pattern was best defined at Port<br />
Aransas (Fig. 16).<br />
Evenness values of 0.64±0.37, 0.29±0.30, and 0.30±0.26 were observed for Galveston, Port<br />
Aransas, and South Padre Island respectively (Fig. 15). Galveston also exhibited a significantly higher<br />
evenness value (p=0.001) than did other sites. Evenness at Galveston remained fairly high throughout<br />
summer and fall (0.60-0.98), declined dramatically in winter and was relatively low (0.00-0.40) through<br />
spring. Evenness at Port Aransas mirrored species diversity by peaking in spring and diminishing through<br />
fall. The only pattern in species evenness at South Padre Island was values in 2000 were considerably<br />
higher than those in 2001 (Fig. 16).
35<br />
0.8<br />
0.7<br />
H’ J’<br />
H’ and J’ index value<br />
0.6<br />
0.5<br />
0.4<br />
0.3<br />
0.2<br />
0.1<br />
0<br />
Galveston Port Aransas South Padre Island<br />
Fig. 15. Mean monthly Shannon-Wiener diversity index (H’) and species evenness (J’) and their standard errors for<br />
blenny assemblages at Galveston, Port Aransas, and South Padre Island, TX from May 2000 to August 2001.<br />
Estimate of <strong>Scartella</strong> <strong>cristata</strong> Population Density<br />
<strong>Scartella</strong> <strong>cristata</strong> was chosen for mark recapture studies because of its dominance and apparent<br />
high population density on Texas jetties. Three complete mark-recapture collections were performed at<br />
Port Aransas in June 2001 and were the basis for population estimates ranging from 158 to<br />
281individuals/linear meter of jetty. These estimates yielded an overall mean of 214 individuals/linear<br />
meter of jetty and standard error of 36. CPUE data generated at the same station concurrent to mark<br />
recapture experiments and converted to number of individuals per linear meter of jetty estimated mean<br />
density to be 11.2 with a standard error of 3.2—approximately 5.2% of the density estimated through<br />
mark-recapture trials.<br />
Age Structure of <strong>Scartella</strong> <strong>cristata</strong> Along the Texas Coast<br />
Microstructure analysis of otoliths indicated <strong>Scartella</strong> <strong>cristata</strong> ranged in age from 47 (12 mm TL)<br />
to 466 days (78 mm TL). Mean age-at-capture for Galveston, Port Aransas, and South Padre Island<br />
individuals was 213.0±114.1, 131.6±81.7, and 132.7±81.7 days, respectively. These means differed
36<br />
1.0<br />
0.8<br />
G<br />
0.6<br />
0.4<br />
0.2<br />
H’ and J’ index value<br />
0<br />
1.0<br />
0.8<br />
0.6<br />
0.4<br />
0.2<br />
0<br />
1.0<br />
NO EFFORT<br />
PA<br />
SPI<br />
0.8<br />
0.6<br />
0.4<br />
0.2<br />
0<br />
NO EFFORT<br />
MAY<br />
NO EFFOR T<br />
JUN<br />
JUL<br />
AUG<br />
SEP<br />
OCT<br />
NOV NO EFFORT<br />
DEC<br />
JAN<br />
FEB<br />
MAR<br />
APR<br />
MAY<br />
JUN<br />
JUL<br />
AUG<br />
2000 2001<br />
H’ J’<br />
Fig. 16. Monthly mean Shannon Wiener diversity index (H’) a nd species evenness<br />
(J’) and their standard errors for blenny assemblages at Galveston (G), Port Aransas<br />
(PA) and South Padre Island (SPI), TX from May 20 00 to August 2001.<br />
statistically among locations (p
37<br />
Mean age of individuals from the middle and lower coast was statistically similar (p=0.91).<br />
Hatch-date distributions were generated for the three sites using age-length keys. While <strong>Scartella</strong><br />
<strong>cristata</strong> hatch throughout the year on the Texas coast, 48.2% of hatchings occurred between January and<br />
March with an additional 29.9% taking place in April and May (Fig.17). The majority of individuals<br />
(67.5%) captured in Galveston hatched between January and May (Fig. 18) with activity peaking in<br />
January and March. Hatch-date distributions were more protracted in Port Aransas, lasting from January<br />
to early July and peaking between April and June (Fig. 19). South Padre Island was the site of year-round,<br />
low level hatching activity that peaked October to March (Fig. 20).<br />
20<br />
% of individuals<br />
15<br />
10<br />
5<br />
0<br />
JAN FEB MAR APR MAY JUN JUL AUG SEP OCT NOV DEC<br />
Fig. 17. Pooled hatch date distribution of <strong>Scartella</strong> <strong>cristata</strong> collected from Galveston, Port Aransas, and South Padre<br />
Is land, TX and colle cted between July 2000 and August 2001.<br />
<strong>Scartella</strong> <strong>cristata</strong> grew at a rate of 0.25 (r 2 =0.69), 0.26 (r 2 =0.51), and 0.20 (r 2 =0.34) mm/day at<br />
Galveston, Port Aransas, and South Padre Island, respectively (Fig. 21). Growth rate among sites was<br />
statistically similar (p=0.252) and yielded a composite value of 0.2 (r 2 =0.44) mm/day.
38<br />
3.0<br />
2.4<br />
1999<br />
n=6<br />
1.8<br />
1.2<br />
0.6<br />
% OF INDIVIDUALS<br />
0<br />
3.0<br />
2.4<br />
1.8<br />
1.2<br />
0.6<br />
0<br />
3.0<br />
2.4<br />
Date of first sample<br />
Date of last sample<br />
2000<br />
n=96<br />
2001<br />
n=60<br />
1.8<br />
1.2<br />
0.6<br />
0<br />
JAN<br />
FEB<br />
MAR<br />
APR<br />
MAY<br />
JUN<br />
JUL<br />
AUG<br />
SEP<br />
OCT<br />
NOV<br />
DEC<br />
Fig. 18. Hatch date distribution of <strong>Scartella</strong> <strong>cristata</strong> collected from Galveston, TX<br />
between May 2000 and August 2001. No estimates of mortality were incorporated into<br />
this dataset. Only individuals whose age was calculated at or less than 270 days were<br />
used to generate this distribution due to difficulty in reading daily growth increments<br />
beyond that age.
39<br />
2.5<br />
2.0<br />
1999<br />
n=52<br />
1.5<br />
1.0<br />
0.5<br />
% OF INDIVIDUALS<br />
0<br />
2.5<br />
2.0<br />
1.5<br />
1.0<br />
0.5<br />
0<br />
2.5<br />
2.0<br />
Date of first sample<br />
Date of last sample<br />
2000<br />
n=979<br />
2001<br />
n=710<br />
1.5<br />
1.0<br />
0.5<br />
0<br />
JAN<br />
FEB<br />
MAR<br />
APR<br />
MAY<br />
JUN<br />
JUL<br />
AUG<br />
SEP<br />
OCT<br />
NOV<br />
DEC<br />
Fig. 19. Hatch date distribution of <strong>Scartella</strong> <strong>cristata</strong> collected from Port Aransas, TX<br />
between May 2000 and August 2001. No estimates of mortality were incorporated into<br />
this dataset. Only individuals whose age was calculated at or less than 270 days were<br />
used to generate this distribution due to difficulty in reading daily growth increments<br />
beyond that age.
40<br />
3.0<br />
2.4<br />
1999<br />
n=17<br />
1.8<br />
1.2<br />
0.6<br />
% OF INDIVIDUALS<br />
0<br />
3.0<br />
2.4<br />
1.8<br />
1.2<br />
0.6<br />
0<br />
3.0<br />
2.4<br />
1.8<br />
Date of first sample<br />
Date of last sample<br />
2000<br />
n=524<br />
2001<br />
n=1374<br />
1.2<br />
0.6<br />
0<br />
JAN<br />
FEB<br />
MAR<br />
APR<br />
MAY<br />
JUN<br />
JUL<br />
AUG<br />
SEP<br />
OCT<br />
NOV<br />
DEC<br />
Fig. 20. Hatch date distribution of <strong>Scartella</strong> <strong>cristata</strong> collected from South Padre<br />
Island, TX between July 2000 and August 2001. No estimates of mortality were<br />
incorporated into this dataset. Only individuals whose age was calculated at or less<br />
than 270 days were used to generate this distribution due to difficulty in reading daily<br />
growth increments beyond that age.
41<br />
100<br />
80<br />
SLOPE INT ERCE PT R 2<br />
Galveston 0.246 8.70 0.69<br />
Port Aransas 0.255 -3.63 0.51<br />
South Padre Island 0.146 17.84 0.34<br />
Pooled 0.195 10.42 0.44<br />
TL (mm)<br />
60<br />
40<br />
20<br />
0<br />
0 50 100 150 200 250 300<br />
Age (days)<br />
Fig. 21. Age-length relationship for <strong>Scartella</strong> <strong>cristata</strong> captured at Galveston, Port Aransas, and South Padre Island, TX<br />
jetties from May through September 2000. Individuals older than 270 days are excluded from this analysis due to difficulty in<br />
reading daily growth increments beyond that age .<br />
Genetic Structure and Origins of <strong>Scartella</strong> <strong>cristata</strong> on the Texas Coast<br />
Comparison of mtDNA D-loop sequences performed for <strong>Scartella</strong> <strong>cristata</strong> revealed 30<br />
aplotypes distinguished by 22 variable sites. Polymorphic sites corresponded to 11 transitions, 10<br />
transversions, and a single nucleotide attributable to an insertion/deletion event. Sequences for each<br />
haplotype characterized appear in Appendix B. Haplotype diversity (h) within each sample was high,<br />
being 0.833, 0.805, 0.959, and 0.977 at Florida, Galveston, Port Aransas, and South Padre Island,<br />
Table 4. Sample size, haplotype diversity (h), and nucleotide dive rsity<br />
(p) for <strong>Scartella</strong> <strong>cristata</strong> from sample sites in the Gulf of Mexico.<br />
LOCATION n h π<br />
Florida 9 0.833 0.004<br />
Galveston 20 0.805 0.005<br />
Port Aransas 19 0.959 0.010<br />
South Padre Island 19 0.977 0.011
42<br />
respectively (Table 4). Nucleotide diversity (π) varied from low levels in Florida (0.004) and Galveston<br />
(0.005) samples to more intermediate levels in those from Port Aransas (0.010) and South Padre Island<br />
(0.011) (Table 4). Most haplotypes represented in Florida and Galveston samples were shared between<br />
the two sites, whereas more than half of those found in Port Aransas and South Padre Island samples were<br />
unique to either site (Table 5). Only one haplotype (D) was shared across all four sites (Table 5). The<br />
Florida sample was dominated by one haplotype (B) accounting for 44% of its constituents. Three closely<br />
Table 5. Haplotype distribution for <strong>Scartella</strong> <strong>cristata</strong> ba sed on 380 base pairs o f the<br />
D-loop re gion from Florida, Galve ston, Port Aransas, and South Padre Isla nd, TX.<br />
Haplotypes are designated by letters in the first column.<br />
Haplotype Florida Ga lveston Port Ara nsas South Pa dre<br />
A 1 4 2<br />
B 4 7 1<br />
C 1 1<br />
D 1 4 1 1<br />
E 5 2 3<br />
F 1 1<br />
G 1<br />
H 1 1<br />
I 1<br />
J 1<br />
K 1<br />
L 1<br />
M 1<br />
N 1<br />
O 1 1<br />
P 1<br />
Q 1<br />
R 1<br />
S 1<br />
T 1 1<br />
U 1<br />
V 1<br />
W 1<br />
X 1<br />
Y 1<br />
Z 1<br />
AA 1<br />
AB 1<br />
AC 1<br />
AD 1
43<br />
elated haplotypes (B, D, E) accounted for 80% of the individuals in the Galveston sample whereas no<br />
single haplotype was dominant at Port Aransas or South Padre Island (Table 5, Fig. 22, 23).<br />
There was little genetic distance among samples (Fig. 24). Genetic distances ranged from 0.005<br />
between Florida-Galveston to 0.011 between Galveston-Port Aransas and Port Aransas-South Padre Island<br />
(Table 6) and averaged 0.009 (S.E.=0.003). Mantel’s test generated a correlation coefficient of -0.217, to<br />
indicate no significant relationship (p≥0.658) between genetic distance and geographic distance. AMOVA<br />
revealed that samples from Florida and Galveston were statistically similar (p>0.58) as were Port Aransas<br />
and South Padre Island (p>0.23). No such similarity (p≤0.01) was found between Florida or Galveston<br />
samples and those of Port Aransas and South Padre Island (Table 6). While the majority of variance<br />
(80%) could be accounted for within samples, a significant portion (20%) was attributed to among group<br />
variance (Φ ST ) corresponding to the differentiation between Florida-Galveston and Port Aransas-South<br />
Padre Island. The Φ ST values, in ranging from –0.24 to 0.30, indicated low levels of population structure<br />
(Table 6). Number of migrants per generation (N m ) was high between Florida-Galveston (∞) and Port<br />
Aransas-South Padre Island (55.6) but an order of magnitude lower among other site comparisons that<br />
ranged from 3.8 for Galveston-South Padre Island to 1.2 between Florida-Port Aransas (Table 6). This<br />
gene flow did not prevent Florida and Galveston samples from exhibiting a haplotype frequency distinct<br />
from those in south Texas (Fig. 22, 23).<br />
Table 6. Genetic isolation of <strong>Scartella</strong> <strong>cristata</strong> at Gulf of Mexico study sites relative to geographic distance between sites.<br />
Linear distances (km) between pairs of study sites, Tamura-Nei genetic distance (d), the among-group component of genetic<br />
variation (Φ ST ), a statistical test based on haplotype frequency shifts and an estimate of gene flow in terms of the number of<br />
migrants per generation (N m ) are presented.<br />
LOCATIONS DISTANCE (km) d F ST EXACT TEST N m<br />
Florida-Galveston 689 0.005 -0.24 (p >0.58) 8<br />
Florida-Port Aransas 763 0.011 0.30 (p
44<br />
I<br />
n=<br />
12<br />
10<br />
7-8<br />
2<br />
1<br />
Florida<br />
Galveston<br />
Port Aransas<br />
South Padre Island<br />
H<br />
S<br />
Y<br />
P<br />
AA<br />
V<br />
AB<br />
G K<br />
D<br />
B<br />
F<br />
E<br />
C<br />
O<br />
A<br />
X J<br />
R<br />
T<br />
Q U M<br />
L<br />
AC<br />
AD<br />
N<br />
Z<br />
W<br />
Fig. 22. Composite haplotype distribution of mtDNA D-loop sequences of <strong>Scartella</strong> <strong>cristata</strong> from Florida, Galveston, Port<br />
Aransas and South Padre Island, TX. Diameter of each circle represents frequency of occurrence of that haplotype within a<br />
site. The division of each circle represents percent of individuals from a particular site exhibiting that haplotype. Empty<br />
circles represent hypothesized intermediates. Alternative linkages are represented by dotted lines.
45<br />
A<br />
H<br />
I<br />
H<br />
F<br />
D<br />
D<br />
C<br />
F<br />
Florida<br />
n=9<br />
B<br />
G<br />
B<br />
Galveston<br />
n=20<br />
S<br />
E<br />
C Y w Z<br />
AA<br />
D<br />
N<br />
D<br />
L<br />
B<br />
Q K<br />
M<br />
E T<br />
J A O<br />
P<br />
AC<br />
U<br />
A<br />
T<br />
E<br />
V<br />
O<br />
AB<br />
X<br />
Port Aransas<br />
n=19<br />
R<br />
AD<br />
South Padre<br />
Island<br />
n=19<br />
Fig. 23. Haplotype distributions of mtDNA D-loop sequences of <strong>Scartella</strong> <strong>cristata</strong><br />
from Florida, Glaveston, Port Aransas and South Padre Island, TX. Empty circles<br />
represent hypothesized intermediates. Alternative linkages are represented as<br />
dotted lines.
46<br />
Florida<br />
Galveston<br />
Port Aransas<br />
South Padre Island<br />
0.005<br />
Fig. 24. Genetic distances between <strong>Scartella</strong> <strong>cristata</strong> from Florida, Galveston, Port<br />
Aransas, and South Padre Island, TX.
47<br />
45<br />
Florida<br />
n=9<br />
45<br />
Port Aransas<br />
n=19<br />
30<br />
30<br />
15<br />
15<br />
Frequency<br />
0<br />
45<br />
0<br />
1 2 3 4 5 6 7 8 9 10 11 12 13<br />
Galvesto n<br />
n=20<br />
0<br />
45<br />
0<br />
1 2 3 4 5 6 7 8 9 10 11 12 13<br />
South Pa dre Island<br />
n=19<br />
30<br />
30<br />
15<br />
15<br />
0<br />
0<br />
1 2 3 4 5 6 7 8 9 10 11 12 13<br />
Number of Pairwise Differences<br />
Fig. 25. Mis match distributions(histogram ) and their expected Poisson distribution for mtDNA D-loop sequence s of<br />
<strong>Scartella</strong> crista ta from Florida, Galveston, Port Aransas, and South Padre Island, TX.<br />
0<br />
0<br />
1 2 3 4 5 6 7 8 9 10 11 12 13<br />
DISCUSSION AND CONCLUSION<br />
Structure and Composition of Blenny Assemblages on Texas Jetties<br />
Variability in Species Composition<br />
The data suggests that blenny assemblages are different in species composition, diversity and<br />
evenness among the locations sampled. Assemblages on the upper Texas coast at Galveston were<br />
dominated to similar extents by Hypleurochilus geminatus and <strong>Scartella</strong> <strong>cristata</strong>. Hypsoblennius ionthas<br />
also occurred sporadically on these jetties. Four blenny species were captured on jetties from the middle<br />
Texas coast at Port Aransas. <strong>Scartella</strong> <strong>cristata</strong> was the dominant species, but H. geminatus and<br />
Labrisomus nuchipinnis were taken regularly. Hypsoblennius hentz was a fourth but rare inhabitant of<br />
jetties in this area. Differences between Port Aransas stations 2 and 3 suggest that these sites may not<br />
encompass the range of variability blenny assemblages encounter on a jetty. Despite exhibiting similar
48<br />
diversity and evenness values, Port Aransas and lower Texas coast at South Padre Island yielded blenny<br />
assemblages with distinct species composition. The blenny assemblages at South Padre Island were<br />
dominated by S. <strong>cristata</strong>. Labrisomus nuchipinnis occurred with greater frequency here than on the<br />
middle Texas coast. Hypeurochilus geminatus was rarely encountered and only as small individuals (
49<br />
during early life stages of these fishes. Studies by Hunte and Côté (1989) on redlip blennies<br />
(Ophioblennius atlanticus) in the Caribbean, Pfister (1996) on intertidal sculpins (Clinocottus spp. and<br />
Oligocottus spp.) in the Pacific northwest, and Ruchon et al. (1998) on the blenny Lipophrys pavo in the<br />
Mediterranean indicate that post-recruitment processes such as competition operate independent of those<br />
occurring in the plankton to impact the adult population (Hunte and Côté 1989, Jones 1991, Pfister 1996,<br />
Ruchon et al. 1998).<br />
Blenny catches on Texas jetties tended to vary with changes in water temperature; however,<br />
selectivity of sampling gear and blenny behavior during winter months may have accounted for temporal<br />
variability in CPUE. For example, blenny CPUE declined during winter 2000-01 from higher fall and<br />
spring levels at all three sites. It is likely that winter conditions (i.e. cold temperatures and rough surf)<br />
result in blenny mortality (Santos and Nash 1996) thereby impacting CPUE; however, blennies also<br />
probably have behavioral responses to low temperatures (Murdy et al. 1997). Responses such as reduced<br />
activity levels or moving to deeper, more thermally stable water, a pattern seen in many fish (Neill 1979),<br />
may coincidentally enhance gear avoidance. Higher CPUEs in 2001 than in 2000 may have resulted from<br />
increased proficiency and experience with collection techniques. For example, CPUE at South Padre<br />
Island increased dramatically in May 2001 due to the discovery of large numbers of blennies in the<br />
supralittoral fringe. Previous collections had not sampled this area because it was not expected that<br />
blennies would be out of the water.<br />
Salinity and turbidity did not seem to influence monthly blenny CPUE. Blenny CPUE during<br />
low beachfront salinities (15‰) at Galveston following Tropical Storm Alison in June 2001 was not lower<br />
compared to June 2000. Low turbidity was anticipated to enhance gear avoidance at Port Aransas and<br />
South Padre Island; however, no discernable effect was noted. CPUE on the middle and lower coast was<br />
consistently higher than in more turbid waters on the upper coast.<br />
Results of the present study appear to indicate that blenny assemblages on the Texas coast could<br />
be divided into three distinct groups based on regional species composition, species diversity, and<br />
evenness with these distinctions being driven primarily by temperature. However, expansion of this study<br />
to other jetty systems in Texas would enable a better assessment of the distinctiveness of blenny
50<br />
assemblages and their habitat requirements across the upper, middle and lower Texas coast and to what<br />
degree Galveston, Port Aransas, and South Padre Island are representative of these features. Expansion to<br />
cover a greater amount of potential blenny habitat would allow assessment of how effective stations used<br />
in the present study represent Texas’ jetty system as a whole.<br />
Size Structure<br />
Total length of <strong>Scartella</strong> <strong>cristata</strong> and Hypleurochilus geminatus was significantly higher on<br />
jetties on the upper and middle Texas coast than on those of the lower coast. Mean total length was<br />
highest at Port Aransas in the case of H. geminatus and at Galveston for S. <strong>cristata</strong>. There are several<br />
possible explanations for this pattern in S. <strong>cristata</strong>. The total n for the Galveston collections was an order<br />
of magnitude lower than that of the other two sites; therefore, any bias toward larger individuals would<br />
have a greater impact on the mean. It is also possible density-dependent effects, such as competition for<br />
food or shelter, might be operating at a reduced level, thus allowing S. <strong>cristata</strong> to reach a larger size at<br />
Galveston because the density was lower than that at the other two sites. The amount of shelter available<br />
to smaller individuals may be limiting and thereby favor larger individuals because the structural<br />
complexity of the habitat at Galveston was less than that at the other sites. Shelter availability and size<br />
was found to be a determining factor in the size structure of blenny populations in rocky littoral zones of<br />
the western Mediterranean (Patzner 1999), the rocky intertidal zone of California (Stephens et al. 1970),<br />
and on oyster reefs along the east coast of the United States (Swearer and Phillips and Swears 1979,<br />
Crabtree and Middaugh 1982). The precise role of rugosity on the composition and structure of blenny<br />
assemblages is not conclusive. The location with the lowest structural complexity, Galveston, exhibited<br />
the highest species diversity, evenness, and mean TL. There also is the possibility that large S. <strong>cristata</strong><br />
were present at Port Aransas and South Padre Island but were concentrated in deeper reaches of the jetty<br />
not sampled during this study.<br />
Stability of Blenny Assmblages<br />
How stable is the structure and composition of blenny assemblages on Texas jetties? The only<br />
other studies that documented blenny assemblages on jetties focused on newly constructed jetties in the<br />
Florida panhandle (Hastings 1979) and South Carolina (Van Dolah et al. 1984, 1987) Blenny assemblages
51<br />
on these jetties exhibited a fair degree of stability. Hypleurochilus geminatus was the first blenny to<br />
recruit to both locales and although other species (Hypsoblennius spp.) eventually arrived during these<br />
studies, H. geminatus never relinquished dominance (Hastings 1979, Van Dolah et al. 1984, 1987). While<br />
this study is consistent with the findings of Hastings (1979) and Van Dolah et al. (1984, 1987) indicating<br />
that blenny assemblages are relatively stable, long-term surveys of a larger percentage of Texas jetties<br />
with an ecosystem focus should be undertaken. Of particular importance would be establishing sampling<br />
stations across the entire reach and depth of the jetty habitat and incorporating complete faunal and floral<br />
surveys of these habitats. The blenny species on Texas jetties may be a series of metapopulations<br />
undergoing local extinctions and re-colonizations on a regular basis and acting as sources or sinks for each<br />
other (Pulliam 1988). The sampling design of this study left large expanses of the jetty uncharacterized<br />
(deep water, end of the jetty, intermediate stations) from which to resolve uncertainties regarding temporal<br />
and spatial variability. The present study made no attempt to characterize other biotic components of the<br />
jetty community. Future studies need to characterize changes in the fauna and flora of Texas jetties.<br />
Population dynamics of organisms such as epilithic algae and invertebrates upon which blennies depend<br />
for food and shelter or potential predators such as birds and larger fishes could impact the composition of<br />
blenny assemblages on Texas jetties. Kevern et al. (1985) reported an “explosive” colonization of<br />
sculpins on a newly constructed artificial reef in Lake Michigan that eventually declined due to shifts in<br />
the population structure of predators that fed on sculpins. Concurrent shifts in the size structure of local<br />
sculpin populations were also observed (Kevern et al. 1985). Little is known about predators and prey of<br />
blennies and thus changes in their populations may precipitate major shifts in blenny assemblage structure<br />
without apparent cause.<br />
Differences in CPUE, species composition, size structure, diversity, and evenness may be due to<br />
this study’s experimental design. Due to safety concerns, sampling frequently was not conducted evenly<br />
between stations at study sites on a monthly basis. The significant difference in CPUE and species<br />
composition between stations 2 and 3 at Port Aransas is also problematic, indicating potential differences<br />
between microhabitats and suggesting that sampling was not representative of the entire jetty. As<br />
previously mentioned, increasing the number of stations at a study site to include areas not covered in this
52<br />
study as well as increasing the number of study sites would alleviate many of these problems. It would<br />
also be desirable to establish paired stations (i.e. on the north and south jetty at each site) enabling better<br />
replication of sampling effort.<br />
Age and Growth of <strong>Scartella</strong> <strong>cristata</strong> on Texas Jetties<br />
Age and Growth<br />
<strong>Scartella</strong> <strong>cristata</strong> appears to be a fast growing, short-lived resident on Texas jetties. It was found<br />
to grow at 0.2 mm/day, live about 1.5 years, and spawn from January to June. While no previous work<br />
has been published on age and growth of S. <strong>cristata</strong>, Eyeberg (1984) found similar results in a South<br />
African congener, <strong>Scartella</strong> emarginata. The latter grows quickly, up to 0.26 mm/day under laboratory<br />
conditions, reaches sexual maturity at 36 mm total length, rarely lives past 2 years, and spawns year round<br />
(Eyeberg 1984). This pattern is seen in small, short-lived reef fishes such as gobies (Kritzer 2002);<br />
however, whether it holds true for all subtropical/tropical blenniids or only for the Genus <strong>Scartella</strong> is<br />
unclear. Nonetheless, temperate blennies exhibit a life history pattern almost completely opposite that of<br />
<strong>Scartella</strong>. Hypsoblennius species along the California coast are long-lived (7+ years) and grow quickly<br />
(0.12 mm/day) for their first year prior to slowing (0.03 mm/day) considerably (Stephens et al. 1970).<br />
Blennius gattorugine and Blennius pholis live up to 9 years in Ireland, grow quickly (no rate reported) for<br />
the first 2 years, then slow considerably (Dunne and Byrne 1979). These temperate species also spawned<br />
within discrete seasons, usually spring through early summer (Stephens et al. 1970, Dunne and Byrne<br />
1979). Estuarine species of blennies also appear to exhibit a different life history pattern. Hypsoblennius<br />
hentz was found to grow at over double the rate (0.5 mm/day) of <strong>Scartella</strong> in estuaries of the mid-Atlantic<br />
Bight (Able and Fahay 1998). This may be due to estuarine species of Hypsoblennius being longer-lived<br />
and slower to mature (Clarke 1979) than <strong>Scartella</strong>, thus allowing them to dedicate more energy toward<br />
somatic growth.<br />
Growth rates of <strong>Scartella</strong> <strong>cristata</strong> appear consistent with those of S. emarginata, the only<br />
published value for <strong>Scartella</strong>; however, estimated size-at-hatching is somewhat problematic because at<br />
10.42 mm it greatly exceeds published accounts of hatch sizes for Blenniidae; Chasmodes<br />
bosquianus=3.56-3.78 mm (Fritzsche 1978), Hypsoblennius hentz=2.6-2.8 (Fritzsche 1978),
53<br />
Hypsoblennius ionthas=2.82 mm (Clarke 1979), Ophioblennius atlanticus=1.3-1.5 mm (Labell and<br />
Nursall 1985), <strong>Scartella</strong> emarginata=3.5 mm (Eyeberg 1984). However, published estimates of size-athatching<br />
were all acquired by direct observation while current estimates for S. <strong>cristata</strong> were inferred from<br />
the regression model. This difference illustrates one limitation in using size-at-age relationships to<br />
estimate hatch size. In addition, y-intercept estimates in this study are misleading due to the lack of small<br />
specimens examined.<br />
Patterns of Dominance<br />
Four blenniid species—Hypleurochilus geminatus, Hypsoblennius hentz, Hypsoblennius ionthas,<br />
and <strong>Scartella</strong> <strong>cristata</strong>—potentially recruit to Texas jetties but their coexistence at any given time is rare.<br />
Post-recruitment resource partitioning on both large and small temporal and spatial scales allows blenniid<br />
to coexist and leads to assemblage stability (Stephens et al. 1970, Clarke 1989). Differences in<br />
interspecific dietary preferences (Eyberg 1984, O’Farrel and Fives 1990), dietary preferences between<br />
sexes or age classes within a species (Clarke 1979, Osenberg et al. 1992, Goncalves and Almada 1997),<br />
metabolic rates (Clarke 1992), or feeding morphology (Lindquist and Dillman 1986) may be significant<br />
factors isolating species into niches and thereby determining the composition of blenny assemblages.<br />
Shelter availability (Stephens et al. 1970, Phillips and Swears 1979, Crabtree and Middaugh 1982),<br />
territoriality (Stephens et al. 1970, Goncalves and Almada 1998, Wilson 2000), water temperature<br />
preferences (Zander et al. 1999), and recruitment patterns are other influences on assemblage structure.<br />
These interspecific and intraspecific interactions plus those between individuals and their habitats are key<br />
to predicting changes in population structure (Jones 1991). Because these blenniid species share similar<br />
habitat requirements and differ only slightly in dietary requirements (Lindquist and Dillaman 1986), it is<br />
much more common for assemblages to be dominated by one or two species.<br />
<strong>Scartella</strong> <strong>cristata</strong> is the dominant blenniid species on the Texas jetties sampled during this study<br />
regardless of local conditions. This is contrary to previous accounts by Hoese and Moore (1998) who<br />
assigned dominant status to Hypleurochilus geminatus. These previous accounts may have been based<br />
upon incomplete or inaccurate data, as there is little published literature describing ichthyofauna of Texas<br />
jetties. However, it is possible blenny assemblages have undergone major shifts in species composition as
54<br />
the biotic community continues to evolve on Texas jetties. Other studies on Florida and South Carolina<br />
jetties have noted dominance of H. geminatus (Hastings 1979, Van Dolah 1984, 1987), but may not have<br />
been sufficient in duration to observe the colonization of S. <strong>cristata</strong>. The latter species appears to be<br />
tolerant of the entire spectrum of environmental conditions (temperature, salinity, turbidity, and habitat<br />
complexity) along the Texas coast. A lack of more detailed information on the biology of other<br />
constituent species for comparison, particularly H. geminatus, makes it difficult to explain why S. <strong>cristata</strong><br />
is so successful on Texas jetties.<br />
<strong>Scartella</strong> <strong>cristata</strong>’s total dominance of other blenniids through competitive exclusion may be<br />
possible only under the environmental conditions and habitat quality of the central and lower Texas coast.<br />
Woodland (1999) found this type of exclusion and dominance based on differences in local condition<br />
demonstrated by the Family Signidae, a family of herbivorous reef fishes in the western Pacific.<br />
Conversely, the more temperate species such as Hypleurochilus geminatus may not compete as well as<br />
<strong>Scartella</strong> <strong>cristata</strong> in the more subtropical waters of the central and lower Texas coast. Clarke (1989, 1992)<br />
found that the higher metabolic rate of Acanthemblemaria spinosa, a tube dwelling chaenopsid blenny,<br />
allowed it to displace a congener, Acanthemblemaria aspera, from preferred, higher quality habitat and<br />
facilitating a higher growth rate in A. spinosa. A more tropical species, such as S. <strong>cristata</strong>, may have a<br />
higher metabolic rate giving it an advantage in agonistic interactions as seen in A. spinosa (Clarke 1992).<br />
Differential growth rates between species may be an important underlying explanation for why<br />
certain species dominate (Jones 1991) or a result of competive interactions between species (Clarke 1992).<br />
With growth, fishes typically decrease their vulnerability to predation, increase their fecundity, and, in<br />
territorial species such as blennies, increase the size of territory they can or need to defend (Stephens et al.<br />
1970, Phillips and Swears 1979, Jones 1991, Goncalves and Almada 1998). A blenniid species reaching a<br />
large size quicker than a competing species has the edge in not only holding more territory, but also<br />
producing more offspring. Consequently, a faster growing species has the potential to exclude a slower<br />
growing species from a given area over time. Further work with additional blenniid species, particularly<br />
Hypleurochilus geminatus, will determine if this is the case on Texas jetties.<br />
The Genetic Structure of <strong>Scartella</strong> <strong>cristata</strong> on Texas Jetties
55<br />
<strong>Scartella</strong> <strong>cristata</strong> is a wide-ranging species occurring on nearshore reefs and rocky shores<br />
throughout the tropical Atlantic, Caribbean, Gulf of Mexico, and Mediterranean. The Texas Gulf coast<br />
likely represented a gap in the distribution of this species due to a lack of suitable habitat. With initiation<br />
of jetty construction in Texas during the 1880’s, S. <strong>cristata</strong> larvae that historically would pass the Texas<br />
coast found new habitat to colonize in state waters. The genetic structure of local populations on Texas<br />
jetties reflects the history of this colonization. Haplotype diversity (h) of S. <strong>cristata</strong> across Florida,<br />
Galveston, Port Aransas, and South Padre Island was high; however, nucleotide diversity (π) was low to<br />
moderate. While these results indicate a large number of different haplotypes exist in the S. <strong>cristata</strong><br />
population, low nucleotide diversity suggests they are closely related and effective population size is<br />
relatively small. This relationship between h and π is consistent with findings by Muss et al. (2001) for<br />
another wide ranging blenniid, Ophioblennius atlanticus, and appears to be a common theme among many<br />
marine fishes (Palumbi 1994, Grant and Bowen 1998).<br />
Both haplotype and nucleotide diversity were greater for conspecifics from the middle and lower<br />
Texas coast than that for their upper coast and Florida cohorts. This suggests that the source population of<br />
<strong>Scartella</strong> <strong>cristata</strong> for Port Aransas and South Padre Island is more diverse and possibly older or larger than<br />
that for Galveston and Florida. Whether or not Florida is the source population for Galveston cannot be<br />
answered definitively based on the limited number of sample sites and small number of individuals from<br />
the former. It is clear that if Florida is not the source population for Galveston then the two share the same<br />
origins. Similarities in haplotype distribution and among group component of variation (Φ ST ), low genetic<br />
distances between sites (0.005), and high level of gene flow per generation link the two sites despite the<br />
large geographic distance (689 km) and the Mississippi River plume that separates them. This linkage is<br />
accomplished through predominant nearshore currents in the Gulf, which would tend to carry larvae from<br />
east to west throughout the year (Fig. 26).<br />
Transport of <strong>Scartella</strong> <strong>cristata</strong> larvae to Texas jetties from either Mexico or Florida is plausible.<br />
Although not known for S. <strong>cristata</strong>, the larval duration of Hypsoblennius ionthas lasts from 6 to 8 weeks<br />
(Clarke 1979). Longshore currents along the Texas coast range in velocity from 12 (Fox and Davis 1976)<br />
to 21.5 cm/s (Smith 1975) under typical conditions, while larvae entrained in a boundary current such as
56<br />
a<br />
b<br />
c<br />
d<br />
Fig. 26. Direction of current flow in the Gulf of Mexico (a,c) and on the Texas -<br />
Louisiana shelf (b, d) during non summer (a, b) and summer months (c, d). Black<br />
and white tria ngles represent northerly and southerly flow, respec tively, in b a nd d.<br />
Black circles repres ent sample sites. Gulf of Mexico c urrents adapted from Britton<br />
and Morton (1989) and Texas-Louisia na shelf currents from Cho et al. (1998).<br />
the Mexican Current can be carried at 70-100 cm/s (Sturges and Blaha 1976). These features put Texas<br />
jetties within reach of larvae traveling from the eastern or southern Gulf or Mexico even if larval duration<br />
is only 30 days. A small amount of one-way gene flow (N m
57<br />
source for Port Aransas and South Padre Island (Fig. 26) due to the northerly current flow during summer<br />
on the Texas-Louisiana shelf (Cochrane and Kelly 1986, Britton and Morton 1989, Cho et al. 1999). The<br />
middle and lower coast have similar haplotype distribution, no difference in the among group component<br />
of variation (Φ ST ), and exchange a large number of migrants per generation (N m =55.6). These similarities<br />
suggest they share the same source population(s); however, the two sites are separated by a genetic<br />
distance (0.011) comparable to that of most other sites (Table 6). Since mismatch distributions indicate<br />
Port Aransas and South Padre Island samples were large enough to encompass the variability at each<br />
locality, it seems these sites may be in the process of evolving distinct subpopulations. Overall, this study<br />
indicates that S. <strong>cristata</strong> on Texas jetties are not yet isolated from their possible sources but are extensions<br />
of them. This is contrary to work on red drum (Sciaenops ocellatus) and red snapper (Lutjanus<br />
campechanus) that indicates a single population of each species within the Gulf (Gold et al. 1999, Heist<br />
and Gold 2000, Gold et al. 2001). Comparisons of these species with <strong>Scartella</strong> <strong>cristata</strong> should be made<br />
cautiously as both red drum and red snapper have greater potential for mixing/migrating and a greater<br />
abundance of suitable habitat throughout the Gulf.<br />
Even though larval blennies have high dispersal potential (Hunte and Côté 1989, Riginos 2000,<br />
Riginos and Nachman 2001), spatial and temporal heterogeneity of coastal habitats and nearshore Gulf<br />
waters may act to partially isolate <strong>Scartella</strong> <strong>cristata</strong> on Texas jetties both from each other and their source<br />
populations. Palumbi (1994) predicts that larvae of marine organisms probably do not “see” the marine<br />
environment as a homogenous habitat. The traditional interpretation is that this results in development of<br />
genetically structured populations in areas that do not appear isolated from one another (Palumbi 1994,<br />
Debenham et al. 2000). This does not explain low levels of genetic variation found in Ophioblennius<br />
populations throughout the Atlantic basin (Muss et al. 2001) or in intertidal sculpins on the Pacific coast of<br />
North America (Yoshiyama and Sassaman 1993). Both of these groups inhabit areas exhibiting spatial<br />
and temporal heterogeneity. Studies examining population genetics of Ophioblennius atlanticus have<br />
found that a gap in a species’ range due to lack of habitat is not sufficient to form distinct populations;<br />
whereas, a similar gap with a barrier such as a large river is (Muss et al. 2001). A similar phenomenon<br />
was observed in the blenny, Axoclinus nigricaudus, which exhibits distinct populations separated by less
58<br />
than 200-km of unsuitable habitat in the Gulf of California (Riginos and Nachman 2001). The Texas coast<br />
prior to jetty construction represented such a gap between S. <strong>cristata</strong> populations in the eastern Gulf of<br />
Mexico and the southern Gulf/western Caribbean. This gap was a result of the mud and sand shores of<br />
Louisiana, Texas, and northeastern Mexico and the Mississippi River plume. Establishment of suitable<br />
habitat in the form of jetties and groins along the Texas coast seems to have removed any barriers to the<br />
exchange of individuals between the eastern and western Gulf and raises questions regarding the role of<br />
the Mississippi River in separating populations.<br />
The Mississippi River plume may never have been a barrier to blenniid larval dispersal. Govoni<br />
(1993) found that larval fishes were able to cross frontal boundaries such as the Mississippi River plume; a<br />
finding supported by high levels of gene flow observed in this study between Florida and Galveston.<br />
Larvae of many reef fish species, including blenniids, typically have a much broader geographical range<br />
than do their adult counterparts (Leis 1991), which suggests the availability of suitable adult habitat plays<br />
a major role in the genetic structure of these species. This appears to have been the case in <strong>Scartella</strong><br />
<strong>cristata</strong>. At least two distinct populations of S. <strong>cristata</strong> exist in the Gulf that were kept separate more by<br />
the lack of suitable habitat in the northwestern Gulf and prevailing currents than by the Mississippi River<br />
plume. Distribution of larvae from these populations may have overlapped along the Texas coast, but a<br />
lack of suitable habitat prevented their interbreeding. It is unclear what impact jetty construction on the<br />
Texas coast will have on the genetic structure of S. <strong>cristata</strong>. Jetties have facilitated these populations<br />
mixing to a degree but current patterns appear to be an isolating mechanism by preventing homogenization<br />
as evidenced by the distinction between Galveston and Port Aransas-South Padre Island. Further testing<br />
of this hypothesis should be undertaken by examining recruits from multiple spawning events throughout<br />
the year. As indicated through hatch-date analysis, S. <strong>cristata</strong> has the potential to spawn throughout the<br />
year; however, the individuals selected for this analysis were all within the winter 1999-2000 cohort. This<br />
means sites such as Port Aransas have the potential to undergo shifts in genetic composition with seasonal<br />
changes in current patterns. The mismatch distributions tend to suggest otherwise, but these data may be<br />
representative of the larger source populations and not reflect the full diversity that potentially occur in<br />
local populations.
59<br />
The subpopulations <strong>Scartella</strong> <strong>cristata</strong> on Texas jetties also need to be examined as<br />
metapopulations. Blenny assemblages on Texas jetties could be sinks for their respective source<br />
populations as described in terrestrial systems by Pulliam (1988) or they may interact together as their own<br />
metapopulation in which an upstream jetty acts a source for a downstream sink and so on along the coast.<br />
The data suggest this is not the case. Mismatch distributions indicate that S. <strong>cristata</strong> populations in the<br />
Gulf have been stable for some time. This is opposite the pattern expected in populations structured as<br />
metapopulations. The same holds true if S. <strong>cristata</strong> was recruiting to jetties from estuarine oyster reefs.<br />
Even though it is known to occur on oyster reefs (Britton and Morton 1989, Hoese and Moore 1998), S.<br />
<strong>cristata</strong> does not appear to be a dominant species in estuarine habitats (personal observation). Jetty<br />
populations established from estuarine sources would be expected to exhibit a mismatch distribution<br />
indicating exponential population growth. Data on possible interactions between jetty subpopulations and<br />
their source population(s) are critical to understanding the population dynamics of blenny assemblages on<br />
Texas jetties.<br />
The genetic structure of <strong>Scartella</strong> <strong>cristata</strong> also has the potential to reveal historical patterns of<br />
distribution of nearshore fishes in the Gulf of Mexico. There is a great deal of significance to the large<br />
number of haplotypes present at Port Aransas and South Padre Island relative to that at Galveston and<br />
Florida, as it is probably a result of the impact of Pleistocene glaciations. Prior to the last glaciation,<br />
Florida was flooded allowing the movement of fishes out of the Gulf to the Atlantic coast (Briggs 1974),<br />
but potentially reducing the amount of rocky shore habitat on the Florida peninsula. The Wisconsin<br />
glacial period dropped sea level and temperature and probably forced the range of S. <strong>cristata</strong> south. The<br />
rise in temperature and sea level associated with the end of the Wisconsin glaciation enabled S. <strong>cristata</strong> to<br />
re-colonize this habitat, thus creating a founder effect (Strickberger 1996) that reduced genetic diversity of<br />
individuals living in the eastern Gulf and subsequently the upper Texas coast. S. <strong>cristata</strong> populations<br />
along the Mexican coast and throughout the Caribbean probably did not experience a dramatic impact<br />
from glaciation, and were able to maintain higher genetic diversity. While this scenario is supported by<br />
differences in haplotype diversity between locations, the disparity between the mismatch and Poisson<br />
distribution suggests that S. <strong>cristata</strong>’s effective population sizes have been stable for an extended period of
60<br />
time. A similar pattern has been observed in demographically distinct local populations of the parrotfish<br />
Chlorurus sordidus from widespread locations on Australia’s Great Barrier Reef (Dudgeon et al. 2000).<br />
Analysis of blennies from a larger number of sample sites will be needed to fully explore the plausibility<br />
of this scenario.<br />
Biogeography of Blennies on Texas Jetties<br />
A transition in the species composition of blenny assemblages appears to occur on the middle<br />
Texas coast. This area may represent a biogeographic break for several blenny species due to current<br />
patterns and environmental tolerances of these taxa. The Texas coast receives a convergence of northward<br />
and southward flowing longshore currents (Fig. 25). The exact location of this convergence varies by<br />
season; it is located near Matagorda Bay in summer and near the mouth of the Rio Grande throughout the<br />
rest of the year (Cochrane and Kelly 1986, Britton and Morton 1989, Cho et al. 1998). The Texas coast<br />
also provides transition between subtropical and temperate climatic regimes (Britton and Morton 1989).<br />
Two species, Labrisomus nuchipinnis and Hypleurochilus geminatus, appear to reach the limits of their<br />
distribution on the Texas coast near Port Aransas. Failure to encounter L. nuchipinnis north of Port<br />
Aransas conforms to previous descriptions (Springer 1958, Hoese and Moore 1998) of this tropicalsubtropical<br />
species’ range. H. geminatus, a more temperate species (Hoese and Moore 1998), was rarely<br />
encountered south of Port Aransas. These distributional patterns may be indicative of these species’<br />
environmental tolerances and/or probable sources of initial recruits to Texas jetties. Even though L.<br />
nuchipinnis occur on hard shores of the eastern Gulf, they are more typically associated with warmer<br />
waters of the Caribbean and southern Atlantic (Hoese and Moore 1998). Their observed distribution on<br />
Texas jetties suggests that the original source population(s) is located in the southern Gulf or Caribbean.<br />
Whether environmental conditions are favorable to this species’ colonization north of Port Aransas may be<br />
irrelevant if prevailing current patterns prevent transport of their larvae. H. geminatus is common along<br />
the southeastern U.S. coast (Lindquist and Chandler 1978, Hoese and Moore 1998) and is a frequent<br />
inhabitant of Florida jetties (Hastings 1979). Based upon its distribution on Texas jetties, the most<br />
probable source population for H. geminatus would be from the eastern Gulf of Mexico. If H. geminatus<br />
recruits to Texas jetties originated in the southern Gulf or Caribbean then South Padre Island should host a
61<br />
more robust population. The catch of small individuals at South Padre only during the late spring and<br />
early summer suggests these individuals were transported from the eastern Gulf before current flow shifted<br />
for the summer.<br />
The distribution pattern observed for two Hypsoblennius species found on Texas jetties does not<br />
appear to be impacted by a biogeographical break. Hypsoblennius hentz and H. ionthas are commonly<br />
found on estuarine oyster reefs (Hubbs 1939, Clarke 1979, Smith-Vaniz 1980, Hoese and Moore 1998)<br />
and usually are not common on Texas jetties except for newly settled individuals in the late spring/early<br />
summer. This distributional pattern leads to the conclusion these species probably colonized jetties from<br />
bays. It is difficult to explain why H. ionthas was virtually absent from Galveston collections in 2001<br />
after being relatively common during spring and early summer 2000. It is possible that some<br />
environmental condition favored a large-scale export of larvae from the bay to groins on the beachfront.<br />
Few, if any, of these individuals were able to reach maturity in the Gulf as evidenced by there being no<br />
individuals >40 mm TL. Conditions that favored larval transport in 2000 may not have occurred in 2001.<br />
It also is possible that the scenario represented by 2000 is typical for H. ionthas on the upper coast and<br />
2001 represents an aberration. Additional surveys of both beachfront groins and estuarine oyster reefs<br />
would clarify the status of Hypsoblennius species on Texas jetties.<br />
<strong>Scartella</strong> <strong>cristata</strong> may play a unique role in determining the composition of blenny assemblages<br />
on Texas jetties. Even though S. <strong>cristata</strong> was found at each study site, there was a difference in the<br />
abundance and dominance corresponding to the biogeographical break described above. S. <strong>cristata</strong> on the<br />
Texas coast originated from at least two different source populations, the eastern Gulf and another source<br />
likely the southern Gulf and/or western Caribbean. There also appears to be differential recruitment from<br />
these sources. The lower and middle coast receives a large influx of recruits during the summer and lesser<br />
numbers throughout the year at South Padre Island (Appendix A). Recruitment pulses in Galveston do not<br />
seem to be as strong (Appendix A). This could be the underlying reason for lower densities seen on the<br />
upper coast. The difference in population density of S. <strong>cristata</strong> may impact the other blenniid populations<br />
through both direct and indirect competitive interactions. More information describing the nature of
62<br />
interactions between constituent species of blenny assemblages on Texas jetties is needed to evaluate this<br />
hypothesis.<br />
Blennies and Fisheries Management<br />
No only do blennies serve as excellent models for testing theories of ecology, biogeography, and<br />
population genetics but they may also be useful to fisheries biologists. Pressures placed on fisheries<br />
resources by human populations have increased dramatically during the past century, resulting in the<br />
eventual collapse of various “inexhaustible” stocks. Resource managers around the world are scrambling<br />
to maintain sustainable fisheries and still meet the needs of burgeoning populations that utilize them. The<br />
tragedy of the commons as described by Hardin (1969), in which individuals or nations use a common<br />
resource to its exhaustion for their own gain because the costs are shared by all, is a specter that has not<br />
been eliminated at the dawn of the 21 st Century. It has become more prevalent then ever as more<br />
participants compete for dwindling fishery resources. The biggest challenge facing resource managers and<br />
society over the next 100 years will be balancing needs of human populations and those of not only fishes,<br />
but also the marine environment as a whole.<br />
Artificial reefs are one of many management tools used along the Texas coast to conserve fish<br />
stocks under pressure from the competing interests of commercial and recreational fishermen. Humans<br />
have used artificial reefs for hundreds of years to increase their catch (Mottet 1985, Stone 1985). The<br />
ability of some organisms to recruit to and establish populations on artificial substrates has been well<br />
documented. Passage of the Artificial Reef Act by the Texas State Legislature in 1989 required the Texas<br />
Parks and Wildlife Department (TPWD) to deploy, monitor, and manage artificial reefs in state waters<br />
(Stephan et al. 1990). Although TPWD’s artificial reef plan recognizes jetties, groins, and other similar<br />
structures as artificial reef habitat (Stephan et al. 1990), the plan’s primary reliance on decommissioned<br />
petroleum production platforms as artificial reefs has negated the development of monitoring or<br />
management programs for other substrates including jetties. This may change in light of recent findings<br />
that rock jetties serve as a nursery habitat for structurally dependent, economically important fishes such<br />
as lutjanids and sparids in the absence of other suitable substrate (Hernandez et al. 2001).
63<br />
The last comprehensive survey in the northwest Gulf of finfish landings from jetties, groins, and<br />
piers was conducted in 1973. It indicated that 288,000 recreational anglers from the Mississippi River<br />
delta to Brownsville captured 15 million kg of fish in 1970 from jetties, piers, and bridges on both the Gulf<br />
and the bays (Deuel 1973). For the small amount of area represented by jetties on the shores of the<br />
northwest Gulf, this seems to be a disproportionately large number of anglers. It appears that jetties not<br />
only attract and concentrate fishes but anglers as well. TPWD surveys indicate that spotted seatrout,<br />
Cynoscion nebulosus; red drum, Sciaenops ocellatus; black drum, Pogonias cromis; southern flounder,<br />
Paralichthys lethostigma; sheepshead, Archosargus probatocephalus; Atlantic croaker, Micropogonias<br />
undulatus; sand seatrout, Cynoscion arenarius; and gafftopsail catfish, Bagre marinus, constitute the<br />
majority of fishes caught off Gulf jetties and piers (McEachron 1980). Though these fishes are not taken<br />
in sufficient numbers off jetties and piers to significantly impact their populations (McEachron 1980), no<br />
recent studies examine the role jetties play in enhancing shore-based fisheries for these species.<br />
The evaluation of jetties or any other artificial reef’s enhancement of fish populations is a<br />
significant issue in its use as a fisheries management tool. Although there is little consensus whether<br />
artificial reefs enhance fisheries or merely concentrate existing fishes, recent research suggests that<br />
location plays a major role in how the reef impacts fish populations. Deployment of artificial reefs<br />
adjacent to abundant, natural rocky substrate attracts fishes from natural habitats; whereas, those placed in<br />
areas without natural structure, such as the Texas coast, probably enhances fisheries (Grossman et al.<br />
1997, Bortone 1998, Shipp 1999). One key in addressing the aggregation-enhancement issue and<br />
evaluating performance of artificial reefs will be to determine how closely they function ecologically in<br />
comparison to natural counterparts. This necessitates that resource managers change their focus, as the<br />
community structure of non-game fishes likely provides a better assessment of the functional equivalency<br />
of artificial habitats than does that of game fishes (Topolski and Szedlmayer 2000). Blennies have<br />
potential to be excellent indicators to measure the functional equivalency of artificial habitats, such as<br />
jetties and petroleum production platforms, to their natural counterparts (Topolski and Szedlmayer 2000)<br />
due to their sedentary nature, relative ease of capture, great abundance, and hardiness. In many regards,<br />
blennies are the ideal measure for functional equivalency in these habitats because they are sensitive to
64<br />
changes in the composition of the fouling community (Topolski and Szedlmayer 2000). The structure of<br />
blenny assemblages also may indicate the development an artificial habitat functionally equivalent to a<br />
natural one (Topolski and Szedlmayer 2000).<br />
Blennies also may serve as important indicators of environmental quality due to their habit of<br />
establishing populations in close proximity to human impacts on the marine environment. Viviparous<br />
blennies, Zoarces viviparous, have been found to be useful indicators of petroleum contamination from oil<br />
platforms (Celander et al. 1994) and industrial chemical effluents (Vetemaa et al. 1997) in the North Sea.<br />
Blennies may be useful environmental indicators of jetty habitats on the Texas coast as well as oil<br />
platforms. Over 13,000 commercial vessels and an even larger number of smaller recreational and fishing<br />
boats annually pass through channels protected by jetties at the three sites utilized in the study (Port of<br />
Houston Authority 2001, Port of Corpus Christi Authority 2001). More than 1,000 of these commercial<br />
vessels were tankers carrying 75.5 million tons of petroleum and 1.94 million tons of assorted chemicals<br />
through Aransas Pass alone (Port of Corpus Christi Authority 2001). Blennies on jetties may be useful as<br />
models to study the chronic effects of long-term sub-lethal exposures to petroleum and other chemicals.<br />
The data presented in this study should serve as the foundation for continued examination of the utility of<br />
blennies to fisheries biologists and resource managers.<br />
Conclusions<br />
The major findings of the present study are as follows:<br />
• Four species of blenniids and one labrisomid species reside on Texas jetties. These<br />
species formed geographically distinct assemblages at the three study sites but<br />
further work is needed to determine if these sites are representative of the Texas<br />
coast.<br />
• The blenny assemblages at each site appeared to be relatively stable in species<br />
composition over time. Observed fluctuations in CPUE were driven primarily by<br />
temperature and may be an artifact of sampling bias.<br />
• <strong>Scartella</strong> <strong>cristata</strong> is the dominant blenny on Texas jetties. It is a short-lived species<br />
that spawns throughout most of the year. Further research questions should focus
65<br />
on why this species is so abundant on Texas jetties by addressing information voids<br />
on growth rates of other blenny species; physiological tolerances and requirements;<br />
and interactions between S. <strong>cristata</strong> and other constituent species.<br />
• Texas jetties represent a convergence of at least two genetically distinct populations<br />
of <strong>Scartella</strong> <strong>cristata</strong>. The local population of S. <strong>cristata</strong> at Galveston had close ties<br />
with Florida indicating its origins lie in the eastern Gulf. Port Aransas and South<br />
Padre Island do not share this affinity with Florida. These local populations were<br />
closely related to each other suggesting a source population in the southern Gulf or<br />
Caribbean. Future work should include samples from a wider geographical range<br />
and incorporate investigations into cohort effects on the genetic structure of local<br />
populations.
66<br />
LITERATURE CITED<br />
Able KW, Fahay MP (1998) The first year in the life of estuarine fishes in the middle Atlantic Bight<br />
Rutgers University Press, New Brunswick, NJ.<br />
Alperin L.M (1977) Custodians of the coast: history of the United States Army Engineers at Galveston.<br />
Galveston District United States Army Corps of Engineers. Galveston, Texas.<br />
Bohnsack JA, Johnson DL, Ambrose RF (1991) Ecology of artificial reef habitats and fishes. In: Seaman<br />
W, Sprague LM (eds) Artificial habitats for marine and freshwater fisheries. Academic Press<br />
Inc., San Diego, CA, p. 61-107.<br />
Bond CE (1996) Biology of fishes, 2 nd Ed. Saunders College Publishing, Fort Worth, Texas.<br />
Bortone SA (1998) Artificial reef management perspective-resolving the attraction-production dilemma in<br />
artificial reef research: some yeas and nays. Fisheries 22: 6-10.<br />
Bright TJ (1977) Coral reefs, nephloid layers, gas seeps, and brine flows on hard banks in the<br />
northwestern Gulf of Mexico. Proceedings of the 3 rd International Coral Reef Symposium,<br />
Miami, FL, p. 39-46.<br />
Bright TJ, Cashman CW (1974) Fishes. In: Bright TJ, Pequegnat LH (eds) Biota of the West Flower<br />
Garden Bank. Gulf Publishing Company, Houston, TX, p. 340-409.<br />
Britton JC, Morton B (1989) Shore ecology of the Gulf of Mexico. University of Texas Press,<br />
Austin, Texas.<br />
Celander M, Naef C, Broman D, Foerlin L (1994) Temporal aspects of induction of hepatic cytochrome<br />
P450 1A and conjugating enzymes in the viviparous blenny (Zoarces viviparous) treated with<br />
petroleum hydrocarbons. Aquatic Toxicology 29: 183-196.<br />
Cho K, Reid RO, Nowlin WD (1998) Objectively mapped stream function fields on the Texas-<br />
Louisiana shelf based on 32 months of moored current meter data. Journal of Geophysical<br />
Research 103: 10377-10390.<br />
Clarke DG (1979) Affects of resource utilization in the freckled blenny, Hypsoblennius ionthas, on<br />
oyster reef substrate. Ph. D. dissertation, University of Alabama, Birmingham, AL.<br />
Clarke RD (1989) Population fluctuation, competition, and microhabitat distribution of two species of<br />
tube blennies, Acanthemblemaria (Teleostei: Chaenopsidae). Bulletin of Marine Science 443:<br />
1174-1185.<br />
Clarke RD (1992) Effects of microhabitat and metabolic rate on food intake, growth, and fecundity of<br />
two competing coral reef fishes. Coral Reefs 11: 199-205.<br />
Clement M, Posada D, Crandall, KA (2000) TCS: a computer program to estimate gene genealogies.<br />
Molecular Ecology 9: 1657-1660.<br />
Cochran JD, Kelly FJ (1986) Low-frequency circulation on the Texas-Louisiana continental shelf.<br />
Journal of Geophysical Research 91: 10645-10659.
67<br />
Crabtree RE, Middaugh DP (1982) Oyster shell size and the selection of spawning sites by Chasmodes<br />
bosquianus, Hypleurochilus geminatus, Hypsoblennius ionthas (Pisces, Blenniidae) and<br />
Gobiosoma bosci (Pisces, Gobiidae) in two South Carolina Estuaries. Estuaries 5: 150-155.<br />
Davis JLD (2000) Changes in a tidepool fish assemblage on two scales of environmental variation:<br />
seasonal and El Nino Southern Oscillation. Limnology and Oceanography 45: 1368-1379.<br />
Debenham P, Brzezinski M, Foltz K, Gaines S (2000) Genetic structure of populations of the red sea<br />
urchin, Strongylocentrotus franciscanus. Journal of Experimental Marine Biology and Ecology<br />
253: 49-62.<br />
Dennis GD, Bright TJ (1988) Reef fish assemblages on hard banks in the northwestern Gulf of Mexico.<br />
Bulletin of Marine Science 43: 280-307.<br />
Deuel DG (1973) The 1970 salt-water angling survey. U.S. Department of Commerce, NOAA, NMFS,<br />
Current Fisheries Statistics No. 6200.<br />
Dudgeon CL, Gust N, Blair D (2000) No apparent genetic basis to demographic differences in scarid<br />
fishes across the continental shelf of the Great Barrier Reef. Marine Biology 137: 1059-1066.<br />
Excoffier L, Smouse P, Quattro J (1992) Analysis of molecular variance inferred from metric distances<br />
among DNA haplotypes: application to human mitochondrial DNA restriction data. Genetics<br />
131: 479-491.<br />
Eyberg I (1984) The biology of Parablennius cornutus (L.) and <strong>Scartella</strong> emarginata (Günter) (Teleostei:<br />
Blenniidae) on a Natal Reef. Investigational Report of the Oceanographic Research Institute 54:<br />
1-16.<br />
Faria C, Almada V (1999) Variation and resilience of rocky intertidal fish in western Portugal. Marine<br />
Ecology Progress Series 184: 197-203.<br />
Faria C, Almada V (2001) Microhabitat segregation in three rocky intertidal fish species in Portugal: does<br />
it reflect interspecific competition? Journal of Fish Biology 58: 145-159.<br />
Fox WT, Davis RA, Jr. (1976) Weather patterns and coastal processes. In: Davis RA, Ethington RL (eds)<br />
Beach and Nearshore Sedimentation. Society of Economics, Paleontologists, and Mineralogists<br />
Special Publication 24: 1-23.<br />
Fritzsche RA (1978) Development of fishes of the mid-Atlantic Bight: an atlas of egg, larval, and<br />
juvenile stages vol. V Chaetodontidae through Ophidiidae. Center for Environmental and<br />
Estuarine Studies of the University of Maryland Contribution no 787.<br />
Gibson RN (1999) Methods for studying intertidal fishes. In: Horn MH, Martin KLM, Chotkowski MA<br />
(eds) Intertidal fishes: life in two worlds. Academic Press, San Diego, CA, p. 7-25.<br />
Gold JR, Pak E, Richardson L (2001) Microsatellite variation among red snapper (Lutjanus campechanus)<br />
from the Gulf of Mexico. Marine Biotechnology 3: 293-304.<br />
Gold JR, Richardson LR, Turner TF (1999) Temporal stability and spatial divergence of mitochondrial<br />
DNA haplotype frequencies in red drum (Sciaenops ocellatus) from coastal regions of the<br />
western Atlantic Ocean and Gulf of Mexico. Marine Biology 133: 593-602.
68<br />
Goncalves EJ, Almada VC (1997) Sex differences in resource utilization by the peacock blenny.<br />
Journal of Fish Biology 51: 624-633.<br />
Goncalves EJ, Almada VC (1998) A comparative study of territoriality in intertidal and subtidal<br />
blennioids (Teleostei, Blennioidei). Environmental Biology of Fishes 51: 57-264.<br />
Govoni JJ (1993) Flux of larval fishes across frontal boundaries-examples from the Mississippi River<br />
plume front and the western Gulf Stream front in winter. Bulletin of Marine Science 53: 538-<br />
566.<br />
Grant WS, Bowen BW (1998) Shallow population histories in deep evolutionary lineages of marine fishes:<br />
insights from sardines and anchovies and lessons for conservation. Journal of Heredity 89: 415-<br />
426.<br />
Graves JE (1995) Conservation genetics of fishes in the pelagic marine realm. In: Avise JC, Hamrick JL<br />
(eds) Conservation genetics: case histories from nature. Chapman and Hall, New York, NY, p.<br />
335-366.<br />
Greig TW (2000) Partitioning genetic variation in swordfish (Xiphias gladius L.); analysis of sample<br />
variance and population structure. Ph.D. dissertation. University of South Carolina, Columbia,<br />
SC.<br />
Grossman GD, Jones GP, Seaman W (1997) Do artificial reefs increase regional fish production? A<br />
review of existing data. Fisheries 22:17-23.<br />
Guy CS, Blankenship HL, Nielsen LA (1996) Tagging and Marking. In: Murphy BR, Willis DW (eds)<br />
Fisheries techniques 2 nd ed. American Fisheries Society, Betheseda, MD, p. 353-383.<br />
Hall TA (1999) BioEdit: a user-friendly biological sequence alignment editor and analysis program for<br />
Windows 95/98/NT. Nucleic Acids Symposium Series 41:95-98.<br />
Hardin G (1968) The tragedy of the commons. Science 162: 1243-1248.<br />
Harper JO (2002) Distribution and abundance of reef fishes inhabiting shell ridge zones in the northwest<br />
Gulf of Mexico. M.S. thesis. Texas A&M University, College Station, TX.<br />
Hastings RW (1979) The origins and seasonality of the fish fauna on a new jetty in the northeastern Gulf<br />
of Mexico. Bulletin of the Florida State Museum of Biological Sciences 24: 1-105.<br />
Heist EJ, Gold JR (2000) DNA microsatellite loci and genetic structure of red snapper in the Gulf of<br />
Mexico. Transactions of the American Fisheries Society 129: 469-475.<br />
Hernandez FJ, Shaw RF, Cope JS, Ditty JG, Farooqi T (2001) Do low-salinity, rock jetty habitats serve as<br />
nursery areas for presettlement larval and juvenile reef fish? Proceedings of the Gulf and<br />
Caribbean Fisheries Institute 52: 442-454.<br />
Hoese HD (1958) A partially annotated checklist of the marine fishes of Texas. Publications of the<br />
Institute of Marine Science 5: 312-352.<br />
Hoese HD, Moore RH (1998) Fishes of the Gulf of Mexico: Texas, Louisiana, and adjacent waters, 2 nd<br />
ed. Texas A&M University Press, College Station, TX.
69<br />
Hubbs CL (1939) The characters and distribution of the Atlantic coast fishes referred to the Genus<br />
Hypsoblennius. Papers of the Michigan Academy of Science, Arts, and Letters 24: 153-157.<br />
Hunte W, Côté IM (1989) Recruitment in the redlip blenny Ophioblennius atlanticus: is space limiting?<br />
Coral Reefs 8: 45-50.<br />
Jones GP (1991) Postrecruitment processes in the ecology of coral reef fish populations: a multifactorial<br />
perspective. In: Sale P (ed) The ecology of fishes on coral reefs. Academic Press, San Diego,<br />
CA, p. 294-328.<br />
Jones GP, Millcich MJ, Emslie MJ, Lunow C (1999) Self-recruitment in a coral reef fish population.<br />
Nature 402: 802-804.<br />
Kevern NR, Biener WE, VanDerLaan SR, Cornelius SD (1985) Preliminary evaluation of an artificial reef<br />
as a fishery management strategy in Lake Michigan. In: D’Itri FM (ed) Artificial reefs marine<br />
and freshwater applications. Lewis Publishers Inc., Chelsea, MI, p. 443-458.<br />
Kritzer JP (2002) Stock structure, mortality, and growth of the decorated goby, Istigobius decoratus<br />
(Gobiidae), at Lizard Island, Great Barrier Reef. Environmental Biology of Fishes 63: 211-216.<br />
Kumar S, Tamura K, Jakobsen IB, Nei M (2001) MEGA2: Molecular Evolutionary Genetics Analysis<br />
software. Arizona State University, Tempe, AZ.<br />
Labell M, Nursall JR (1985) Some aspects of the early life history of the redlip blenny, Ophioblennius<br />
atlanticus (Teleostei: Blenniidae). Copeia: 39-49.<br />
Leis JM (1991) The pelagic stage of reef fishes: the larval biology of coral reef fishes. In: Sale P (ed) The<br />
ecology of fishes on coral reefs. Academic Press, San Diego, CA, p. 183-230.<br />
Lindquist DG, Chandler GT (1978) Life history aspects of the crested blenny, Hypleurochilus geminatus<br />
(Wood). Journal of the Elisha Mitchell Scientific Society 94: 111-112.<br />
Lindquist DG, Dillman RM (1986) Trophic morphology of four Western Atlantic blennies (Pisces,<br />
Blenniidae). Copeia: 207-213.<br />
McEachron LW (1980) Gulf pier and jetty finfish catch statistics for the Gulf waters of Texas September<br />
1978-August 1979. Management Data Series, No. 11. Texas Parks and Wildlife Department.<br />
Miller MP (1997) Tools for population genetics analysis (TFPGA) 1.3: A Windows program for the<br />
analysis of allozyme and molecular population genetics data. Computer software distributed by<br />
author.<br />
Mottet MG (1985) Enhancement of the marine environment for fisheries and aquaculture in Japan. In:<br />
D’Itri FM (ed) Artificial reefs marine and freshwater applications. Lewis Publishers Inc.,<br />
Chelsea, MI, p. 13-112.<br />
Murdy EO, Birdsong RS, Musick JA (1997) Fishes of the Chesapeake Bay. Smithsonian Institution Press,<br />
Washington, D.C.<br />
Muss A, Robertson DR, Stepien CA, Wirtz P, Bowen BW (2001) Phylogeography of Ophioblennius: the<br />
role of ocean currents and geography in reef fish evolution. Evolution 55: 561-572.
70<br />
Neill WH (1979) Mechanisms of fish distribution in heterothermal environments. American Zoologist 19:<br />
305-317<br />
Nelson JP (1994) Fishes of the world, 3 rd ed. John Wiley and Sons, Inc., New York, NY.<br />
O’Farrel MM, Fives JM (1990) The feeding relationships of the shanny, Lipophyrys pholis (L.), and<br />
Montagu’s blenny, Coryphoblennius galerita (L.). Irish Fisheries Investigations 36: 3-16.<br />
Osenberg C, Mittelbach G, Wainwright P (1992) Two-stage life histories in fish: the interaction between<br />
juvenile competition and adult performance. Ecology 73: 255-267.<br />
Palumbi SR (1994) Genetic divergence, reproductive isolation, and marine speciation. Annual Review of<br />
Ecological Systematics 25: 547-572.<br />
Patzner RA (1999) Habitat utilization and depth distribution of small cryptobenthic fishes (Blenniidae,<br />
Gobiesocidae, Gobiidae, Tripterygiidae) in Ibiza (western Mediterranean Sea). Environmental<br />
Biology of Fishes 55: 207-214.<br />
Pfister CA (1996) The role and importance of recruitment variability to a guild of tide pool fishes.<br />
Ecology 77: 1928-1941.<br />
Phillips RR, Swears SB (1979) Social hierarchy, shelter use, and avoidance of predatory toadfish<br />
(Opsanus tau) by the striped blenny (Chasmodes bosquianus). Animal Behavior 27: 1113-1121.<br />
Port of Corpus Christi Authority (2001) Annual Review. http://www.portofcorpuschristi.com/statsyearly2<br />
/html. Accessed August 2002.<br />
Port of Houston Authority (2001) Overview. http://www.portofhouston.com/overview/overview1/htm.<br />
Accessed August 2002.<br />
Pulliam HR (1988) Sources, sinks, and population regulation. The American Naturalist 132: 652-661.<br />
Randall JE (1966) The West Indian blenniid fishes of the Genus Hypleurochilus, with the description of a<br />
new species. Proceedings of the Biological Society of Washington 79: 57-72.<br />
Rezak R, Bright TJ, McGrail DW (1985) Reefs and banks of the northwestern Gulf of Mexico. John<br />
Wiley and Sons, Inc., New York, NY.<br />
Riginos C (2000) Dispersal ability dictates the relative importance of biogeography, suitable habitat, and<br />
isolation by distance to population structure in Gulf of California blennies. Abstracts 80 th Annual<br />
Meeting of the American Society of Ichthyologists and Herpetologists, La Paz, Mexico, p. 307-<br />
308.<br />
Riginos C, Nachman MW (2001) Population subdivision in marine environments: the contributions of<br />
biogeography, geographical distance, and discontinuous habitat to genetic differentiation in a<br />
blennioid fish, Axolinus nigricaudus. Molecular Ecology 10: 1439-1453.<br />
Rooker JR, Holt SA (1997) Utilization of subtropical seagrass meadows by newly settled red drum<br />
Sciaenops ocellatus: patterns of distribution and growth. Marine Ecology Progress Series 158:<br />
139-149.<br />
Rozas J, Rozas R (1999) DnaSP version 3: an integrated program for molecular population genetics and<br />
molecular evolution analysis. Bioinformatics 15: 174-175.
71<br />
Santos RS, Nash RDM (1996) Seasonal variations of injuries suffered by individuals of the Azorean rockpool<br />
blenny (Parablennius sanguinolentus parvicornis). Copeia: 216-219.<br />
Schneider S, Roessli D, Excoffier L (2000) Arlequin: a software for population genetics data analysis.<br />
Ver. 2.000. Genetics and Biometry Lab, Dept. of Anthropology, University of Geneva,<br />
Switzerland.<br />
Secor DH, Dean JM, Laban EH (1991) Manual for Otolith Removal and Preparation for Microstructural<br />
Examination. Baruch Institute Technical Report 91-1, University of South Carolina, Columbia,<br />
SC.<br />
Shipp RL (1999) The artificial reef debate: are we asking the wrong questions? Gulf of Mexico Science:<br />
51-55.<br />
Slatkin M, Hudson R (1991) Pairwise comparison of mitochondrial DNA sequences in stable and<br />
exponentially growing populations. Genetics 129: 555-562.<br />
Smith NP (1975) Seasonal variations in nearshore circulation in the northwest Gulf of Mexico.<br />
Contributions in Marine Science 19: 45-65.<br />
Smith-Vaniz WF (1980) Revision of western Atlantic species of the blenniid fish genus Hypsoblennius.<br />
Proceedings of the Academy of Natural Sciecne of Philadelphia 132: 285-305.<br />
Springer VG (1958) Systematics and zoogeography of the clinid fishes of the subtribe Labrisomini Hubbs.<br />
Publications of the Institute of Marine Science 5: 417-492.<br />
Springer VG (1959) Blenniid fishes of the Genus Chasmodes. Texas Journal of Science 11: 321-334.<br />
Stephan CD, Dansby BG, Osburn HR, Matlock GC, Riechers RK, Rayburn R (1990) Texas artificial reef<br />
fishery management plan. Fishery Management Plan Series, No. 3. Texas Parks and Wildlife<br />
Department, Coastal Fisheries Branch.<br />
Stephens JS, Johnson RK, Key GS, McCosker JE (1970) The comparative ecology of three sympatric<br />
species of California blennies of the Genus Hypsoblennius Gill (Teleostomi, Blenniidae).<br />
Ecological Monographs 40: 213-233.<br />
Stobutzki IC, Bellwood DR (1997) Sustained swimming abilities of the late pelagic stages of coral reef<br />
fishes. Marine Ecology Progress Series 149: 35-41.<br />
Stone RB (1985) History of artificial reef use in the United States. In: D’Itri FM (ed) Artificial reefs<br />
marine and freshwater applications. Lewis Publishers Inc., Chelsea, MI, p. 13-112.<br />
Sturges W, Blaha JP (1976) A western boundary current in the Gulf of Mexico. Science 192: 367-369.<br />
Strickberger MW (1996) Evolution, 2 nd ed. Jones and Bartlett Publishers. Sudbury, MA.<br />
Swearer SE, Caselle JE, Lea DW, Warner RR (1999) Larval retention and recruitment in an island<br />
population of a coral-reef fish. Nature 402: 799-802.<br />
Topolski MF, Szedlmayer ST (2000) Vertical distribution and habitat association of four Blenniidae<br />
species in gas platforms in the northcentral Gulf of Mexico. Abstracts Gulf of Mexico Fish and<br />
Fisheries: Bringing Together New Research, New Orleans, LA.
72<br />
Underwood AJ (1981) Techniques of analysis of variance in experimental marine biology and ecology.<br />
Annual Reviews of Oceanography and Marine Biology 19: 513-605.<br />
Underwood AJ (1997) Experiments in ecology. Cambridge University Press, Cambridge, United<br />
Kingdom.<br />
Van Dolah RF, Knott DM, Calder DR (1984) Ecological effects of rubble weir jetty construction at<br />
Murrels Inlet, South Carolina; Volume I: Colonization and community development on new<br />
jetties. Technical Report EL-84-4, prepared by South Carolina Wildlife and Marine Resources<br />
Department, Charleston, SC, for US Army Engineer Waterways Experiment Station, Vicksburg,<br />
MS.<br />
Van Dolah RF, Wandt PH, Wenner CA, Martore RM, Sedberry GR, Moore CJ (1987) Ecological<br />
effects of rubble weir jetty construction at Murrels Inlet, South Carolina; Volume III: Community<br />
structure and habitat utilization of fishes and decapod associated with the jetties. Technical<br />
Report EL-84-4, prepared by South Carolina Wildlife and Marine Resources Department,<br />
Charleston, SC, for US Army Engineer Waterways Experiment Station, Vicksburg, MS.<br />
Vetemaa M, Foerlin L, Sandstroem O (1997) Chemical industry effluent impacts on reproduction and<br />
biochemistry in a North Sea population of viviparous blenny (Zoarces viviparus). Journal of<br />
Aquatic Ecosystem Stress and Recovery 6: 33-41.<br />
Whitten HL, Rosene F, Hedgpeth JW (1950) The invertebrate fauna of the Texas coast jetties: a<br />
preliminary survey. Publications of the Institute of Marine Science 1: 53-87.<br />
Wilson SK (2000) Trophic status and feeding selectivity of blennies (Blenniidae: Salariini). Marine<br />
Biology 136: 431-437.<br />
Woodland DJ (1999) An examination of the effect of ecological factors, especially competitive exclusion,<br />
on the distributions of species of an inshore, tropical, marine family of Indo-Pacific fishes<br />
(Siganidae). Proceedings of the 5 th Annual Indo-Pacific Fish Conference, Noumea, New<br />
Caledonia, p. 553-562. (Abstract)<br />
Yoshiyama RM, Sassman C (1993) Levels of genetic variability in sculpins (Cottidae: Teleostei) of the<br />
North American Pacific coast and an assessment of potential correlates. Biological Journal of the<br />
Linnean Society 50: 275-294.<br />
Zander CD, Nieder J, Martin K (1999) Vertical distribution patterns. In: Horn MH, Martin KLM,<br />
Chotkowski MA (eds) Intertidal fishes: life in two worlds. Academic Press, San Diego, CA, p.<br />
26-53.<br />
Zar JH (1996) Biostatistical analysis, 3 rd ed. Prentice Hall, Upper Saddle River, NJ.
APPENDIX A<br />
73
74<br />
100<br />
100<br />
75<br />
MAY 2000<br />
n=8<br />
75<br />
AUGUST 2000<br />
n=31<br />
50<br />
50<br />
25<br />
25<br />
% of individuals<br />
0<br />
100<br />
75<br />
50<br />
25<br />
0<br />
100<br />
75<br />
0-10 11-20 21-30 31-40 41-50 51-60 61-70 71-80 81-90 91-100 101-<br />
110<br />
111-<br />
120<br />
JUNE 2000<br />
n=5<br />
0-10 11-20 21-30 31-40 41-50 51-60 61-70 71-80 81-90 91-100 101-<br />
110<br />
111-<br />
120<br />
JULY 2000<br />
n=18<br />
0<br />
100<br />
75<br />
50<br />
25<br />
0<br />
100<br />
75<br />
0-10 11-20 21-30 31-40 41-50 51-60 61-70 71-80 81-90 91-100 101-<br />
110<br />
111-<br />
120<br />
SEPTEMBER 2000<br />
n=9<br />
0-10 11-20 21-30 31-40 41-50 51-60 61-70 71-80 81-90 91-100 101-<br />
110<br />
111-<br />
120<br />
OCTOBER 2000<br />
n=6<br />
50<br />
50<br />
25<br />
25<br />
0<br />
0-10 11-20 21-30 31-40 41-50 51-60 61-70 71-80 81-90 91-100 101-<br />
110<br />
111-<br />
120<br />
TL (mm)<br />
Fig. A-1. Monthly length-frequency distributions for <strong>Scartella</strong> <strong>cristata</strong> captured at<br />
Galveston, Texas from May 2000 to August 2001. Months in which S. <strong>cristata</strong> were<br />
not captured are omitted from this figure. Axes are standardized across each month.<br />
Y-axis is percent of monthly catch in 25% intervals. X-axis is 10 mm size classes<br />
starting with 0-10 mm and ending with 111-120 mm.<br />
0<br />
0-10 11-20 21-30 31-40 41-50 51-60 61-70 71-80 81-90 91-100 101-<br />
110<br />
111-<br />
120
75<br />
100<br />
100<br />
75<br />
NOVEMBER 2000<br />
n=7<br />
75<br />
MAY 2001<br />
n=12<br />
50<br />
50<br />
25<br />
25<br />
0<br />
100<br />
75<br />
0-10 11-20 21-30 31-40 41-50 51-60 61-70 71-80 81-90 91-100 101-<br />
110<br />
111-<br />
120<br />
DECEMBER 2000<br />
n=3<br />
0<br />
100<br />
75<br />
0-10 11-20 21-30 31-40 41-50 51-60 61-70 71-80 81-90 91-100 101-<br />
110<br />
111-<br />
120<br />
JUNE 2001<br />
n=25<br />
% of individuals<br />
50<br />
25<br />
0<br />
100<br />
75<br />
50<br />
0-10 11-20 21-30 31-40 41-50 51-60 61-70 71-80 81-90 91-100 101-<br />
110<br />
111-<br />
120<br />
MARCH 2001<br />
n=6<br />
50<br />
25<br />
0<br />
100<br />
75<br />
50<br />
0-10 11-20 21-30 31-40 41-50 51-60 61-70 71-80 81-90 91-100 101-<br />
110<br />
111-<br />
120<br />
JULY 2001<br />
n=33<br />
25<br />
25<br />
0<br />
100<br />
0-10 11-20 21-30 31-40 41-50 51-60 61-70 71-80 81-90 91-100 101-<br />
110<br />
111-<br />
120<br />
0<br />
100<br />
0-10 11-20 21-30 31-40 41-50 51-60 61-70 71-80 81-90 91-100 101-<br />
110<br />
111-<br />
120<br />
75<br />
APRIL 2001<br />
n=20<br />
75<br />
AUGUST 2001<br />
n=11<br />
50<br />
50<br />
25<br />
25<br />
0<br />
0-10 11-20 21-30 31-40 41-50 51-60 61-70 71-80 81-90 91-100 101-<br />
110<br />
Fig. A-1. CONTINUED<br />
111-<br />
120<br />
TL (mm)<br />
0<br />
0-10 11-20 21-30 31-40 41-50 51-60 61-70 71-80 81-90 91-100 101-<br />
110<br />
111-<br />
120
76<br />
100<br />
75<br />
MAY 2000<br />
n=32<br />
100<br />
75<br />
AUGUST 2000<br />
n=32<br />
50<br />
50<br />
25<br />
25<br />
% of individuals<br />
0<br />
100<br />
75<br />
50<br />
25<br />
0<br />
100<br />
75<br />
0-10 11-20 21-30 31-40 41-50 51-60 61-70 71-80 81-90 91-100 101-<br />
110<br />
JUNE 2000<br />
n=12<br />
0-10 11-20 21-30 31-40 41-50 51-60 61-70 71-80 81-90 91-100 101-<br />
110<br />
111-<br />
120<br />
111-<br />
120<br />
JULY 2000<br />
n=34<br />
0<br />
100<br />
75<br />
50<br />
25<br />
0<br />
100<br />
75<br />
0-10 11-20 21-30 31-40 41-50 51-60 61-70 71-80 81-90 91-100 101-<br />
110<br />
SEPTEMBER 2000<br />
n=2<br />
0-10 11-20 21-30 31-40 41-50 51-60 61-70 71-80 81-90 91-100 101-<br />
110<br />
111-<br />
120<br />
111-<br />
120<br />
OCTOBER 2000<br />
n=7<br />
50<br />
50<br />
25<br />
25<br />
0<br />
0-10 11-20 21-30 31-40 41-50 51-60 61-70 71-80 81-90 91-100 101-<br />
110<br />
111-<br />
120<br />
TL (mm)<br />
0-10 11-20 21-30 31-40 41-50 51-60 61-70 71-80 81-90 91-100 101-<br />
110<br />
Fig. A-2. Monthly length-frequency distributions for Hypleurochilus geminatus<br />
captured at Galveston, Texas from May 2000 to August 2001. Months in which H.<br />
geminatus were not captured are omitted from this figure. Axes are standardized<br />
across each month. Y-axis is percent of monthly catch in 25% intervals. X-axis is 10<br />
mm size classes starting with 0-10 mm and ending with 111-120 mm.<br />
0<br />
111-<br />
120
77<br />
100<br />
100<br />
75<br />
NOVEMBER 2000<br />
n=3<br />
75<br />
MAY 2001<br />
n=21<br />
50<br />
50<br />
25<br />
25<br />
0<br />
100<br />
75<br />
0-10 11-20 21-30 31-40 41-50 51-60 61-70 71-80 81-90 91-100 101-<br />
110<br />
111-<br />
120<br />
FEBRUARY 2001<br />
n=1<br />
0<br />
100<br />
75<br />
0-10 11-20 21-30 31-40 41-50 51-60 61-70 71-80 81-90 91-100 101-<br />
110<br />
111-<br />
120<br />
JUNE 2001<br />
n=41<br />
50<br />
50<br />
% of individuals<br />
25<br />
0<br />
100<br />
75<br />
0-10 11-20 21-30 31-40 41-50 51-60 61-70 71-80 81-90 91-100 101-<br />
110<br />
111-<br />
120<br />
MARCH 2001<br />
n=1<br />
25<br />
0<br />
100<br />
75<br />
0-10 11-20 21-30 31-40 41-50 51-60 61-70 71-80 81-90 91-100 101-<br />
110<br />
111-<br />
120<br />
JULY 2001<br />
n=8<br />
50<br />
50<br />
25<br />
25<br />
0<br />
100<br />
75<br />
0-10 11-20 21-30 31-40 41-50 51-60 61-70 71-80 81-90 91-100 101-<br />
110<br />
111-<br />
120<br />
APRIL 2001<br />
n=5<br />
0<br />
0-10 11-20 21-30 31-40 41-50 51-60 61-70 71-80 81-90 91-100 101-<br />
110<br />
111-<br />
120<br />
50<br />
25<br />
0<br />
Fig. A-2. CONTINUED<br />
0-10 11-20 21-30 31-40 41-50 51-60 61-70 71-80 81-90 91-100 101-<br />
110<br />
111-<br />
120<br />
TL (mm)
78<br />
100<br />
MAY 2000<br />
n=36<br />
100<br />
AUGUST 2000<br />
n=12<br />
75<br />
75<br />
50<br />
50<br />
% of individuals<br />
25<br />
0<br />
100<br />
75<br />
0-10 11-20 21-30 31-40 41-50 51-60 61-70 71-80 81-90 91-100 101-<br />
110<br />
111-<br />
120<br />
JULY 2000<br />
n=10<br />
25<br />
0<br />
100<br />
75<br />
0-10 11-20 21-30 31-40 41-50 51-60 61-70 71-80 81-90 91-100 101-<br />
110<br />
111-<br />
120<br />
MAY 2001<br />
n=1<br />
50<br />
50<br />
25<br />
25<br />
0<br />
0-10 11-20 21-30 31-40 41-50 51-60 61-70 71-80 81-90 91-100 101-<br />
110<br />
111-<br />
120<br />
TL (mm)<br />
0-10 11-20 21-30 31-40 41-50 51-60 61-70 71-80 81-90 91-100 101-<br />
110<br />
Fig. A-3. Monthly length-frequency distributions for Hypsoblennius ionthas<br />
captured at Galveston, Texas from May 2000 to August 2001. Months in which H.<br />
ionthas were not captured are omitted from this figure. Axes are standardized across<br />
each month. Y-axis is percent of monthly catch in 25% intervals. X-axis is 10 mm<br />
size classes starting with 0-10 mm and ending with 111-120 mm.<br />
0<br />
111-<br />
120
79<br />
100<br />
100<br />
75<br />
MAY 2000<br />
n=23<br />
75<br />
AUGUST 2000<br />
n=201<br />
50<br />
50<br />
25<br />
25<br />
% of individuals<br />
0<br />
100<br />
75<br />
50<br />
25<br />
0<br />
100<br />
75<br />
0-10 11-20 21-30 31-40 41-50 51-60 61-70 71-80 81-90 91-100 101-<br />
110<br />
JUNE 2000<br />
n=30<br />
0-10 11-20 21-30 31-40 41-50 51-60 61-70 71-80 81-90 91-100 101-<br />
110<br />
111-<br />
120<br />
111-<br />
120<br />
JULY 2000<br />
n=43<br />
0<br />
100<br />
75<br />
50<br />
25<br />
0<br />
100<br />
75<br />
0-10 11-20 21-30 31-40 41-50 51-60 61-70 71-80 81-90 91-100 101-<br />
110<br />
SEPTEMBER 2000<br />
n=240<br />
0-10 11-20 21-30 31-40 41-50 51-60 61-70 71-80 81-90 91-100 101-<br />
110<br />
111-<br />
120<br />
111-<br />
120<br />
OCTOBER 2000<br />
n=273<br />
50<br />
50<br />
25<br />
25<br />
0<br />
0-10 11-20 21-30 31-40 41-50 51-60 61-70 71-80 81-90 91-100 101-<br />
110<br />
111-<br />
120<br />
TL (mm)<br />
0-10 11-20 21-30 31-40 41-50 51-60 61-70 71-80 81-90 91-100 101-<br />
110<br />
Fig. A-4. Monthly length-frequency distributions for <strong>Scartella</strong> <strong>cristata</strong> captured at<br />
Port Aransas, Texas from May 2000 to August 2001. S. <strong>cristata</strong> was captured every<br />
month except for November 2000 when no collection effort was made. Axes are<br />
standardized across each month. Y-axis is percent of monthly catch in 25% intervals.<br />
X-axis is 10 mm size classes starting with 0-10 mm and ending with 111-120 mm.<br />
0<br />
111-<br />
120
80<br />
100<br />
100<br />
75<br />
DECEMBER 2000<br />
n=188<br />
75<br />
MARCH 2001<br />
n=16<br />
50<br />
50<br />
25<br />
25<br />
% of individuals<br />
0<br />
100<br />
75<br />
50<br />
25<br />
0-10 11-20 21-30 31-40 41-50 51-60 61-70 71-80 81-90 91-100 101-<br />
110<br />
111-<br />
120<br />
JANUARY 2000<br />
n=2<br />
0<br />
100<br />
75<br />
50<br />
25<br />
0-10 11-20 21-30 31-40 41-50 51-60 61-70 71-80 81-90 91-100 101-<br />
110<br />
111-<br />
120<br />
APRIL 2001<br />
n=14<br />
0<br />
100<br />
0-10 11-20 21-30 31-40 41-50 51-60 61-70 71-80 81-90 91-100 101-<br />
110<br />
111-<br />
120<br />
0<br />
100<br />
0-10 11-20 21-30 31-40 41-50 51-60 61-70 71-80 81-90 91-100 101-<br />
110<br />
111-<br />
120<br />
75<br />
FEBRUARY 2001<br />
n=40<br />
75<br />
MAY 2001<br />
n=34<br />
50<br />
50<br />
25<br />
25<br />
0<br />
0-10 11-20 21-30 31-40 41-50 51-60 61-70 71-80 81-90 91-100 101-<br />
110<br />
Fig. A-4. CONTINUED<br />
111-<br />
120<br />
TL (mm)<br />
0<br />
0-10 11-20 21-30 31-40 41-50 51-60 61-70 71-80 81-90 91-100 101-<br />
110<br />
111-<br />
120
81<br />
100<br />
JUNE 2001<br />
n=525<br />
100<br />
AUGUST 2001<br />
n=50<br />
75<br />
75<br />
50<br />
50<br />
% of individuals<br />
25<br />
0<br />
100<br />
75<br />
0-10 11-20 21-30 31-40 41-50 51-60 61-70 71-80 81-90 91-100 101-<br />
110<br />
111-<br />
120<br />
JULY 2001<br />
n=188<br />
25<br />
0<br />
0-10 11-20 21-30 31-40 41-50 51-60 61-70 71-80 81-90 91-100 101-<br />
110<br />
111-<br />
120<br />
50<br />
25<br />
0<br />
0-10 11-20 21-30 31-40 41-50 51-60 61-70 71-80 81-90 91-100 101-<br />
110<br />
Fig. A-4. CONTINUED<br />
111-<br />
120<br />
TL (mm)
82<br />
100<br />
100<br />
75<br />
MAY 2000<br />
n=3<br />
75<br />
AUGUST 2000<br />
n=3<br />
50<br />
50<br />
25<br />
25<br />
% of individuals<br />
0<br />
100<br />
75<br />
50<br />
25<br />
0<br />
100<br />
75<br />
0-10 11-20 21-30 31-40 41-50 51-60 61-70 71-80 81-90 91-100 101-<br />
110<br />
JUNE 2000<br />
n=5<br />
0-10 11-20 21-30 31-40 41-50 51-60 61-70 71-80 81-90 91-100 101-<br />
110<br />
111-<br />
120<br />
111-<br />
120<br />
JULY 2000<br />
n=13<br />
0<br />
100<br />
75<br />
50<br />
25<br />
0<br />
100<br />
75<br />
0-10 11-20 21-30 31-40 41-50 51-60 61-70 71-80 81-90 91-100 101-<br />
110<br />
SEPTEMBER 2000<br />
n=2<br />
0-10 11-20 21-30 31-40 41-50 51-60 61-70 71-80 81-90 91-100 101-<br />
110<br />
111-<br />
120<br />
111-<br />
120<br />
DECEMBER 2000<br />
n=1<br />
50<br />
50<br />
25<br />
25<br />
0<br />
0-10 11-20 21-30 31-40 41-50 51-60 61-70 71-80 81-90 91-100 101-<br />
110<br />
111-<br />
120<br />
TL (mm)<br />
0-10 11-20 21-30 31-40 41-50 51-60 61-70 71-80 81-90 91-100 101-<br />
110<br />
Fig. A-5. Monthly length-frequency distributions for Hypleurochilus geminatus<br />
captured at Port Aransas, Texas from May 2000 to August 2001. Months in which H.<br />
geminatus were not captured are omitted from this figure except for November 2000<br />
when no collection effort was made. Axes are standardized across each month. Y-<br />
axis is percent of monthly catch in 25% intervals. X-axis is 10 mm size classes<br />
starting with 0-10 mm and ending with 111-120 mm.<br />
0<br />
111-<br />
120
83<br />
100<br />
100<br />
75<br />
FEBRUARY 2001<br />
n=7<br />
75<br />
JUNE 2001<br />
n=5<br />
50<br />
50<br />
25<br />
25<br />
0<br />
100<br />
0-10 11-20 21-30 31-40 41-50 51-60 61-70 71-80 81-90 91-100 101- 111-<br />
110 120<br />
0<br />
100<br />
0-10 11-20 21-30 31-40 41-50 51-60 61-70 71-80 81-90 91-100 101- 111-<br />
110 120<br />
75<br />
MARCH 2001<br />
n=1<br />
75<br />
JULY 2001<br />
n=8<br />
50<br />
50<br />
% of individuals<br />
25<br />
0<br />
100<br />
75<br />
0-10 11-20 21-30 31-40 41-50 51-60 61-70 71-80 81-90 91-100 101- 111-<br />
110 120<br />
APRIL 2001<br />
n=4<br />
25<br />
0<br />
100<br />
75<br />
0-10 11-20 21-30 31-40 41-50 51-60 61-70 71-80 81-90 91-100 101- 111-<br />
110 120<br />
AUGUST 2001<br />
n=2<br />
50<br />
50<br />
25<br />
25<br />
0<br />
100<br />
75<br />
0-10 11-20 21-30 31-40 41-50 51-60 61-70 71-80 81-90 91-100 101- 111-<br />
110 120<br />
MAY 2001<br />
n=10<br />
0<br />
0-10 11-20 21-30 31-40 41-50 51-60 61-70 71-80 81-90 91-100 101- 111-<br />
110 120<br />
50<br />
25<br />
0<br />
0-10 11-20 21-30 31-40 41-50 51-60 61-70 71-80 81-90 91-100 101- 111-<br />
110 120<br />
Fig. A-5. CONTINUED<br />
TL (mm)
84<br />
100<br />
100<br />
75<br />
JULY 2000<br />
n=3<br />
75<br />
JUNE 2001<br />
n=1<br />
50<br />
50<br />
% of individuals<br />
25<br />
0<br />
100<br />
75<br />
0-10 11-20 21-30 31-40 41-50 51-60 61-70 71-80 81-90 91-100 101- 111-<br />
110 120<br />
AUGUST 2000<br />
n=3<br />
25<br />
0<br />
100<br />
75<br />
0-10 11-20 21-30 31-40 41-50 51-60 61-70 71-80 81-90 91-100 101- 111-<br />
110 120<br />
JULY 2001<br />
n=1<br />
50<br />
50<br />
25<br />
25<br />
0<br />
0-10 11-20 21-30 31-40 41-50 51-60 61-70 71-80 81-90 91-100 101- 111-<br />
110 120<br />
TL (mm)<br />
0-10 11-20 21-30 31-40 41-50 51-60 61-70 71-80 81-90 91-100 101- 111-<br />
110 120<br />
Fig. A-6. Monthly length-frequency distributions for Labrisomus nuchipinnis<br />
captured at Port Aransas, Texas from May 2000 to August 2001. Months in which L.<br />
nuchipinnis were not captured are omitted from this figure except for November 2000<br />
when no collection effort was made. Axes are standardized across each month. Y-<br />
axis is percent of monthly catch in 25% intervals. X-axis is 10 mm size classes<br />
starting with 0-10 mm and ending with 111-120 mm.<br />
0
85<br />
100<br />
75<br />
JULY 2000<br />
n=81<br />
100<br />
75<br />
OCTOBER 2000<br />
n=15<br />
50<br />
50<br />
25<br />
25<br />
100% of individuals<br />
0<br />
100<br />
75<br />
50<br />
25<br />
0<br />
75<br />
0-10 11-20 21-30 31-40 41-50 51-60 61-70 71-80 81-90 91-100 101-<br />
110<br />
AUGUST 2000<br />
n=128<br />
0-10 11-20 21-30 31-40 41-50 51-60 61-70 71-80 81-90 91-100 101-<br />
110<br />
111-<br />
120<br />
111-<br />
120<br />
SEPTEMBER 2000<br />
n=71<br />
0<br />
100<br />
75<br />
50<br />
25<br />
0<br />
100<br />
75<br />
0-10 11-20 21-30 31-40 41-50 51-60 61-70 71-80 81-90 91-100 101-<br />
110<br />
DECEMBER 2000<br />
n=59<br />
0-10 11-20 21-30 31-40 41-50 51-60 61-70 71-80 81-90 91-100 101-<br />
110<br />
111-<br />
120<br />
111-<br />
120<br />
JANUARY 2001<br />
n=5<br />
50<br />
50<br />
25<br />
25<br />
0<br />
0-10 11-20 21-30 31-40 41-50 51-60 61-70 71-80 81-90 91-100 101-<br />
110<br />
111-<br />
120<br />
TL (mm)<br />
0-10 11-20 21-30 31-40 41-50 51-60 61-70 71-80 81-90 91-100 101-<br />
110<br />
Fig. A-7. Monthly length-frequency distributions for <strong>Scartella</strong> <strong>cristata</strong> captured at<br />
South Padre Island, Texas from July 2000 to August 2001. S. <strong>cristata</strong> was captured<br />
every month except for November 2000 when no collection effort was made. Axes<br />
are standardized across each month. Y-axis is percent of monthly catch in 25%<br />
intervals. X-axis is 10 mm size classes starting with 0-10 mm and ending with 111-<br />
120 mm.<br />
0<br />
111-<br />
120
86<br />
100<br />
100<br />
75<br />
FEBRUARY 2001<br />
n=11<br />
75<br />
JUNE 2001<br />
n=282<br />
50<br />
50<br />
25<br />
25<br />
0<br />
100<br />
0-10 11-20 21-30 31-40 41-50 51-60 61-70 71-80 81-90 91-100 101- 111-<br />
110 120<br />
0<br />
100<br />
0-10 11-20 21-30 31-40 41-50 51-60 61-70 71-80 81-90 91-100 101- 111-<br />
110 120<br />
75<br />
MARCH 2001<br />
n=50<br />
75<br />
JULY 2001<br />
n=457<br />
% of individuals<br />
50<br />
25<br />
0<br />
100<br />
75<br />
0-10 11-20 21-30 31-40 41-50 51-60 61-70 71-80 81-90 91-100 101- 111-<br />
110 120<br />
APRIL 2001<br />
n=45<br />
50<br />
25<br />
0<br />
100<br />
75<br />
0-10 11-20 21-30 31-40 41-50 51-60 61-70 71-80 81-90 91-100 101- 111-<br />
110 120<br />
AUGUST 2001<br />
n=161<br />
50<br />
50<br />
25<br />
25<br />
0<br />
100<br />
0-10 11-20 21-30 31-40 41-50 51-60 61-70 71-80 81-90 91-100 101- 111-<br />
110 120<br />
0<br />
0-10 11-20 21-30 31-40 41-50 51-60 61-70 71-80 81-90 91-100 101- 111-<br />
110 120<br />
75<br />
MAY 2001<br />
n=687<br />
50<br />
25<br />
0<br />
0-10 11-20 21-30 31-40 41-50 51-60 61-70 71-80 81-90 91-100 101- 111-<br />
110 120<br />
Fig. A-7. CONTINUED<br />
TL (mm)
87<br />
100<br />
100<br />
75<br />
MARCH 2001<br />
n=1<br />
75<br />
JUNE 2001<br />
n=1<br />
50<br />
50<br />
% of individuals<br />
25<br />
0<br />
100<br />
75<br />
0-10 11-20 21-30 31-40 41-50 51-60 61-70 71-80 81-90 91-100 101- 111-<br />
110 120<br />
MAY 2001<br />
n=22<br />
25<br />
0<br />
0-10 11-20 21-30 31-40 41-50 51-60 61-70 71-80 81-90 91-100 101- 111-<br />
110 120<br />
50<br />
25<br />
0<br />
0-10 11-20 21-30 31-40 41-50 51-60 61-70 71-80 81-90 91-100 101- 111-<br />
110 120<br />
TL (mm)<br />
Fig. A-8. Monthly length-frequency distributions for Hypleurochilus geminatus<br />
captured at South Padre Island, Texas from July 2000 to August 2001. Months in<br />
which H. geminatus were not captured are omitted from this figure except for<br />
November 2000 when no collection effort was made. Axes are standardized across<br />
each month. Y-axis is percent of monthly catch in 25% intervals. X-axis is 10 mm<br />
size classes starting with 0-10 mm and ending with 111-120 mm.
88<br />
100<br />
100<br />
75<br />
JULY 2000<br />
n=19<br />
75<br />
DECEMBER 2000<br />
n=1<br />
50<br />
50<br />
25<br />
25<br />
% of individuals<br />
0<br />
100<br />
75<br />
50<br />
25<br />
0<br />
100<br />
75<br />
0-10 21-30 41-50 61-70 81-90 101-<br />
110<br />
121-<br />
130<br />
AUGUST 2000<br />
n=15<br />
0-10 21-30 41-50 61-70 81-90 101-<br />
100<br />
110<br />
121-<br />
130<br />
SEPTEMBER 2000<br />
n=11<br />
0<br />
100<br />
75<br />
50<br />
25<br />
0<br />
100<br />
75<br />
0-10 21-30 41-50 61-70 81-90 101-<br />
110<br />
121-<br />
130<br />
APRIL 2001<br />
n=3<br />
0-10 21-30 41-50 61-70 81-90 101-<br />
110<br />
121-<br />
130<br />
MAY 2001<br />
n=2<br />
50<br />
50<br />
25<br />
25<br />
0<br />
0-10 21-30 41-50 61-70 81-90 101-<br />
110<br />
121-<br />
130<br />
TL (mm)<br />
Fig. A-9. Monthly length-frequency distributions for Labrisomus nuchipinnis<br />
captured at South Padre Island, Texas from July 2000 to August 2001. Months in<br />
which L. nuchipinns were not captured are omitted from this figure except for<br />
November 2000 when no collection effort was made. Axes are standardized across<br />
each month. Y-axis is percent of monthly catch in 25% intervals. X-axis is 10 mm<br />
size classes starting with 0-10 mm and ending with 131-140 mm.<br />
0<br />
0-10 21-30 41-50 61-70 81-90 101-<br />
110<br />
121-<br />
130
89<br />
100<br />
100<br />
75<br />
JUNE 2001<br />
n=7<br />
75<br />
AUGUST 2001<br />
n=12<br />
% of individuals<br />
50<br />
25<br />
0<br />
100<br />
75<br />
0-10 21-30 41-50 61-70 81-90 101-<br />
110<br />
121-<br />
130<br />
JULY 2001<br />
n=9<br />
50<br />
25<br />
0<br />
0-10 21-30 41-50 61-70 81-90 101-<br />
110<br />
121-<br />
130<br />
50<br />
25<br />
0<br />
0-10 21-30 41-50 61-70 81-90 101-<br />
110<br />
Fig. A-9. CONTINUED<br />
121-<br />
130<br />
TL (mm)
APPENDIX B<br />
90
91<br />
APPENDIX B. Sequences for each haplotype characterized at Florida and Texas<br />
localities. Underscores ( _ ) represent alignment gaps.<br />
HAPLOTYPE A<br />
CTGCC_TTTAAAAGTT_GGATGTACAT_GTATGTATTAACACCATAAATTTATATTAACCATTA<br />
ATTCATAGTATTAAGTACATTTAGATATATAATCA_CATACCATAATATACAACTATCAAGGA<br />
TTATACAACATTAAGGTATACATAACCCATTTATATATTAACACCAAACTAAAAGAATTTAAC<br />
CCAGGAAATCTTCATAACTCAATAAGAATAGGCTCCAAGGCATTTATACCATGCATTCAACA<br />
TCCCACCCATCGAAAATACTATACCCAATAAGAACCGACCATCAGTTGATATCTTAATGCCA<br />
ACGGTTATTGATGGTCAGGGACAATTATTGTGGGGGTTTCATTTAATGAACTATTCCTGGCAT<br />
CTGGTTC<br />
HAPLOTYPE B<br />
CTGCC_TTTAAAAGTT_GGATGTACAT_GTATGTATTAACACCATAAATTTATATTAACCATTA<br />
ATTCATAGTATTAAGTACATTTAGATATATAATCAACATACCATAATATACAACTATCAAGGA<br />
TTATACAACATTAAGGTATACATAACCCATTTATATATTAACACCAAACTAAAAGAATTTAAC<br />
CCAGGAAATCTTCATAACTCAATAAGAATAGGCTCCAAGGCATTTATACCATGCATTCAACA<br />
TCCCACCCATCGAAAATACTATACCCAATAAGAACCGACCATCAGTTGATATCTTAATGCCA<br />
ACGGTTATTGATGGTCAGGGACAATTATTGTGGGGGTTTCACTTAATGAACTATTCCTGGCAT<br />
CTGGTCT<br />
HAPLOTYPE C<br />
CTGCC_TTTAAAAGTT_GGATGTACAT_GTATGTATTAACACCATAAATTTATATTAACCATTA<br />
ATTCATAGTATTAAGTACATTTAGATATATAATCAACATACCATAATATACAACTATCAAGGA<br />
TTATACAACATTAAGGTATACATAACCCATTTATATATTAACACCAAACTAAAAGAATTTAAC<br />
CCAGGAAATCTTCATAACTCAATAAGAATAGGCTCCAAGGCATTTATACCATGCATTCAACA<br />
TCCCACCCATCGAAAATAATATACCCAATAAGAACCGACCATCAGTTGATATCTTAATGCCA<br />
ACGGTTATTGATGGTCAGGGACAATTATTGTGGGGGTTTCACTTAATGAACTATTCCTGGCAT<br />
CTGGTCT<br />
HAPLOTYPE D<br />
CTGCC_TTTAAAAGTT_GGATGTACAT_GTATGTATTAACACCATAAATTTATATTAACCATTA<br />
ATTCATAGTATTAAGTACATTTAGATATATAATCAACATACCATAATATACAACTATCAAGGA<br />
TTATACAACATTAAGGTATACATAACCCATTTATATATTAACACCAAACTAAAAGAATTTAAC<br />
CCAGGAAATCTTCATAACTCAATAAGAATAGGCTCCAAGGCATTTATACCATGCATTCAACA<br />
TCCCACCCATCGAAAATACTATACCCAATAAGAACCGACCATCAGTTGATATCTTAATGCCA<br />
ACGGTTATTGATGGTCAGGGACAATTATTGTGGGGGTTTCATTTAATGAACTATTCCTGGCAT<br />
CTGGTCT<br />
HAPLOTYPE E<br />
CTGCC_TTTAAAAGTT_GGATGTACAT_GTATGTATTAACACCATAAATTTATATTAACCATTA<br />
ATTCATAGTATTAAGTACATTTAGATATATAATCAACATACCATAATATACAACTATCAAGGA<br />
TTATACAACATTAAGGTATACATAACCCATTTATATATTAACACCAAACTAAAAGAATTTAAC<br />
CCAGGAAATCTTCATAACTCAATAAGAATAGGCTCCAAGGCATTTATACCATGCATTCAACA<br />
TCCCACCCATCGAAAATACTATACCCAATAAGAACCGACCATCAGTTGATATCTTAATGCCA<br />
ACGGTTATTGATGGTCAGGGACAATTATTGTGGGGGTTTCACTTAATGAACTATTCCTGGCAT<br />
CTGGTTC
92<br />
HAPLOTYPE F<br />
CTGCC_TTTAAAAGTT_GGATGTACAT_GTATGTATTAACACCATAAATTTATATTAACCATTA<br />
ATTCATAGTATTAAGTACATTTAGATATATAATCAACATACCATAATATACAACTATCAAGAA<br />
TTATACAACATTAAGGTATACATAACCCATTTATATATTAACACCAAACTAAAAGAATTTAAC<br />
CCAGGAAATCTTCATAACTCAATAAGAATAGGCTCCAAGGCATTTATACCATGCATTCAACA<br />
TCCCACCCATCGAAAATACTATACCCAATAAGAACCGACCATCAGTTGATATCTTAATGCCA<br />
ACGGTTATTGATGGTCAGGGACAATTATTGTGGGGGTTTCACTTAATGAACTATTCCTGGCAT<br />
CTGGTCT<br />
HAPLOTYPE G<br />
CTGAC_TTGAAAAGTT_GGATGTACAT_GTATGTATTAACACCATAAATTTATATTAACCATTA<br />
ATTCATAGTATTAAGTACATTTAGATATATAATCAACATACCATAATATACAACTATCAAGGA<br />
TTATACAACATTAAGGTATACATAACCCATTTATATATTAACACCAAACTAAAAGAATTTAAC<br />
CCAGGAAATCTTCATAACTCAATAAGAATAGGCTCCAAGGCATTTATACCATGCATTCAACA<br />
TCCCACCCATCGAAAATACTATACCCAATAAGAACCGACCATCAGTTGATATCTTAATGCCA<br />
ACGGTTATTGATGGTCAGGGACAATTATTGTGGGGGTTTCACTTAATGAACTATTCCTGGCAT<br />
CTGGTTC<br />
HAPLOTYPE H<br />
CTGCC_TTTAAAAGTT_GGATGTACAT_GTATGTATTAACACCATAAATTTATATTAACCATTA<br />
ATTCATAGTATTAAATACATTTAGATATATAATCAACATACCATAATATACAACTATCAAGGA<br />
TTATACAACATTAAGGTATACATAACCCATTTATATATTAACACCAAACTAAAAGAATTTAAC<br />
CCAGGAAATCTTCATAACTCAATAAGAATAGGCTCCAAGGCATTTATACCATGCATTCAACA<br />
TCCCACCCATCGAAAATACTATACCCAATAAGAACCGACCATCAGTTGATATCTTAATGCCA<br />
ACGGTTATTGATGGTCAGGGACAATTATTGTGGGGGTTTCATTTAATGAACTATTCCTGGCAT<br />
CTGGTCT<br />
HAPLOTYPE I<br />
CTGCCATTTAAAAGTT_GGATGTACAT_GTATGTATTAACACCATAAATTTATATTAACCATTA<br />
ATTCATAGTATTAAGTACATTTAGATATATAATCAACATACCATAATATACAACTATCAAGGA<br />
TTATACAACATTAAGGTATACATAACCCATTTATATATTAACACCAAACTAAAAGAATTTAAC<br />
CCAGGAAATCTTCATAACTCAATAAGAATAGGCTCCAAGGCATTTATACCATGCATTCAACA<br />
TCCCACCCATCGAAAATACTATACCCAATAAGAACCGACCATCAGTTGATATCTTAATGCCA<br />
ACGGTTATTGATGGTCAGGGACAATTATTGTGGGGGTTTCACTTAATGAACTATTCCTGGCAT<br />
CTGGTTC<br />
HAPLOTYPE J<br />
CTGAC_TTGAAAAGTTGGGATGTACAT_GTATGTATTAACACCATAAATTTATATTAACCATT<br />
AATTCATAGTATTAAGTACATTTAGATATATAATCA_CATACCATAATATACAACTATCAAGG<br />
ATTATACAACATTAAGGTATACATAACCCATTTATATATTAACACCAAACTAAAAGAATTTAA<br />
CCCAGGAAATCTTCATAACTCAATAAGAATAGGCTCCAAGGCATTTATACCATGCATTCAAC<br />
ATCCCACCCATCGAAAATACTATACCCAATAAGAACCGACCATCAGTTGATATCTTAATGCC<br />
AACGGTTATTGATGGTCAGGGACAATTATTGTGGGGGTTTCATTTAATGAACTATTCCTGGCA<br />
TCTGGTTC
93<br />
HAPLOTYPE K<br />
CTGAC_TTGAAAAGTTGGGATGTACAT_GTATGTATTAACACCATAAATTTATATTAACCATT<br />
AATTCATAGTATTAAGTACATTTAGATATATAATCAACATACCATAATATACAACTATCAAGG<br />
ATTATACAACATTAAGGTATACATAACCCATTTATATATTAACACCAAACTAAAAGAATTTAA<br />
CCCAGGAAATCTTCATAACTCAATAAGAATAGGCTCCAAGGCATTTATACCATGCATTCAAC<br />
ATCCCACCCATCGAAAATAATATACCCAATAAGAACCGACCATCAGTTGATATCTTAATGCC<br />
AACGGTTATTGATGGTCAGGGACAATTATTGTGGGGGTTTCACTTAATGAACTATTCCTGGCA<br />
TCTGGTTC<br />
HAPLOTYPE L<br />
CCGAC_TTGAAAAGTTGGGATGTACATAGTATGTATTAACACCATAAATTTATATTAACCATT<br />
AATTCATAGTATTAAATACATTTAGATATATAATCAACATACCATAATATACAACTATCAAGG<br />
ATTATACAACATTAAGGTATACATAACCCATTTATATATTAACACCAAACTAAAAGAATTTAA<br />
CCCAGGAAATCTTCATAACTCAATAAGAATAGGCTCCAAGGCATTTATACCATGCATTCAAC<br />
ATCCCACCCATCGAAAATACTATACCCAATAAGAACCGACCATCAGTTGATATCTTAATGCC<br />
AACGGTTATTGATGGTCAGGGACAATTATTGTGGGGGTTTCATTTAATGAACTATTCCTGGCA<br />
TCTGGTTC<br />
HAPLOTYPE M<br />
CTGCCATTGAAAAGTTGGGATGTACAT_GTATGTATTAACACCATAAATAGATATTAACCATT<br />
AATTCATAGTATTAAGTACATTTAGATATATAATCA_CATACCATAATATACAACTATCAAGG<br />
ATTATACAACATTAAGGTATACATAACCCATTTATATATTAACACCAAACTAAAAGAATTTAA<br />
CCCAGGAAATCTTCATAACTCAATAAGAATAGGCTCCAAGGCATTTATACCATGCATTCAAC<br />
ATCCCACCCATCGAAAATACTATACCCAATAAGAACCGACCATCAGTTGATATCTTAATGCC<br />
AACGGTTATTGATGGTCAGGGACAATTATTGTGGGGGTTTCACTTAATGAACTATTCCTGGCA<br />
TCTGGTTC<br />
HAPLOTYPE N<br />
CTGCCATTGAAAAGTTGGGATGTACAT_GTATGTATTAACACCATAAATGGATATTAACCATT<br />
ATTTCATAGTATTAAGTACATTTAGATATATAATCAACATACCATAATATACAACTATCAAGG<br />
ATTATACAACATTAAGGTATACATAACCCATTTATATATTAACACCAAACTAAAAGAATTTAA<br />
CCCAGGAAATCTTCATAACTCAATAAGAATAGGCTCCAAGGCATTTATACCATGCATTCAAC<br />
ATCCCACCCATCGAAAATAATATACCCAATAAGAACCGACCATCAGTTGATATCTTAATGCC<br />
AACGGTTATTGATGGTCAGGGACAATTATTGTGGGGGTTTCACTTAATGAACTATTCCTGGCA<br />
TCTGGTTC<br />
HAPLOTYPE O<br />
CTGCC_TTGAAAAGTT_GGATGTACAT_GTATGTATTAACACCATAAATTTATATTAACCATTA<br />
ATTCATAGTATTAAGTACATTTAGATATATAATCAACATACCATAATATACAACTATCAAGGA<br />
TTATACAACATTAAGGTATACATAACCCATTTATATATTAACACCAAACTAAAAGAATTTAAC<br />
CCAGGAAATCTTCATAACTCAATAAGAATAGGCTCCAAGGCATTTATACCATGCATTCAACA<br />
TCCCACCCATCGAAAATACTATACCCAATAAGAACCGACCATCAGTTGATATCTTAATGCCA<br />
ACGGTTATTGATGGTCAGGGACAATTATTGTGGGGGTTTCACTTAATGAACTATTCCTGGCAT<br />
CTGGTTC<br />
HAPLOTYPE P<br />
CTGCC_TTGAAAAGTTGGGATGTACAT_GTATGTATTAACACCATAAATTGATATTAACCATT<br />
AATTCATAGTATTAAGTACATTTAGATATATAATCAACATACCATAATATACAACTATCAAGA<br />
ATTATACAACATTAAGGTATACATAACCCATTTATATATTAACACCAAACTAAAAGAATTTAA<br />
CCCAGGAAATCTTCATAACTCAATAAGAATAGGCTCCAAGGCATTTATACCATGCATTCAAC<br />
ATCCCACCCATCGAAAATACTATACCCAATAAGAACCGACCATCAGTTGATATCTTAATGCC<br />
AACGGTTATTGATGGTCAGGGACAATTATTGTGGGGGTTTCACTTAATGAACTATTCCTGGCA<br />
TCTGGTTC
94<br />
HAPLOTYPE Q<br />
CCGAC_TTGAAAAGTTGGGATGTACAT_GTATGTATTAACACCATAAATTTATATTAACCATT<br />
AATTCATAGTATTAAGTACATTTAGATATATAATCAACATACCATAATATACAACTATCAAGG<br />
ATTATACAACATTAAGGTATACATAACCCATTTATATATTAACACCAAACTAAAAGAATTTAA<br />
CCCAGGAAATCTTCATAACTCAATAAGAATAGGCTCCAAGGCATTTATACCATGCATTCAAC<br />
ATCCCACCCATCGAAAATACTATACCCAATAAGAACCGACCATCAGTTGATATCTTAATGCC<br />
AACGGTTATTGATGGTCAGGGACAATTATTGTGGGGGTTTCACTTAATGAACTATTCCTGGCA<br />
TCTGGTTC<br />
HAPLOTYPE R<br />
CTGCCATTGAAAAGTTGGGATGTACAT_GTATGTATTAACACCATAAATTCATATTAACCATT<br />
AATTCATAGTATTAAGTACATTTAGATATATAATCA_CATACCATAATATACAACTATCAAGG<br />
ATTATACAACATTAAGGTATACATAACCCATTTATATATTAACACCAAACTAAAAGAATTTAA<br />
CCCAGGAAATCTTCATAACTCAATAAGAATAGGCTCCAAGGCATTTATACCATGCATTCAAC<br />
ATCCCACCCATCGAAAATACTATACCCAATAAGAACCGACCATCAGTTGATATCTTAATGCC<br />
AACGGTTATTGATGGTCAGGGACAATTATTGTGGGGGTTTCATTTAATGAACTATTCCTGGCA<br />
TCTGGTTC<br />
HAPLOTYPE S<br />
CTGCC_TTGAAAAGTTGGGATGTACAT_GTATGTATTAACACCATAAATAGATATTAACCATT<br />
AATTCATAGTATTAAATACATGTAGATATATAATCAACATACCATAATATACAACTATCAAG<br />
GATTATACAACATTAAGGGATACATAACCCATTTATATATTAACACCAAACTAAAAGAATT_A<br />
ACCCAGGAAATCTTCATAACTCAATAAGAATAGGCTCCAAGGCATTTATACCATGCATTCAA<br />
CATCCCACCCATCGAAAATACTATACCCAATAAGAACCGACCATCAGTTGATATCTTAATGCC<br />
AACGGTTATTGATGGTCAGGGACAATTATTGTGGGGGTTTCATTTAATGAACTATTCCTGGCA<br />
TCTGGTCT<br />
HAPLOTYPE T<br />
CTGCC_TTTAAAAGTT_GGATGTACAT_GTATGTATTAACACCATAAATTTATATTAACCATTA<br />
ATTCATAGTATTAAATACATTTAGATATATAATCAACATACCATAATATACAACTATCAAGGA<br />
TTATACAACATTAAGGTATACATAACCCATTTATATATTAACACCAAACTAAAAGAATTTAAC<br />
CCAGGAAATCTTCATAACTCAATAAGAATAGGCTCCAAGGCATTTATACCATGCATTCAACA<br />
TCCCACCCATCGAAAATACTATACCCAATAAGAACCGACCATCAGTTGATATCTTAATGCCA<br />
ACGGTTATTGATGGTCAGGGACAATTATTGTGGGGGTTTCATTTAATGAACTATTCCTGGCAT<br />
CTGGTTC<br />
HAPLOTYPE U<br />
CCGAC_TTGAAAAGTTGGGATGTACAT_GTATGTATTAACACCATAAATAGATATTAACCATT<br />
AATTCATAGTATTAAGTACATTTAGATATATAATCAACATACCATAATATACAACTATCAAGG<br />
ATTATACAACATTAAGGTATACATAACCCATTTATATATTAACACCAAACTAAAAGAATTTAA<br />
CCCAGGAAATCTTCATAACTCAATAAGAATAGGCTCCAAGGCATTTATACCATGCATTCAAC<br />
ATCCCACCCATCGAAAATACTATACCCAATAAGAACCGACCATCAGTTGATATCTTAATGCC<br />
AACGGTTATTGATGGTCAGGGACAATTATTGTGGGGGTTTCACTTAATGAACTATTCCTGGCA<br />
TCTGGTTC
95<br />
HAPLOTYPE V<br />
CTGCC_TTTAAAAGTT_GGATGTACAT_GTATGTATTAACACCATAAATTTATATTAACCATTA<br />
ATTCATAGTATTAAGTACATTTAGATATATAATCAACATACCATAATATACAACTATCAAGGA<br />
TTATACAACATTAAGGTATACATAACCCATTTATATATTAACACCAAACTAAAAGAATTTAAC<br />
CCAGGGAATCTTCATAACTCAATAAGAATAGGCTCCAAGGCATTTATACCATGCATTCAACA<br />
TCCCACCCATCGAAAATACTATACCCAATAAGAACCGACCATCAGTTGATATCTTAATGCCA<br />
ACGGTTATTGATGGTCAGGGACAATTATTGTGGGGGTTTCACTTAATGAACTATTCCTGGCAT<br />
CTGGTTC<br />
HAPLOTYPE W<br />
CTGCCATTGAAAAGTT_GGATGTACAT_GTATGTATTAACACCATAAATTTATATTAACCATTA<br />
ATTCATAGTATTAAGTACATTTAGATATATAATCAACATACCATAATATACAACTATCAAGGA<br />
TTATACAACATTAAGGTATACATAACCCATTTATATATTAACACCAAACTAAAAGAATTTAAC<br />
CCAGGAAATCTTCATAACACAATAAGAATAGGCTCCAAGGCATTTATACCATGCATTCAACA<br />
TCCCACCCATCGAAAATACTATACCCAATAAGAACCGACCATCAGTTGATATCTTAATGCCA<br />
ACGGTTATTGATGGTCAGGGACAATTATTGTGGGGGTTTCATTTAATGAACTATTCCTGGCAT<br />
CTGGTCT<br />
HAPLOTYPE X<br />
CTGCCATTGAAAAGTT_GGATGTACAT_GTATGTATTAACACCATAAATTTATATTAACCATTA<br />
ATTCATAGTATTAAGTACATTTAGATATATAATCAACATACCATAATATACAACTATCAAGGA<br />
TTATACAACATTAAGGTATACATAACCCATTTATATATTAACACCAAACTAAAAGAATTTAAC<br />
CCAGGAAATCTTCATAACTCAATAAGAATAGGCTCCAAGGCATTTATACCATGCATTCAACA<br />
TCCCACCCATCGAAAATACTATACCCAATAAGAACCGACCATCAGTTGATATCTTAATGCCA<br />
ACGGTTATTGATGGTCAGGGACAATTATTGTGGGGGTTTCATTTAATGAACTATTCCTGGCAT<br />
CTGGTTC<br />
HAPLOTYPE Y<br />
CTGCC_TTTAAAAGTT_GGATGTACAT_GTATGTATTAACACCATAAATTTATATTAACCATTA<br />
ATTCATAGTATTAAGTACATTTAGATATATAATCAACATACCATAATATACAACTATCAAGGA<br />
TTATACAACATTAAGGTATACATAACCCATTTATATATTAACACCAAACTAAAAGAATTTAAC<br />
CCAGGGAATCTTCATAACTCAATAAGAATAGGCTCCAAGGCATTTATACCATGCATTCAACA<br />
TCCCACCCATCGAAAATACTATACCCAATAAGAACCGACCATCAGTTGATATCTTAATGCCA<br />
ACGGTTATTGATGGTCAGGGACAATTATTGTGGGGGTTTCACTTAATGAACTATTCCTGGCAT<br />
CTGGTCT<br />
HAPLOTYPE Z<br />
CTACC_TTTAAAAGTT_GGATGTACAT_GTATGTATTAACACCATAAATTTATATTAACCATTA<br />
ATTCATAGTATTAAGTACATTTAGATATATAATCAACATACCATAATATACAACTATCAAGGA<br />
TTATACAACATTAAGGTATACATAACCCATTTATATATTAACACCAAACTAAAAGAATTTAAC<br />
CCAGGAAATCTTCATAACACAATAAGAATAGGCTCCAAGGCATTTATACCATGCATTCAACA<br />
TCCCACCCATCGAAAATACTATACCCAATAAGAACCGACCATCAGTTGATATCTTAATGCCA<br />
ACGGTTATTGATGGTCAGGGACAATTATTGTGGGGGTTTCATTTAATGAACTATTCCTGGCAT<br />
CTGGTCT<br />
HAPLOTYPE AA<br />
CTGCC_TTTAAAAGTT_GGATGTACAT_GTATGTATTAACACCATAAATTTATATTAACCATTA<br />
ATTCATAGTATTAAGTACATTTAGATATATAATCAACATACCATAATATACAACTATCAAGGA<br />
TTATACAACATTAAGGTATACATAACCCATTTATATATTAACACCAAACTAAAAGAATTTAAC<br />
CCAGGGAATCTTCATAACTCAATAAGAATAGGCTCCAAGGCATTTATACCATGCATTCAACA<br />
TCCCACCCATCCAAAATACTATACCCAATAAGAACCGACCATCAGTTGATATCTTAATGCCAA<br />
CGGTTATTGATGGTCAGGGACAATTATTGTGGGGGTTTCATTTAATGAACTATTCCTGGCATC<br />
TGGTCT
96<br />
HAPLOTYPE AB<br />
CTGCC_TTGAAAAGTT_GGATGTACAT_GTATGTATTAACACCATAAATTTATATTAACCATTA<br />
ATTCATAGTATTAAGTACATTTAGATATATAATCAACATACCATAATATACAACTATCAAGGA<br />
TTATACAACATTAAGGTATACATAACCCATTTATATATTAACACCAAACTAAAAGAATTTAAC<br />
CCAGGAAATCTTCATAACTCAATAAGAATAGGCTTCAAGGCATTTATACCATGCATTCAACAT<br />
CCCACCCATCGAAAATACTATACCCAATAAGAACCGACCATCAGTTGATATCTTAATGCCAA<br />
CGGTTATTGATGGTCAGGGACAATTATTGTGGGGGTTTCATTTAATGAACTATTCCTGGCATC<br />
TGGTTC<br />
HAPLOTYPE AC<br />
CTACC_TTGAAAAGTTGGGATGTACAT_GTATGTATTAACACCATAAATTGATATTAACCATT<br />
AATTCATAGTATTAAGTACATTTAGATATATAATCAACATACCATAATATACAACTATCAAGG<br />
ATTATACAACATTAAGGTATACATAACCCATTTATATATTAACACCAAACTAAAAGAATTTAA<br />
CCCAGGAAATCTTCTTAACAC_AATAAGAATAGGCTCCAAGGCATTTATACCATGCATTCAAC<br />
ATCCCACCCATCGAAAATACTATACCCAATAAGAACCGACCATCAGTTGATATCTTAATGCC<br />
AACGGTTATTGATGGTCAGGGACAATTATTGTGGGGGTTTCACTTAATGAACTATTCCTGGCA<br />
TCTGGTTC<br />
HAPLOTYPE AD<br />
CTGCC_TTGAAAAGTTGGGATGTACAT_GTATGTATTAACACCATAAATTGATATTAACCATT<br />
AATTCATAGTATTAAGTACATTTAGATATATAATCAACATACCATAATATACAACTATCAAGG<br />
ATTATACAACATTAAGGTGTACATAACCCATTTATATATTAACACCAAACTAAAAGAATTTAA<br />
CCCAGGAAATCTTCATAACTCAATAAGAATAGGCTCCAAGGCATTTATACCATGCATTCAAC<br />
ATCCCACCCATCGAAAATACTATACCCAATAAGAACCGACCATCAGTTGATATCTTAATGCC<br />
AACGGTTATTGATGGTCAGGGACAATTATTGTGGGGGTTTGACTTAATGAACTATTCCTGGCA<br />
TCTGGTTC