Alg. 2 Chapter 2.6 - Beau Chene High School Home Page
Alg. 2 Chapter 2.6 - Beau Chene High School Home Page
Alg. 2 Chapter 2.6 - Beau Chene High School Home Page

Create successful ePaper yourself
Turn your PDF publications into a flip-book with our unique Google optimized e-Paper software.
<strong>2.6</strong><br />
Linear Inequalities in Two<br />
Variables<br />
What you should learn<br />
GOAL 1 Graph linear<br />
inequalities in two variables.<br />
GOAL 2 Use linear<br />
inequalities to solve real-life<br />
problems, such as finding the<br />
number of minutes you can<br />
call relatives using a calling<br />
card in Example 4.<br />
Why you should learn it<br />
To model real-life data,<br />
such as blood pressures in<br />
your arm and ankle<br />
in Ex. 45.<br />
REAL<br />
LIFE<br />
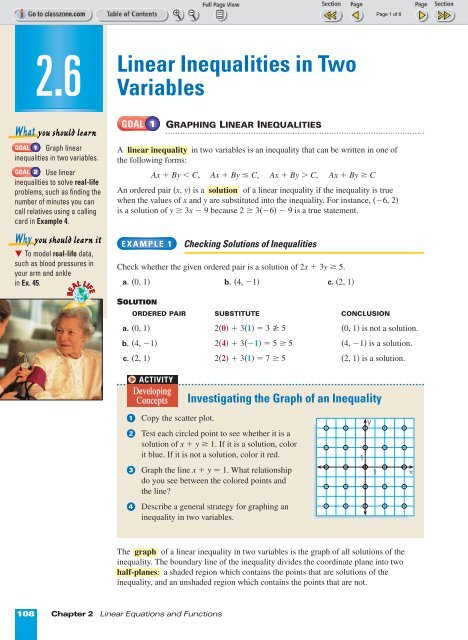
GOAL 1<br />
GRAPHING LINEAR INEQUALITIES<br />
A linear inequality in two variables is an inequality that can be written in one of<br />
the following forms:<br />
Ax + By < C, Ax + By ≤ C, Ax + By > C, Ax + By ≥ C<br />
An ordered pair (x, y) is a solution of a linear inequality if the inequality is true<br />
when the values of x and y are substituted into the inequality. For instance, (º6, 2)<br />
is a solution of y ≥ 3x º 9 because 2 ≥ 3(º6) º 9 is a true statement.<br />
EXAMPLE 1<br />
Checking Solutions of Inequalities<br />
Check whether the given ordered pair is a solution of 2x + 3y ≥ 5.<br />
a. (0, 1) b. (4, º1) c. (2, 1)<br />
SOLUTION<br />
ORDERED PAIR SUBSTITUTE CONCLUSION<br />
a. (0, 1) 2(0) + 3(1) = 3 /≥ 5 (0, 1) is not a solution.<br />
b. (4, º1) 2(4) + 3(º1) = 5 ≥ 5 (4, º1) is a solution.<br />
c. (2, 1) 2(2) + 3(1) = 7 ≥ 5 (2, 1) is a solution.<br />
ACTIVITY<br />
Developing<br />
Concepts<br />
Investigating the Graph of an Inequality<br />
1<br />
2<br />
3<br />
Copy the scatter plot.<br />
Test each circled point to see whether it is a<br />
solution of x + y ≥ 1. If it is a solution, color<br />
it blue. If it is not a solution, color it red.<br />
Graph the line x + y = 1. What relationship<br />
do you see between the colored points and<br />
the line?<br />
1<br />
y<br />
1<br />
x<br />
4<br />
Describe a general strategy for graphing an<br />
inequality in two variables.<br />
The graph of a linear inequality in two variables is the graph of all solutions of the<br />
inequality. The boundary line of the inequality divides the coordinate plane into two<br />
half-planes: a shaded region which contains the points that are solutions of the<br />
inequality, and an unshaded region which contains the points that are not.<br />
108 <strong>Chapter</strong> 2 Linear Equations and Functions
GRAPHING A LINEAR INEQUALITY<br />
The graph of a linear inequality in two variables is a half-plane. To graph a linear<br />
inequality, follow these steps:<br />
STEP 1 Graph the boundary line of the inequality. Use a dashed line for < or ><br />
and a solid line for ≤ or ≥.<br />
STEP 2 To decide which side of the boundary line to shade, test a point not on<br />
the boundary line to see whether it is a solution of the inequality. Then<br />
shade the appropriate half-plane.<br />
EXAMPLE 2<br />
Graphing Linear Inequalities in One Variable<br />
STUDENT HELP<br />
Look Back<br />
For help with inequalities<br />
in one variable, see p. 42.<br />
Graph (a) y < º2 and (b) x ≤ 1 in a coordinate plane.<br />
SOLUTION<br />
a. Graph the boundary line y = º2. b. Graph the boundary line x = 1.<br />
Use a dashed line because y < º2. Use a solid line because x ≤ 1.<br />
Test the point (0, 0). Because (0, 0) Test the point (0, 0). Because (0, 0)<br />
is not a solution of the inequality, is a solution of the inequality, shade<br />
shade the half-plane below the line. the half-plane to the left of the line.<br />
y<br />
y<br />
1 (0,0)<br />
1<br />
x<br />
x ≤ 1<br />
1<br />
(0,0)<br />
2<br />
x<br />
y < 2<br />
EXAMPLE 3<br />
Graphing Linear Inequalities in Two Variables<br />
STUDENT HELP<br />
Study Tip<br />
Because your test point<br />
must not be on the<br />
boundary line, you may<br />
not always be able to use<br />
(0, 0) as a convenient<br />
test point. In such cases<br />
test a different point,<br />
such as (1, 1) or (1, 0).<br />
Graph (a) y < 2x and (b) 2x º 5y ≥ 10.<br />
SOLUTION<br />
a. Graph the boundary line y = 2x. b. Graph the boundary line 2x º 5y = 10.<br />
Use a dashed line because y < 2x. Use a solid line because 2x º 5y ≥ 10.<br />
Test the point (1, 1). Because (1, 1)<br />
is a solution of the inequality,<br />
shade the half-plane below the line.<br />
1<br />
y<br />
1<br />
(1, 1)<br />
x<br />
Test the point (0, 0). Because (0, 0) is<br />
not a solution of the inequality, shade<br />
the half-plane below the line.<br />
y<br />
1<br />
(0, 0)<br />
1<br />
x<br />
y < 2x<br />
2x 5y ≥ 10<br />
<strong>2.6</strong> Linear Inequalities in Two Variables 109
GOAL 2<br />
USING LINEAR INEQUALITIES IN REAL LIFE<br />
REAL<br />
LIFE<br />
EXAMPLE 4<br />
Writing and Using a Linear Inequality<br />
Communication<br />
You have relatives living in both the United States and Mexico. You are given a<br />
prepaid phone card worth $50. Calls within the continental United States cost<br />
$.16 per minute and calls to Mexico cost $.44 per minute.<br />
a. Write a linear inequality in two variables to represent the number of minutes<br />
you can use for calls within the United States and for calls to Mexico.<br />
b. Graph the inequality and discuss three possible solutions in the context of the<br />
real-life situation.<br />
PROBLEM<br />
SOLVING<br />
STRATEGY<br />
SOLUTION<br />
a.<br />
VERBAL<br />
MODEL<br />
United States<br />
rate<br />
United States Mexico Mexico<br />
•<br />
time<br />
+<br />
rate<br />
•<br />
time<br />
≤<br />
Value of<br />
card<br />
LABELS<br />
ALGEBRAIC<br />
MODEL<br />
United States rate = 0.16<br />
United States time =<br />
Mexico rate = 0.44<br />
Mexico time =<br />
Value of card = 50<br />
0.16 x + 0.44 y ≤ 50<br />
y<br />
x<br />
(dollars per minute)<br />
(minutes)<br />
(dollars per minute)<br />
(minutes)<br />
(dollars)<br />
STUDENT HELP<br />
HOMEWORK HELP<br />
Visit our Web site<br />
www.mcdougallittell.com<br />
for extra examples.<br />
INTERNET<br />
b. Graph the boundary line 0.16x + 0.44y = 50. Use a solid line because<br />
0.16x + 0.44y ≤ 50.<br />
Test the point (0, 0). Because (0, 0) is a solution of the inequality, shade the<br />
half-plane below the line. Finally, because x and y cannot be negative, restrict<br />
the graph to points in the first quadrant.<br />
Possible solutions are points within the shaded region shown.<br />
Mexico time (min)<br />
Calling Cards<br />
y<br />
(65, 90)<br />
90<br />
(83, 83)<br />
60<br />
30<br />
(150, 30)<br />
0<br />
0 100 200 300 x<br />
United States time (min)<br />
One solution is to spend 65 minutes<br />
on calls within the United States and<br />
90 minutes on calls to Mexico. The<br />
total cost will be $50.<br />
To split the time evenly, you could<br />
spend 83 minutes on calls within the<br />
United States and 83 minutes on calls<br />
to Mexico. The total cost will be $49.80.<br />
You could instead spend 150 minutes<br />
on calls within the United States and<br />
only 30 minutes on calls to Mexico.<br />
The total cost will be $37.20.<br />
110 <strong>Chapter</strong> 2 Linear Equations and Functions
GUIDED PRACTICE<br />
Vocabulary Check ✓<br />
Concept Check ✓<br />
1. Compare the graph of a linear inequality with the graph of a linear equation.<br />
2. Would you use a dashed line or a solid line for the graph of Ax + By < C?<br />
for the graph of Ax + By ≤ C? Explain.<br />
Tell whether the statement is true or false. Explain.<br />
3. The point 4 3 , 0 is a solution of 3x º y > 4.<br />
Skill Check ✓<br />
4. The graph of y < 3x + 5 is the half-plane below the line y =3x + 5.<br />
GRAPHING INEQUALITIES Graph the inequality in a coordinate plane.<br />
5. x > 5 6. y < º4 7. 3x ≤ 1 8. ºy ≥ 3<br />
4 <br />
9. y ≥ ºx + 7 10. y > 2 x º 1 11. 2x º 3y < 6 12. x + 5y ≤ º10<br />
3<br />
13. CALLING CARDS Look back at Example 4. Suppose you have relatives living<br />
in China instead of Mexico. Calls to China cost $.75 per minute. Write and graph a<br />
linear inequality showing the number of minutes you can use for calls within the<br />
United States and for calls to China. Then discuss three possible solutions in the<br />
context of the real-life situation.<br />
PRACTICE AND APPLICATIONS<br />
STUDENT HELP<br />
Extra Practice<br />
to help you master<br />
skills is on p. 942.<br />
CHECKING SOLUTIONS Check whether the given ordered pairs are solutions<br />
of the inequality.<br />
14. x ≤ º5; (0, 2), (º5, 1) 15. 2y ≥ 7; (1, º6), (0, 4)<br />
16. y < º9x + 7; (º2, 2), (3, º8) 17. 19x + y ≥ º0.5; (2, 3), (º1, 0)<br />
STUDENT HELP<br />
HOMEWORK HELP<br />
Example 1: Exs. 14–17<br />
Example 2: Exs. 18–23,<br />
33–44<br />
Example 3: Exs. 24–44<br />
Example 4: Exs. 45–51<br />
INEQUALITIES IN ONE VARIABLE Graph the inequality in a coordinate plane.<br />
18. x ≤ 6 19. ºx ≥ 20 20. 10x ≥ 1 0 <br />
3<br />
21. º3y < 21 22. 8y > º4 23. y < 0.75<br />
MATCHING GRAPHS Match the inequality with its graph.<br />
24. 2x º y ≥ 4 25. º2x º y < 4 26. 2x + y ≤ 4<br />
A. y<br />
B. y<br />
C.<br />
y<br />
1<br />
1<br />
1 x<br />
1<br />
1<br />
1<br />
x<br />
INEQUALITIES IN TWO VARIABLES Graph the inequality.<br />
27. y ≤ 3x + 11 28. y > º4 º x 29. y < 0.75x º 5<br />
30. 3x + 12y > 4 31. 9x º 9y > º36 32. 3 2 x + 2 3 y > 1<br />
x<br />
<strong>2.6</strong> Linear Inequalities in Two Variables 111
MATCHING GRAPHS Match the inequality with its graph.<br />
33. x + y > 2 34. x ≥ 2 35. y ≤ ºx + 2<br />
A. y<br />
B. y<br />
C. y<br />
1<br />
1<br />
1<br />
1<br />
x<br />
1<br />
x<br />
1<br />
x<br />
GRAPHING INEQUALITIES Graph the inequality in a coordinate plane.<br />
36. 9x º 2y ≤ º18 37. y < 3x º 3 38. 5x > º20<br />
4<br />
39. y ≥ 1 x + 10 40. 4y ≤ º6 41. 2x + 3y > 4<br />
5<br />
42. 6x ≥ º 1 y 43. 0.25x + 3y > 19 44. x + y < 0<br />
3<br />
45. HEALTH RISKS By comparing the blood pressure in your ankle with the<br />
blood pressure in your arm, a physician can determine whether your arteries are<br />
becoming clogged with plaque. If the blood pressure in your ankle is less than<br />
90% of the blood pressure in your arm, you may be at risk for heart disease.<br />
Write and graph an inequality that relates the unacceptable blood pressure in<br />
your ankle to the blood pressure in your arm.<br />
NUTRITIONISTS<br />
A nutritionist plans<br />
nutrition programs and<br />
promotes healthy eating<br />
habits. Over one half of<br />
all nutritionists work in<br />
hospitals, nursing homes,<br />
or physician’s offices.<br />
CAREER LINK<br />
www.mcdougallittell.com<br />
REAL<br />
INTERNET<br />
LIFE<br />
FOCUS ON<br />
CAREERS<br />
NUTRITION In Exercises 46 and 47, use the following information.<br />
Teenagers should consume at least 1200 milligrams of calcium per day. Suppose you<br />
get calcium from two different sources, skim milk and cheddar cheese. One cup of<br />
skim milk supplies 296 milligrams of calcium, and one slice of cheddar cheese<br />
supplies 338 milligrams of calcium. Source: Nutrition in Exercise and Sport<br />
46. Write and graph an inequality that represents the amounts of skim milk and<br />
cheddar cheese you need to consume to meet your daily requirement of calcium.<br />
47. Determine how many cups of skim milk you should drink if you have eaten two<br />
slices of cheddar cheese.<br />
MOVIES In Exercises 48 and 49, use the following information.<br />
You receive a gift certificate for $25 to your local movie theater. Matinees are $4.50<br />
each and evening shows are $7.50 each.<br />
48. Write and graph an inequality that represents the numbers of matinees and<br />
evening shows you can attend.<br />
49. Give three possible combinations of the numbers of matinees and evening shows<br />
you can attend.<br />
FOOTBALL In Exercises 50 and 51, use the following information.<br />
In one of its first five games of a season, a football team scored a school record of<br />
63 points. In all of the first five games, points came from touchdowns worth 7 points<br />
and field goals worth 3 points.<br />
50. Write and graph an inequality that represents the numbers of touchdowns and<br />
field goals the team could have scored in any of the first five games.<br />
51. Give five possible numbers of points scored, including the number of<br />
touchdowns and the number of field goals, for the first five games.<br />
112 <strong>Chapter</strong> 2 Linear Equations and Functions
Test<br />
Preparation<br />
★ Challenge<br />
EXTRA CHALLENGE<br />
www.mcdougallittell.com<br />
52. MULTI-STEP PROBLEM You want to open your own truck rental company. You<br />
do some research and find that the majority of truck rental companies in your<br />
area charge a flat fee of $29.99, plus $.29 for every mile driven. You want to<br />
charge less so that you can advertise your lower rate and get more business.<br />
a. Write and graph an equation for the cost of renting a truck from other truck<br />
rental companies.<br />
b. Shade the region of the coordinate plane where the amount you will charge<br />
must fall.<br />
c. To charge less than your competitors, will you offer a lower flat fee, a lower<br />
rate per mile, or both? Explain your choice.<br />
d. Write and graph an equation for the cost of renting a truck from your<br />
company in the same coordinate plane used in part (a).<br />
e. CRITICAL THINKING Why can’t you offer a lower rate per mile but a higher<br />
flat fee and still always charge less?<br />
VISUAL THINKING In Exercises 53–55, use<br />
the graph shown.<br />
53. Write the inequality whose graph is shown.<br />
54. Explain how you came up with the<br />
inequality.<br />
55. What real-life situation could the first–<br />
quadrant portion of the graph represent?<br />
1<br />
y<br />
1<br />
x<br />
MIXED REVIEW<br />
SCIENTIFIC NOTATION Write the number in scientific notation. (Skills Review, p. 913)<br />
56. 10,000,000 57. 1,650,000,000 58. 203,000<br />
59. 0.00067 60. 0.0000009 61. 0.0808<br />
GRAPHING EQUATIONS Graph the equation. (Review 2.3 for 2.7)<br />
62. y = 5 2 x º 5 63. y = º5x º 1 64. y = º1 2 x + 6<br />
65. x º y = 4 66. 2x + y = 6 67. º4x + y = 4<br />
WRITING EQUATIONS Write an equation of the line that passes through the<br />
given points. (Review 2.4 for 2.7)<br />
68. (2, 2), (5, 5) 69. (0, 7), (5, 1) 70. (º1, 6), (8, º2)<br />
71. (3, 2), (3, º4) 72. (1, 9), (º10, º6) 73. (4, º8), (º7, º8)<br />
74. GARDENING The horizontal middle of the United States is at about 40°N<br />
latitude. As a rule of thumb, plants will bloom earlier south of 40°N latitude<br />
and later north of 40°N latitude. The function w = 3 (l º 40) gives the number<br />
5<br />
of weeks w (earlier or later) that plants at latitude l°N will bloom compared with<br />
those at 40°N. The equation is valid from 35°N to 45°N latitude. Identify the<br />
domain and range of the function and then graph the function. (Review 2.1)<br />
<strong>2.6</strong> Linear Inequalities in Two Variables 113