Product Excellence and Global Expansion - Hitachi Koki Co., Ltd.
Product Excellence and Global Expansion - Hitachi Koki Co., Ltd.
Product Excellence and Global Expansion - Hitachi Koki Co., Ltd.

You also want an ePaper? Increase the reach of your titles
YUMPU automatically turns print PDFs into web optimized ePapers that Google loves.
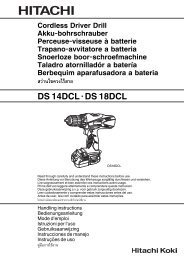
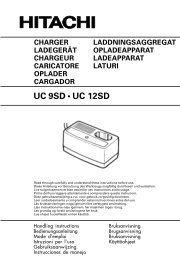
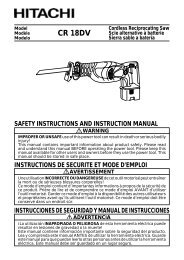
Net Sales (left scale)<br />
Overseas Sales Ratio (right scale)<br />
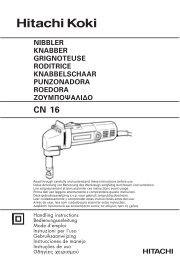
Net Sales/Overseas Sales Ratio<br />
Annual Dividends per Share<br />
(Billions of yen) (%)<br />
200<br />
80<br />
69.1<br />
Annual Dividends per Share<br />
150<br />
(Yen)<br />
50<br />
100<br />
Total 40 Assets/ROA<br />
50<br />
(Billions of yen)<br />
200 30<br />
20<br />
0<br />
150<br />
10<br />
100<br />
0<br />
50<br />
0<br />
(Billions of yen)<br />
200<br />
150<br />
100<br />
Assets, Net Assets/ROE<br />
Liabilities <strong>and</strong> Net Assets<br />
20<br />
• Assets 150 30<br />
24.0<br />
0<br />
Total<br />
0<br />
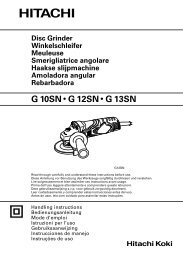
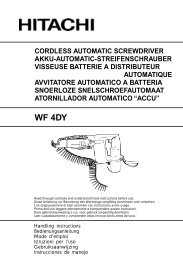
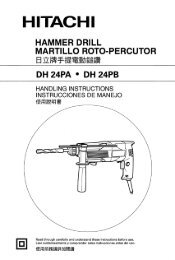
assets at the end of fiscal 2009 were ¥148,982 million, a decrease of<br />
2006 2007 2008 2009 148.9 2010<br />
2006 2007 2008 2009112.1<br />
2010<br />
15<br />
¥3,571 million from the end of the previous fiscal year. Current assets were<br />
Net Sales (left scale)<br />
100 20<br />
Overseas Sales Ratio (right scale)<br />
¥114,924 million of the total, a decrease of ¥1,501 million from a year earlier,<br />
10<br />
mainly due to a decrease of ¥8,309 million in inventories resulting from<br />
2006 2007 2008 2009 2010<br />
aggressive inventory reduction policies, despite an increase in deposits.<br />
2006 2007 2008 2009 2010<br />
Capital Expenditures<br />
20<br />
(%)<br />
100 50<br />
20 5<br />
(Billions of yen)<br />
5<br />
2.2<br />
0<br />
0<br />
4 2006 2007 2008 2009 2010<br />
50 10<br />
Total Assets (left scale)<br />
3 ROA (right scale)<br />
3.0<br />
2.1<br />
0 2<br />
0<br />
1<br />
Total Assets (left scale)<br />
ROA (right scale)<br />
Total Assets/ROA<br />
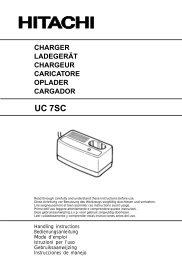
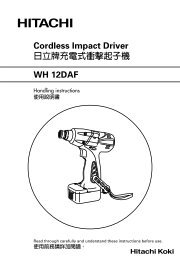
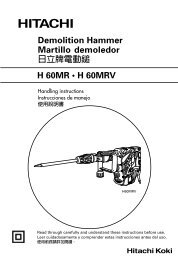
Net Assets/ROE<br />
119.1<br />
2.2<br />
60<br />
40<br />
5<br />
0<br />
(%)<br />
(Billions of yen) (%)<br />
150 30<br />
2006 2007 2008 2009 2010<br />
Net Assets (left scale)<br />
ROE (right scale)<br />
(Yen)<br />
50<br />
40<br />
30<br />
20<br />
(Billions 10 of yen) (%)<br />
50 10<br />
• Liabilities<br />
3.0<br />
Total liabilities at the fiscal year end were ¥36,841 million, a decrease of<br />
0 0<br />
¥3,436 2006 million 2007 from 2008 a year 2009 earlier. 2010<br />
This decrease was mainly due to decreases in<br />
Net (left scale)<br />
Net notes Assets/ROE<br />
<strong>and</strong> accounts payable, trade, resulting from production adjustments.<br />
ROE (right scale)<br />
(Billions of yen) (%)<br />
• Net Assets<br />
20<br />
150 30<br />
Total net assets at the fiscal year end were ¥112,141 million, a decrease of<br />
148.9<br />
¥134 million from a year earlier. 112.1<br />
15<br />
This decrease was mainly due to the change<br />
100 20<br />
in foreign currency translation adjustments resulting from the impact of the<br />
10<br />
strong yen, despite an increase in retained earnings.<br />
112.1<br />
50 10<br />
Capital Expenditures<br />
24.0<br />
3.0<br />
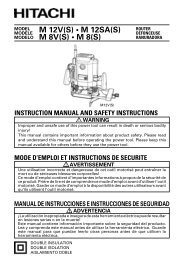
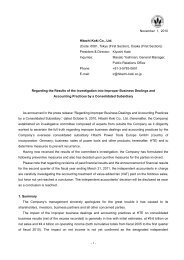
Capital expenditures in fiscal 2009 totaled ¥2,178 million as <strong>Hitachi</strong> <strong>Koki</strong> promoted<br />
0 0<br />
2006 2007 2008 2009 2010<br />
rationalization of strictly selected manufacturing facilities including enhancements to<br />
Net Assets (left scale)<br />
manufacturing ROE management (right scale) systems where it deemed it necessary.<br />
Main expenditures included rationalizing manufacturing facilities at the Sawa Plant,<br />
as well as augmenting or renewing manufacturing facilities <strong>and</strong> strengthening<br />
functions of the production management system at overseas plants.<br />
<br />
<br />
0<br />
2006 2007 2008 2009 2010<br />
Capital Expenditures<br />
(Billions of yen)<br />
5<br />
4<br />
3<br />
2<br />
1<br />
0<br />
2.1<br />
2006 2007 2008 2009 2010<br />
Risk Information<br />
Factors that could affect the operating results, share price <strong>and</strong> financial condition of<br />
the <strong>Hitachi</strong> <strong>Koki</strong> Group are listed below. Forward-looking statements below reflect the<br />
judgment of management as of March 31, 2010.<br />
(1) Economic <strong>Co</strong>nditions<br />
The <strong>Hitachi</strong> <strong>Koki</strong> Group sells products in Japan, North America, Europe, Asia <strong>and</strong><br />
other regions. To counter regional economic fluctuations, the Group plans measures<br />
including increasing manufacturing efficiency through cost-reduction activities <strong>and</strong><br />
establishing production bases in a number of regions. However, a reduction in dem<strong>and</strong><br />
stemming from worse-than-expected regional economic slowdown could negatively<br />
affect the Group’s businesses.<br />
(2) Interest Rate Fluctuations<br />
Although the <strong>Hitachi</strong> <strong>Koki</strong> Group is working to establish a business model that is<br />
unaffected by interest rate fluctuations, greater-than-expected interest rate fluctuations<br />
could affect the Group’s businesses because overseas sales make up a high<br />
proportion of total consolidated net sales. Usually, a high yen exchange rate exerts a<br />
12 <strong>Hitachi</strong> <strong>Koki</strong> ANNUAL REPORT 2010