The Hyde Group Annual Review 2009/10 - Hyde Housing Association
The Hyde Group Annual Review 2009/10 - Hyde Housing Association
The Hyde Group Annual Review 2009/10 - Hyde Housing Association

Create successful ePaper yourself
Turn your PDF publications into a flip-book with our unique Google optimized e-Paper software.
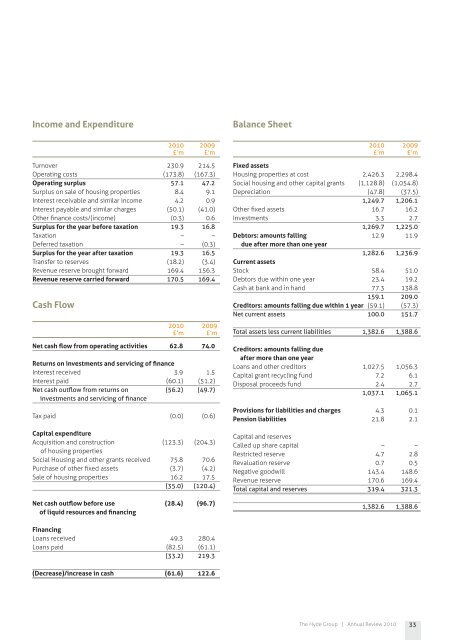
Income and Expenditure<br />
Balance Sheet<br />
Cash Flow<br />
20<strong>10</strong> <strong>2009</strong><br />
£’m £’m<br />
Turnover 230.9 214.5<br />
Operating costs (173.8) (167.3)<br />
Operating surplus 57.1 47.2<br />
Surplus on sale of housing properties 8.4 9.1<br />
Interest receivable and similar income 4.2 0.9<br />
Interest payable and similar charges (50.1) (41.0)<br />
Other finance costs/(income) (0.3) 0.6<br />
Surplus for the year before taxation 19.3 16.8<br />
Taxation – –<br />
Deferred taxation – (0.3)<br />
Surplus for the year after taxation 19.3 16.5<br />
Transfer to reserves (18.2) (3.4)<br />
Revenue reserve brought forward 169.4 156.3<br />
Revenue reserve carried forward 170.5 169.4<br />
20<strong>10</strong> <strong>2009</strong><br />
£’m £’m<br />
Net cash flow from operating activities 62.8 74.0<br />
Returns on investments and servicing of finance<br />
Interest received 3.9 1.5<br />
Interest paid (60.1) (51.2)<br />
Net cash outflow from returns on (56.2) (49.7)<br />
investments and servicing of finance<br />
Tax paid (0.0) (0.6)<br />
Capital expenditure<br />
Acquisition and construction (123.3) (204.3)<br />
of housing properties<br />
Social <strong>Housing</strong> and other grants received 75.8 70.6<br />
Purchase of other fixed assets (3.7) (4.2)<br />
Sale of housing properties 16.2 17.5<br />
(35.0) (120.4)<br />
Net cash outflow before use (28.4) (96.7)<br />
of liquid resources and financing<br />
20<strong>10</strong> <strong>2009</strong><br />
£’m £’m<br />
Fixed assets<br />
<strong>Housing</strong> properties at cost 2,426.3 2,298.4<br />
Social housing and other capital grants (1,128.8) (1,054.8)<br />
Depreciation (47.8) (37.5)<br />
1,249.7 1,206.1<br />
Other fixed assets 16.7 16.2<br />
Investments 3.3 2.7<br />
1,269.7 1,225.0<br />
Debtors: amounts falling 12.9 11.9<br />
due after more than one year<br />
1,282.6 1,236.9<br />
Current assets<br />
Stock 58.4 51.0<br />
Debtors due within one year 23.4 19.2<br />
Cash at bank and in hand 77.3 138.8<br />
159.1 209.0<br />
Creditors: amounts falling due within 1 year (59.1) (57.3)<br />
Net current assets <strong>10</strong>0.0 151.7<br />
Total assets less current liabilities 1,382.6 1,388.6<br />
Creditors: amounts falling due<br />
after more than one year<br />
Loans and other creditors 1,027.5 1,056.3<br />
Capital grant recycling fund 7.2 6.1<br />
Disposal proceeds fund 2.4 2.7<br />
1,037.1 1,065.1<br />
Provisions for liabilities and charges 4.3 0.1<br />
Pension liabilities 21.8 2.1<br />
Capital and reserves<br />
Called up share capital – –<br />
Restricted reserve 4.7 2.8<br />
Revaluation reserve 0.7 0.5<br />
Negative goodwill 143.4 148.6<br />
Revenue reserve 170.6 169.4<br />
Total capital and reserves 319.4 321.3<br />
1,382.6 1,388.6<br />
Financing<br />
Loans received 49.3 280.4<br />
Loans paid (82.5) (61.1)<br />
(33.2) 219.3<br />
(Decrease)/increase in cash (61.6) 122.6<br />
<strong>The</strong> <strong>Hyde</strong> <strong>Group</strong> | <strong>Annual</strong> <strong>Review</strong> 20<strong>10</strong><br />
33