87 kB pdf - DR CAJ Appelo -- HYDROCHEMICAL CONSULTANT
87 kB pdf - DR CAJ Appelo -- HYDROCHEMICAL CONSULTANT
87 kB pdf - DR CAJ Appelo -- HYDROCHEMICAL CONSULTANT

Create successful ePaper yourself
Turn your PDF publications into a flip-book with our unique Google optimized e-Paper software.
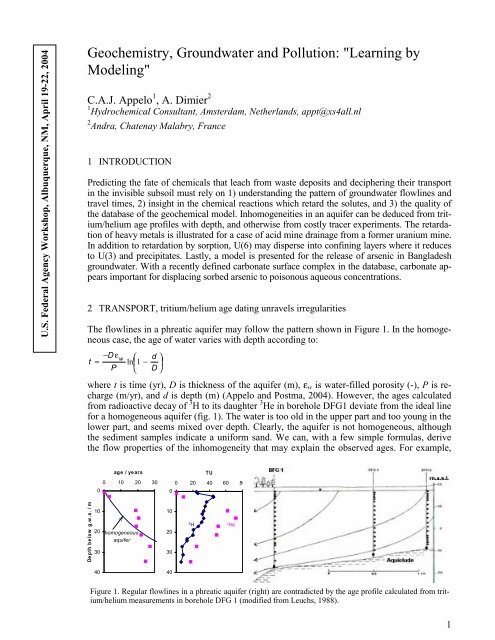
U.S. Federal Agency Workshop, Albuquerque, NM, April 19-22, 2004<br />
Geochemistry, Groundwater and Pollution: "Learning by<br />
Modeling"<br />
C.A.J. <strong>Appelo</strong> 1 , A. Dimier 2<br />
1 Hydrochemical Consultant, Amsterdam, Netherlands, appt@xs4all.nl<br />
2 Andra, Chatenay Malabry, France<br />
1 INTRODUCTION<br />
Predicting the fate of chemicals that leach from waste deposits and deciphering their transport<br />
in the invisible subsoil must rely on 1) understanding the pattern of groundwater flowlines and<br />
travel times, 2) insight in the chemical reactions which retard the solutes, and 3) the quality of<br />
the database of the geochemical model. Inhomogeneities in an aquifer can be deduced from tritium/helium<br />
age profiles with depth, and otherwise from costly tracer experiments. The retardation<br />
of heavy metals is illustrated for a case of acid mine drainage from a former uranium mine.<br />
In addition to retardation by sorption, U(6) may disperse into confining layers where it reduces<br />
to U(3) and precipitates. Lastly, a model is presented for the release of arsenic in Bangladesh<br />
groundwater. With a recently defined carbonate surface complex in the database, carbonate appears<br />
important for displacing sorbed arsenic to poisonous aqueous concentrations.<br />
2 TRANSPORT, tritium/helium age dating unravels irregularities<br />
The flowlines in a phreatic aquifer may follow the pattern shown in Figure 1. In the homogeneous<br />
case, the age of water varies with depth according to:<br />
−D<br />
εw<br />
t =<br />
P<br />
⎛<br />
ln ⎜1<br />
−<br />
⎝<br />
d<br />
D<br />
⎞<br />
⎟<br />
⎠<br />
where t is time (yr), D is thickness of the aquifer (m), ε w is water-filled porosity (-), P is recharge<br />
(m/yr), and d is depth (m) (<strong>Appelo</strong> and Postma, 2004). However, the ages calculated<br />
from radioactive decay of 3 H to its daughter 3 He in borehole DFG1 deviate from the ideal line<br />
for a homogeneous aquifer (fig. 1). The water is too old in the upper part and too young in the<br />
lower part, and seems mixed over depth. Clearly, the aquifer is not homogeneous, although<br />
the sediment samples indicate a uniform sand. We can, with a few simple formulas, derive<br />
the flow properties of the inhomogeneity that may explain the observed ages. For example,<br />
age / years<br />
0 10 20 30<br />
0<br />
TU<br />
0 20 40 60 80<br />
0<br />
Depth below g.w .s. / m<br />
10<br />
20<br />
30<br />
homogeneous<br />
aquifer<br />
10<br />
20<br />
30<br />
3<br />
H 3<br />
He<br />
40<br />
40<br />
Figure 1. Regular flowlines in a phreatic aquifer (right) are contradicted by the age profile calculated from tritium/helium<br />
measurements in borehole DFG 1 (modified from Leuchs, 1988).<br />
1
mixing over half of the depth in borehole DFG1 (about 18 m) requires a flowpath of L =<br />
(18/2) 2 / 2α = 810 m, for a (vertical) transversal dispersivity α = 0.05 m. We can also estimate<br />
that the zone upstream, where mixing takes place, has a permeability that is (D - z) / z<br />
larger than of the average sediment, z being the thickness of the permeable layer. These numbers<br />
are useful for initiating a hydrogeological model in which irregularities are tried out and<br />
distributed over the section to simulate the observed age pattern. However, an exact and detailed<br />
flowpattern requires a much denser net of boreholes.<br />
3 RETARDATION of U(6) and Zn from acid mine drainage<br />
After closure of the uranium mine at Königstein (G), the acid mine drainage will enter the<br />
aquifer above the mine and flow towards the Elbe river (Bain et al., 2001). We like to predict<br />
how quickly the heavy metals and uranium advance and whether they are retarded with respect<br />
to water flow, v i = vH 2O / R. Traditionally, retardation is calculated from R = 1 + q/c,<br />
q/ c U or q /c (-)<br />
10<br />
8<br />
6<br />
4<br />
2<br />
0<br />
-2<br />
-4<br />
2 4 6 8 10<br />
pH<br />
Figure 2. Distribution coefficients (q i /c i , dotted lines) and flushing<br />
factors ((∂q i / ∂c U ) i≠U , full lines) for Zn and U(6) in acid mine<br />
drainage as function of pH.<br />
mmol / L<br />
0.3<br />
0.2<br />
0.1<br />
0<br />
∂q U /∂c U<br />
q U /c U<br />
∂q Zn /∂c U<br />
SO 4<br />
2-<br />
/ 200<br />
Zn/10<br />
U(6)<br />
q Zn /c Zn<br />
2<br />
0 500 1000 1500 2000<br />
Distance / m<br />
pH<br />
Figure 3. Concentrations of SO 4 2- , Zn 2+ , U(6) and pH from acid<br />
mine drainage along a flowline calculated with PHREEQC-2.<br />
8<br />
7<br />
6<br />
5<br />
4<br />
3<br />
pH<br />
where q is sorbed and c is solute<br />
concentration (mol/L). However,<br />
for transport the flushing factors<br />
given by (∂q i / ∂c j ) i≠j should be<br />
considered (the slope of the isotherm<br />
if j = i), rather than the distribution<br />
coefficient K d = q/c.<br />
In the Königstein case the di s-<br />
tribution coefficients differ markedly<br />
from the flushing factors,<br />
shown for Zn and U(6) as function<br />
of pH in Figure 2. In the calculations,<br />
the mine water composition<br />
of Bain et al. was used and the<br />
WATEQ4F database of PHREEQC<br />
(Parkhurst and <strong>Appelo</strong>, 1999), with<br />
the exchange and surface complexation<br />
capacity set to X - = 50<br />
mM, Hfo_w = 2 mM and Hfo_s =<br />
0.05 mM.<br />
The distribution coefficient of<br />
Zn is determined by ion exchange<br />
at low pH, increases at intermediate<br />
pH's by sorption on ironoxyhydroxides,<br />
and dwindles again<br />
at high pH through aqueous complexation.<br />
The distribution coefficient<br />
of U(6) shows the same pattern<br />
but is zero at low pH since the<br />
element is not exchanged (at least<br />
not in the WATEQ4F database).<br />
The slope (∂q U / ∂c U ) i≠U is higher<br />
than K d , indicating a concave isotherm<br />
for U(6) (at a fixed pH).<br />
Consequently, the U(6) front will<br />
be sharpening when concentrations<br />
decrease. On the other hand, for Zn<br />
2
the slope (∂q Zn / ∂c U ) i≠U is negative in the pH range where U competes with Zn for sorption<br />
sites with an even stronger effect than of Zn itself.<br />
The calculated concentrations along a flowline (fig. 3) show almost conservative behavior<br />
for SO 4 2- and a retardation of 2.1 for Zn by ion exchange (the retardation is not affected by U in<br />
the low pH range, cf. Figure 2). The concentration of U shows an increase as if a heap of snow<br />
is pushed up in front of a snowplough. The typical shape is related to the pH variation at the<br />
front. Uranium is sorbed at neutral pH, but as the pH decreases to below 4 in the acid mine<br />
water, U is desorbed again, and the decreasing concentration gives a sharp front.<br />
A completely different picture is<br />
predicted for the aquifer, where<br />
the confining layers contain<br />
pyrite that reduces U(6) to U(3).<br />
The latter forms insoluble<br />
compounds which generates an<br />
infinite retardation for U. A<br />
rectangular cross-section of the<br />
aquifer, 50 * 2000 m above the<br />
Kˆnigstein mine was discretized<br />
in 40 * 100 cells for modeling<br />
Figure 4. Outline of the model aquifer. The reduced zone contains<br />
pyrite.<br />
with MT3D/PHREEQC (fig. 4).<br />
Acid mine water enters the<br />
section from the lower left corner<br />
and is accompanied by an equal<br />
flow of natural water from the upper left corner. The water leaves the section in the middle<br />
right. The lower right quarter, from the mine until the outflow cell contains pyrite.<br />
The solute concentrations of U indicate the loss towards the reduced zone where coffinite<br />
precipitates, while at the front the snowplough effect appears (fig. 5). The contact with pyrite is<br />
determined by the vertical dispersivity, here taken to be 1 m. Probably, the translation towards<br />
the reduced zone enriched the strata with uranium in the geological past.<br />
Figure 5. Modeled concentrations of U(6) in acid mine drainage entering an aquifer (left) and precipitation of<br />
USiO 4 (coffinite, right) at the border of the reduced zone. Calculated with Alliances, an MT3D/PHREEQC combination<br />
developed at Andra.<br />
3
4 DATABASE, modeling the source of As in groundwater<br />
The model results crucially depend on the<br />
validity of the chemical reactions and associated<br />
constants in the database. The surface<br />
1200<br />
9<br />
1000<br />
8 complex of HCO - 3 has been avoided by experimenters<br />
800<br />
600<br />
and was neglected in databases,<br />
pH FeOOH reduction<br />
7 but it is rather essential for modeling sorption<br />
variations of heavy metals in nature<br />
400<br />
As<br />
6<br />
since it is the dominant anion in groundwater<br />
and competes with other solutes for surface<br />
200<br />
5<br />
sites. The release of As in Bangladesh aquifers<br />
has been explained by the reductive dis-<br />
CO 2 production<br />
0<br />
4<br />
200 300 400 500 600 700 solution of iron-oxyhydroxide (Kinniburgh<br />
-<br />
mg HCO 3 / L<br />
and Smedley, 2001). However, if we consider<br />
a flowline that infiltrates in a soil<br />
-<br />
Figure 6. Increasing HCO 3 concentrations will desorb<br />
As from iron-oxyhydroxide (<strong>Appelo</strong> et al.,<br />
-<br />
where organic matter is oxidized aerobically,<br />
the HCO 3 concentration strongly increases<br />
2002).<br />
and it may displace As from ironoxyhydroxides<br />
which have sorbed the element<br />
from surface water, but at a much smaller HCO - 3 concentration (fig. 6). The figure<br />
shows that the increase of HCO - 3 by CO 2 production in the soil can be accompanied by increase<br />
of As to 600 ppb, far above the drinking water limit (cf. details in <strong>Appelo</strong> et al., 2002).<br />
In this case, the effect is only notable in the model calculations if the surface complexes of<br />
carbonate are included in the database.<br />
µg As / L<br />
p H<br />
REFERENCES<br />
Alliances, couplage chimie et transport avec MT3D/PHREEQC. Under development at Andra, France. Contact<br />
Alain.Dimier@Andra.fr.<br />
<strong>Appelo</strong>, C.A.J. and Postma, D., 2004. Geochemistry, groundwater and pollution, 2 nd ed. in prep.<br />
%TTIPS '%. :ER HIV ;IMHIR 1.. 8SYVREWWEX ' ERH 'LEVPIX 0 7YVJEGI GSQTPI\EXMSR SJ JIVVSYW MVSR ERH<br />
GEVFSREXI SR JIVVML]HVMXI ERH XLI QSFMPM^EXMSR SJ EVWIRMG )RZMVSR 7GM 8IGLRSP <br />
&EMR .+ 1E]IV /9 &PS[IW (; *VMRH )3 1SPWSR .;, /ELRX 6 ERH .IRO 9 1SHIPPMRK XLI GPS<br />
WYVIVIPEXIH KISGLIQMGEP IZSPYXMSR SJ KVSYRH[EXIV EX E JSVQIV YVERMYQ QMRI . 'SRXEQ ,]HVSP <br />
/MRRMFYVKL (+ ERH 7QIHPI] 40 )HW %VWIRMG GSRXEQMREXMSR SJ KVSYRH[EXIV MR &ERKPEHIWL &VMXMWL +IS<br />
PSKMGEP 7YVZI] 8IGLRMGEP 6ITSVX ;' :SPYQIW &VMXMWL +ISPSKMGEP 7YVZI] /I][SVXL<br />
Leuchs, W., 1988, Vorkommen, Abfolge und Auswirkungen anoxischer redoxreaktionen in einem pleistozanen<br />
Porengrundwasserleiter. Bes. Mitt. Deutsche Gewass. Jahrbuch Nr 52, D¸sseldorf, 106 p.<br />
Parkhurst, D.L. and <strong>Appelo</strong>, C.A.J., 1999. User's guide to PHREEQC (version 2)-a computer program for speciation,<br />
batch-reaction, one-dimesnional transport, and inverse geochemical calculations. USGS Water-resour.<br />
Inv. Rep. 99-4259.<br />
4