The morphological productivity of selected ... - Helda - Helsinki.fi
The morphological productivity of selected ... - Helda - Helsinki.fi
The morphological productivity of selected ... - Helda - Helsinki.fi

Create successful ePaper yourself
Turn your PDF publications into a flip-book with our unique Google optimized e-Paper software.
Not only vocabulary growth curves, but also frequency spectra<br />
provide a useful tool to assess the <strong>productivity</strong> <strong>of</strong> different word-formation<br />
processes. In particular, a frequency spectrum provides information on the<br />
distribution <strong>of</strong> the type frequencies <strong>of</strong> a given word-formation process, because<br />
productive ones tend to behave in a certain way in this respect, producing a<br />
skewed, rapidly decreasing plot. Even looking at the frequency spectra per se can<br />
reveal interesting facts, but it is even more useful to compare the observed values<br />
to the expected, average values. Again, this can be done with the ZipfR package<br />
<strong>of</strong> the R statistics s<strong>of</strong>tware. <strong>The</strong> actual formula to calculate the expected values for<br />
a frequency spectrum is explained by Baayen (2001: 92).<br />
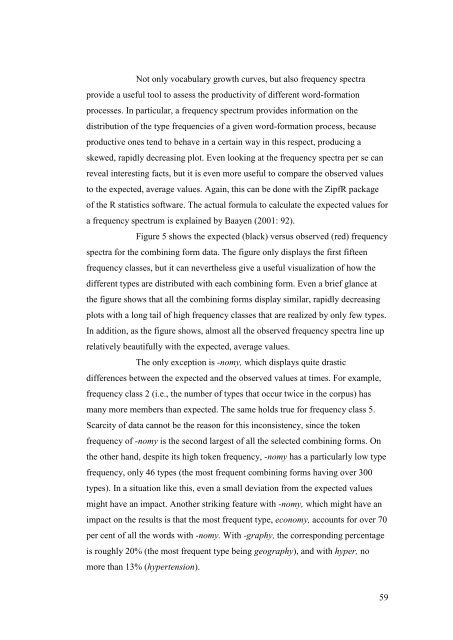
Figure 5 shows the expected (black) versus observed (red) frequency<br />
spectra for the combining form data. <strong>The</strong> <strong>fi</strong>gure only displays the <strong>fi</strong>rst <strong>fi</strong>fteen<br />
frequency classes, but it can nevertheless give a useful visualization <strong>of</strong> how the<br />
different types are distributed with each combining form. Even a brief glance at<br />
the <strong>fi</strong>gure shows that all the combining forms display similar, rapidly decreasing<br />
plots with a long tail <strong>of</strong> high frequency classes that are realized by only few types.<br />
In addition, as the <strong>fi</strong>gure shows, almost all the observed frequency spectra line up<br />
relatively beautifully with the expected, average values.<br />
<strong>The</strong> only exception is -nomy, which displays quite drastic<br />
differences between the expected and the observed values at times. For example,<br />
frequency class 2 (i.e., the number <strong>of</strong> types that occur twice in the corpus) has<br />
many more members than expected. <strong>The</strong> same holds true for frequency class 5.<br />
Scarcity <strong>of</strong> data cannot be the reason for this inconsistency, since the token<br />
frequency <strong>of</strong> -nomy is the second largest <strong>of</strong> all the <strong>selected</strong> combining forms. On<br />
the other hand, despite its high token frequency, -nomy has a particularly low type<br />
frequency, only 46 types (the most frequent combining forms having over 300<br />
types). In a situation like this, even a small deviation from the expected values<br />
might have an impact. Another striking feature with -nomy, which might have an<br />
impact on the results is that the most frequent type, economy, accounts for over 70<br />
per cent <strong>of</strong> all the words with -nomy. With -graphy, the corresponding percentage<br />
is roughly 20% (the most frequent type being geography), and with hyper, no<br />
more than 13% (hypertension).<br />
59