- Page 1 and 2: OFFICIAL RECORDS OF THE WORLD HEALT
- Page 3 and 4: CONTENTS Page Preface VII PART I -
- Page 5: European Region (continued) Page Ea
- Page 8 and 9: personnel are not indispensable. Th
- Page 11 and 12: CHAPTER 1 Two decades have passed s
- Page 13: CHAPTER 2 DEMOGRAPHY, MORTALITY, AN
- Page 17 and 18: DEMOGRAPHY, MORTALITY, AND MORBIDIT
- Page 19 and 20: DEMOGRAPHY, MORTALITY, AND MORBIDIT
- Page 21 and 22: DEMOGRAPHY, MORTALITY, AND MORBIDIT
- Page 23 and 24: DEMOGRAPHY, MORTALITY, AND MORBIDIT
- Page 25 and 26: DEMOGRAPHY, MORTALITY, AND MORBIDIT
- Page 27 and 28: CHAPTER 3 ECONOMIC DEVELOPMENT AND
- Page 29 and 30: ECONOMIC DEVELOPMENT AND THE HEALTH
- Page 31 and 32: CHAPTER 4 FACTORS INFLUENCING THE D
- Page 33 and 34: CHAPTER 5 The main organizational p
- Page 35 and 36: HEALTH ESTABLISHMENTS 27 TABLE 3. O
- Page 37 and 38: HEALTH ESTABLISHMENTS 29 Several co
- Page 39 and 40: HEALTH ESTABLISHMENTS 31 cases prov
- Page 41 and 42: FAMILY HEALTH 33 report on the worl
- Page 43 and 44: HEALTH PERSONNEL 35 duration of stu
- Page 45 and 46: HEALTH PERSONNEL 37 few thousand in
- Page 47 and 48: PROTECTION AND IMPROVEMENT OF THE E
- Page 49 and 50: Country or territory Central Africa
- Page 51 and 52: HEALTH PLANNING 43 and the local au
- Page 53 and 54: PUBLIC HEALTH AND MEDICAL RESEARCH
- Page 55 and 56: PUBLIC HEALTH AND MEDICAL RESEARCH
- Page 57 and 58: Part II REVIEW BY COUNTRY AND TERRI
- Page 59: AFRICAN RECTION
- Page 62 and 63: 54 FIFTH REPORT ON THE WORLD HEALTH
- Page 64 and 65:
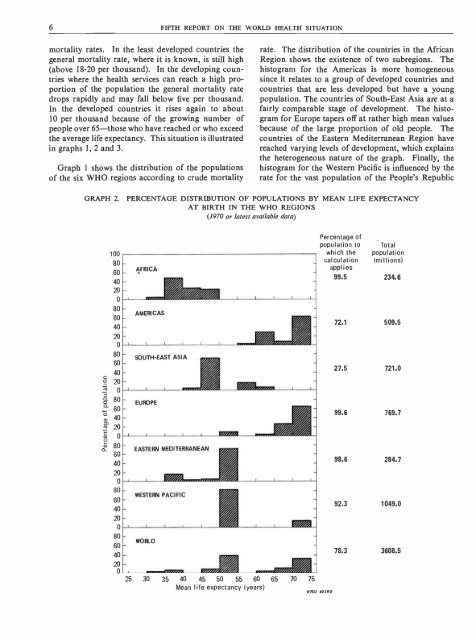
56 FIFTH REPORT ON THE WORLD HEALTH
- Page 66 and 67:
58 FIFTH REPORT ON THE WORLD HEALTH
- Page 68 and 69:
60 FIFTH REPORT ON THE WORLD HEALTH
- Page 70 and 71:
62 FIFTH REPORT ON THE WORLD HEALTH
- Page 72 and 73:
64 FIFTH REPORT ON THE WORLD HEALTH
- Page 74 and 75:
66 FIFTH REPORT ON THE WORLD HEALTH
- Page 76 and 77:
68 FIFTH REPORT ON THE WORLD HEALTH
- Page 78 and 79:
70 FIFTH REPORT ON THE WORLD HEALTH
- Page 80 and 81:
72 FIFTH REPORT ON THE WORLD HEALTH
- Page 83:
REGION OF THE AMERICAS
- Page 86 and 87:
78 FIFTH REPORT ON THE WORLD HEALTH
- Page 88 and 89:
80 FIFTH REPORT ON THE WORLD HEALTH
- Page 90 and 91:
82 FIFTH REPORT ON THE WORLD HEALTH
- Page 92 and 93:
84 FIFTH REPORT ON THE WORLD HEALTH
- Page 94 and 95:
86 FIFTH REPORT ON THE WORLD HEALTH
- Page 96 and 97:
88 FIFTH REPORT ON THE WORLD HEALTH
- Page 98 and 99:
90 FIFTH REPORT ON THE WORLD HEALTH
- Page 100 and 101:
92 FIFTH REPORT ON THE WORLD HEALTH
- Page 102 and 103:
94 FIFTH REPORT ON THE WORLD HEALTH
- Page 104 and 105:
96 FIFTH REPORT ON THE WORLD HEALTH
- Page 106 and 107:
98 FIFTH REPORT ON THE WORLD HEALTH
- Page 108 and 109:
100 FIFTH REPORT ON THE WORLD HEALT
- Page 110 and 111:
102 FIFTH REPORT ON THE WORLD HEALT
- Page 112 and 113:
104 FIFTH REPORT ON THE WORLD HEALT
- Page 114 and 115:
106 FIFTH REPORT ON THE WORLD HEALT
- Page 116 and 117:
108 FIFTH REPORT ON THE WORLD HEALT
- Page 118 and 119:
110 FIFTH REPORT ON THE WORLD HEALT
- Page 120 and 121:
112 FIFTH REPORT ON THE WORLD HEALT
- Page 122 and 123:
114 FIFTH REPORT ON THE WORLD HEALT
- Page 124 and 125:
116 FIFTH REPORT ON THE WORLD HEALT
- Page 126 and 127:
118 FIFTH REPORT ON THE WORLD HEALT
- Page 128 and 129:
120 FIFTH REPORT ON THE WORLD HEALT
- Page 130 and 131:
122 FIFTH REPORT ON THE WORLD HEALT
- Page 132 and 133:
124 FIFTH REPORT ON THE WORLD HEALT
- Page 134 and 135:
126 FIFTH REPORT ON THE WORLD HEALT
- Page 136 and 137:
128 FIFTH REPORT ON THE WORLD HEALT
- Page 138 and 139:
130 FIFTH REPORT ON THE WORLD HEALT
- Page 140 and 141:
132 FIFTH REPORT ON THE WORLD HEALT
- Page 142 and 143:
134 FIFTH REPORT ON THE WORLD HEALT
- Page 144 and 145:
136 FIFTH REPORT ON THE WORLD HEALT
- Page 146 and 147:
138 FIFTH REPORT ON THE WORLD HEALT
- Page 149 and 150:
INDIA Population and other statisti
- Page 151 and 152:
SOUTH -EAST ASIA REGION 143 Special
- Page 153 and 154:
SOUTH -EAST ASIA REGION 145 Physica
- Page 155 and 156:
SOUTH -EAST ASIA REGION 147 health.
- Page 157 and 158:
SOUTH-EAST ASIA REGION 149 improvem
- Page 159 and 160:
SOUTH -EAST ASIA REGION 151 filaria
- Page 161 and 162:
SOUTH -EAST ASIA REGION 153 centres
- Page 163:
SOUTH -EAST ASIA REGION 155 UNFPA:
- Page 167 and 168:
AUSTRIA Population and other statis
- Page 169 and 170:
EUROPEAN REGION 161 Poliomyelitis 7
- Page 171 and 172:
EUROPEAN REGION 163 The royal decre
- Page 173 and 174:
EUROPEAN REGION 165 BULGARIA Popula
- Page 175 and 176:
EUROPEAN REGION 167 Medical and pub
- Page 177 and 178:
EUROPEAN REGION 169 Dentists (unive
- Page 179 and 180:
EUROPEAN REGION 171 The 20 -year de
- Page 181 and 182:
EUROPEAN REGION 173 Expenditure on
- Page 183 and 184:
EUROPEAN REGION 175 Besides the var
- Page 185 and 186:
EUROPEAN REGION 177 Two new medical
- Page 187 and 188:
EUROPEAN REGION 179 FRANCE Populati
- Page 189 and 190:
EUROPEAN REGION 181 accounted for l
- Page 191 and 192:
EUROPEAN REGION 183 Government on t
- Page 193 and 194:
EUROPEAN REGION 185 result of impro
- Page 195 and 196:
EUROPEAN REGION 187 ing 3836 millio
- Page 197 and 198:
EUROPEAN REGION 189 The following p
- Page 199 and 200:
EUROPEAN REGION 191 expenditure and
- Page 201 and 202:
EUROPEAN REGION 193 special advisor
- Page 203 and 204:
EUROPEAN REGION 195 persons undergo
- Page 205 and 206:
EUROPEAN REGION 197 cases (27), pol
- Page 207 and 208:
EUROPEAN REGION 199 heart disease (
- Page 209 and 210:
EUROPEAN REGION 201 provincial comm
- Page 211 and 212:
EUROPEAN REGION 203 Medical researc
- Page 213 and 214:
EUROPEAN REGION 205 Category and ad
- Page 215 and 216:
EUROPEAN REGION 207 each of which h
- Page 217 and 218:
EUROPEAN REGION 209 ROMANIA Populat
- Page 219 and 220:
EUROPEAN REGION 211 Water and air p
- Page 221 and 222:
EUROPEAN REGION 213 better coordina
- Page 223 and 224:
EUROPEAN REGION 215 The bed /popula
- Page 225 and 226:
EUROPEAN REGION 217 million kronor
- Page 227 and 228:
EUROPEAN REGION 219 connected to wa
- Page 229 and 230:
EUROPEAN REGION 221 Category Durati
- Page 231 and 232:
EUROPEAN REGION 223 In the Union an
- Page 233 and 234:
EUROPEAN REGION 225 during the prec
- Page 235 and 236:
EUROPEAN REGION 227 Sanitary inspec
- Page 237 and 238:
EUROPEAN REGION 229 Category and ad
- Page 239 and 240:
EUROPEAN REGION 231 total of 28 654
- Page 241 and 242:
EUROPEAN REGION 233 absence from wo
- Page 243 and 244:
EUROPEAN REGION 235 Midwives 3 821
- Page 245:
EASTERN MEDITERRANEAN REGION
- Page 248 and 249:
240 FIFTH REPORT ON THE WORLD HEALT
- Page 250 and 251:
242 FIFTH REPORT ON THE WORLD HEALT
- Page 252 and 253:
244 FIFTH REPORT ON THE WORLD HEALT
- Page 254 and 255:
246 FIFTH REPORT ON THE WORLD HEALT
- Page 256 and 257:
248 FIFTH REPORT ON THE WORLD HEALT
- Page 258 and 259:
250 FIFTH REPORT ON THE WORLD HEALT
- Page 260 and 261:
252 FIFTH REPORT ON THE WORLD HEALT
- Page 262 and 263:
254 FIFTH REPORT ON THE WORLD HEALT
- Page 264 and 265:
256 FIFTH REPORT ON THE WORLD HEALT
- Page 266 and 267:
258 FIFTH REPORT ON THE WORLD HEALT
- Page 268 and 269:
260 FIFTH REPORT ON THE WORLD HEALT
- Page 270 and 271:
262 FIFTH REPORT ON THE WORLD HEALT
- Page 272 and 273:
264 FIFTH REPORT ON THE WORLD HEALT
- Page 274 and 275:
266 FIFTH REPORT ON THE WORLD HEALT
- Page 276 and 277:
268 FIFTH REPORT ON THE WORLD HEALT
- Page 278 and 279:
270 FIFTH REPORT ON THE WORLD HEALT
- Page 281:
WESTERN PACIFIC REGION
- Page 284 and 285:
276 FIFTH REPORT ON THE WORLD HEALT
- Page 286 and 287:
278 FIFTH REPORT ON THE WORLD HEALT
- Page 288 and 289:
280 FIFTH REPORT ON THE WORLD HEALT
- Page 290 and 291:
282 FIFTH REPORT ON THE WORLD HEALT
- Page 292 and 293:
284 FIFTH REPORT ON THE WORLD HEALT
- Page 294 and 295:
286 FIFTH REPORT ON THE WORLD HEALT
- Page 296 and 297:
288 FIFTH REPORT ON THE WORLD HEALT
- Page 298 and 299:
290 FIFTH REPORT ON THE WORLD HEALT
- Page 300 and 301:
292 FIFTH REPORT ON THE WORLD HEALT
- Page 302 and 303:
294 FIFTH REPORT ON THE WORLD HEALT
- Page 304 and 305:
296 FIFTH REPORT ON THE WORLD HEALT
- Page 306 and 307:
298 FIFTH REPORT ON THE WORLD HEALT
- Page 308 and 309:
300 FIFTH REPORT ON THE WORLD HEALT
- Page 310 and 311:
302 FIFTH REPORT ON THE WORLD HEALT
- Page 312 and 313:
304 FIFTH REPORT ON THE WORLD HEALT
- Page 314 and 315:
306 FIFTH REPORT ON THE WORLD HEALT
- Page 316 and 317:
308 FIFTH REPORT ON THE WORLD HEALT
- Page 318 and 319:
310 FIFTH REPORT ON THE WORLD HEALT
- Page 320 and 321:
312 FIFTH REPORT ON THE WORLD HEALT
- Page 322 and 323:
314 FIFTH REPORT ON THE WORLD HEALT
- Page 324 and 325:
316 FIFTH REPORT ON THE WORLD HEALT
- Page 327:
INDEX TO COUNTRIES AND TERRITORIES
- Page 330:
322 FIFTH REPORT ON THE WORLD HEALT