Characteristics of Internet Background Radiation - UNC Computer ...
Characteristics of Internet Background Radiation - UNC Computer ...
Characteristics of Internet Background Radiation - UNC Computer ...

Create successful ePaper yourself
Turn your PDF publications into a flip-book with our unique Google optimized e-Paper software.
state management at the forwarder. However, tunneling requires<br />
the receive end to a) decapsulate traces before analysis, b) handle<br />
fragmentation <strong>of</strong> full-MTU packets, and c) allocate a dedicated tunnel<br />
port. NAT, on the other hand, does not have these three issues,<br />
but necessitates maintaining per-flow state at the forwarder, which<br />
can be significant in large networks. The stateless responder deployed<br />
at the UW site allows such state to be ephemeral, which<br />
makes the approach feasible. That is we only need to maintain a<br />
consistent flow ID for each outstanding incoming packet, so the<br />
corresponding flow record at the filter can be evicted as soon as it<br />
sees a response. Hence, the lifetime <strong>of</strong> flow records is on the order<br />
<strong>of</strong> milliseconds (RTT between the forwarder and active-sink)<br />
instead <strong>of</strong> seconds.<br />
4. PASSIVE MEASUREMENT OF BACK-<br />
GROUND RADIATION<br />
This section presents a baseline <strong>of</strong> background radiation traffic<br />
on unused IP addresses without actively responding to any packet.<br />
It starts with a traffic breakdown by protocols and ports, and then<br />
takes a close look at one particular facet <strong>of</strong> the traffic: backscatter.<br />
4.1 Traffic Composition<br />
A likely first question about background radiation characteristics<br />
is “What is the type and volume <strong>of</strong> observed traffic?”. We start to<br />
answer this question by looking at two snapshots <strong>of</strong> background<br />
radiation traffic shown in Table 2 which includes an 80 hour trace<br />
collected at UW Campus on a /19 network from May 1 to May 4,<br />
a one week trace at LBL collected on 10 contiguous /24 networks<br />
from April 28 to May 5, and finally a one-week trace at Class A<br />
with 1/10 sampling from March 11 to 18.<br />
Protocol UW-1 LBL-P Class A<br />
Rate % Rate % Rate %<br />
TCP 928 95.0% 664 56.5% 130 88.5%<br />
ICMP 4.00 4.2% 488 39.6% 0.376 0.3%<br />
UDP 0.156 0.8% 45.2 3.8% 16.5 11.3%<br />
Table 2: Traffic rate breakdown by protocols. The rate is computed<br />
as number <strong>of</strong> packets per destination IP address per day,<br />
i.e., with network size and sampling rate normalized<br />
Clearly, TCP dominates more or less in all three networks. The<br />
relatively lower TCP rate at Class A is partly due to the artifact<br />
that the Class A trace was collected in Mar instead in May, when<br />
we see a few large worm/malware outbreaks (include the Sasser<br />
worm). Not shown in the table, about 99% <strong>of</strong> the observed TCP<br />
packets are TCP/SYN.<br />
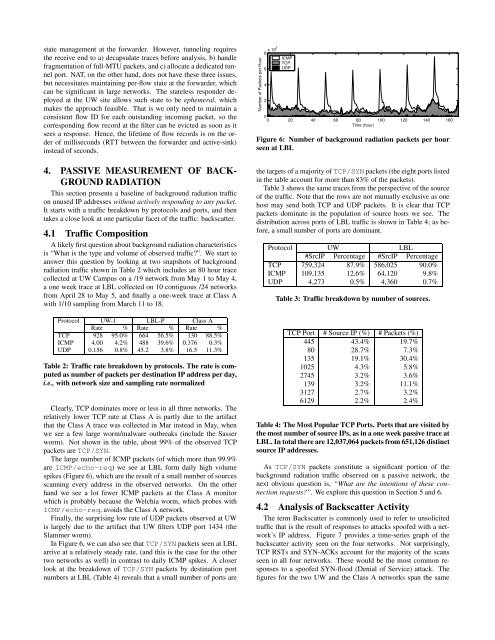
The large number <strong>of</strong> ICMP packets (<strong>of</strong> which more than 99.9%<br />
are ICMP/echo-req) we see at LBL form daily high volume<br />
spikes (Figure 6), which are the result <strong>of</strong> a small number <strong>of</strong> sources<br />
scanning every address in the observed networks. On the other<br />
hand we see a lot fewer ICMP packets at the Class A monitor<br />
which is probably because the Welchia worm, which probes with<br />
ICMP/echo-req, avoids the Class A network.<br />
Finally, the surprising low rate <strong>of</strong> UDP packets observed at UW<br />
is largely due to the artifact that UW filters UDP port 1434 (the<br />
Slammer worm).<br />
In Figure 6, we can also see that TCP/SYN packets seen at LBL<br />
arrive at a relatively steady rate, (and this is the case for the other<br />
two networks as well) in contrast to daily ICMP spikes. A closer<br />
look at the breakdown <strong>of</strong> TCP/SYN packets by destination port<br />
numbers at LBL (Table 4) reveals that a small number <strong>of</strong> ports are<br />
Number <strong>of</strong> Packets per Hour<br />
ICMP<br />
TCP<br />
6 UDP<br />
4<br />
2<br />
0<br />
0 20 40 60 80 100 120 140 160<br />
8 x 10⁵ Time (hour)<br />
Figure 6: Number <strong>of</strong> background radiation packets per hour<br />
seen at LBL<br />
the targets <strong>of</strong> a majority <strong>of</strong> TCP/SYN packets (the eight ports listed<br />
in the table account for more than 83% <strong>of</strong> the packets).<br />
Table 3 shows the same traces from the perspective <strong>of</strong> the source<br />
<strong>of</strong> the traffic. Note that the rows are not mutually exclusive as one<br />
host may send both TCP and UDP packets. It is clear that TCP<br />
packets dominate in the population <strong>of</strong> source hosts we see. The<br />
distribution across ports <strong>of</strong> LBL traffic is shown in Table 4; as before,<br />
a small number <strong>of</strong> ports are dominant.<br />
Protocol UW LBL<br />
#SrcIP Percentage #SrcIP Percentage<br />
TCP 759,324 87.9% 586,025 90.0%<br />
ICMP 109,135 12.6% 64,120 9.8%<br />
UDP 4,273 0.5% 4,360 0.7%<br />
Table 3: Traffic breakdown by number <strong>of</strong> sources.<br />
TCP Port # Source IP (%) # Packets (%)<br />
445 43.4% 19.7%<br />
80 28.7% 7.3%<br />
135 19.1% 30.4%<br />
1025 4.3% 5.8%<br />
2745 3.2% 3.6%<br />
139 3.2% 11.1%<br />
3127 2.7% 3.2%<br />
6129 2.2% 2.4%<br />
Table 4: The Most Popular TCP Ports. Ports that are visited by<br />
the most number <strong>of</strong> source IPs, as in a one week passive trace at<br />
LBL. In total there are 12,037,064 packets from 651,126 distinct<br />
source IP addresses.<br />
As TCP/SYN packets constitute a significant portion <strong>of</strong> the<br />
background radiation traffic observed on a passive network, the<br />
next obvious question is, “What are the intentions <strong>of</strong> these connection<br />
requests?”. We explore this question in Section 5 and 6.<br />
4.2 Analysis <strong>of</strong> Backscatter Activity<br />
The term Backscatter is commonly used to refer to unsolicited<br />
traffic that is the result <strong>of</strong> responses to attacks spo<strong>of</strong>ed with a network’s<br />
IP address. Figure 7 provides a time-series graph <strong>of</strong> the<br />
backscatter activity seen on the four networks. Not surprisingly,<br />
TCP RSTs and SYN-ACKs account for the majority <strong>of</strong> the scans<br />
seen in all four networks. These would be the most common responses<br />
to a spo<strong>of</strong>ed SYN-flood (Denial <strong>of</strong> Service) attack. The<br />
figures for the two UW and the Class A networks span the same