Characteristics of Internet Background Radiation - UNC Computer ...
Characteristics of Internet Background Radiation - UNC Computer ...
Characteristics of Internet Background Radiation - UNC Computer ...

You also want an ePaper? Increase the reach of your titles
YUMPU automatically turns print PDFs into web optimized ePapers that Google loves.
¡<br />
¢<br />
£<br />
<strong>Characteristics</strong> <strong>of</strong> <strong>Internet</strong> <strong>Background</strong> <strong>Radiation</strong><br />
¡<br />
Ruoming Pang Vinod Yegneswaran<br />
rpang@cs.princeton.edu<br />
vinod@cs.wisc.edu<br />
¡ ¢¤£ Paul Barford Vern Paxson Larry Peterson<br />
pb@cs.wisc.edu vern@icir.org llp@cs.princeton.edu<br />
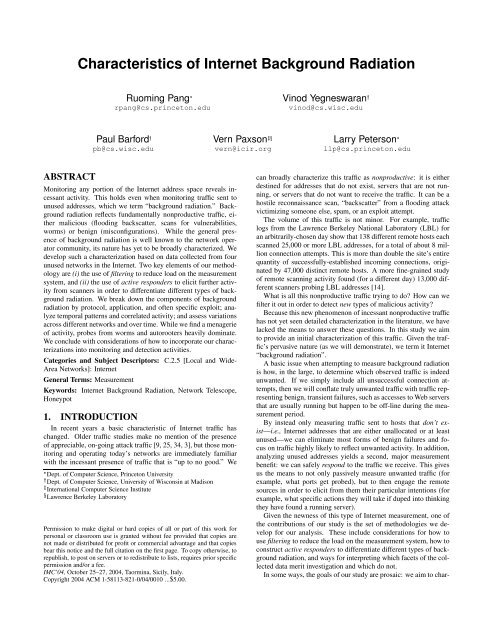
ABSTRACT<br />
Monitoring any portion <strong>of</strong> the <strong>Internet</strong> address space reveals incessant<br />
activity. This holds even when monitoring traffic sent to<br />
unused addresses, which we term “background radiation.” <strong>Background</strong><br />
radiation reflects fundamentally nonproductive traffic, either<br />
malicious (flooding backscatter, scans for vulnerabilities,<br />
worms) or benign (misconfigurations). While the general presence<br />
<strong>of</strong> background radiation is well known to the network operator<br />
community, its nature has yet to be broadly characterized. We<br />
develop such a characterization based on data collected from four<br />
unused networks in the <strong>Internet</strong>. Two key elements <strong>of</strong> our methodology<br />
are (i) the use <strong>of</strong> filtering to reduce load on the measurement<br />
system, and (ii) the use <strong>of</strong> active responders to elicit further activity<br />
from scanners in order to differentiate different types <strong>of</strong> background<br />
radiation. We break down the components <strong>of</strong> background<br />
radiation by protocol, application, and <strong>of</strong>ten specific exploit; analyze<br />
temporal patterns and correlated activity; and assess variations<br />
across different networks and over time. While we find a menagerie<br />
<strong>of</strong> activity, probes from worms and autorooters heavily dominate.<br />
We conclude with considerations <strong>of</strong> how to incorporate our characterizations<br />
into monitoring and detection activities.<br />
Categories and Subject Descriptors: C.2.5 [Local and Wide-<br />
Area Networks]: <strong>Internet</strong><br />
General Terms: Measurement<br />
Keywords: <strong>Internet</strong> <strong>Background</strong> <strong>Radiation</strong>, Network Telescope,<br />
Honeypot<br />
1. INTRODUCTION<br />
In recent years a basic characteristic <strong>of</strong> <strong>Internet</strong> traffic has<br />
changed. Older traffic studies make no mention <strong>of</strong> the presence<br />
<strong>of</strong> appreciable, on-going attack traffic [9, 25, 34, 3], but those monitoring<br />
and operating today’s networks are immediately familiar<br />
with the incessant presence <strong>of</strong> traffic that is “up to no good.” We<br />
Dept. <strong>of</strong> <strong>Computer</strong> Science, Princeton University<br />
Dept. <strong>of</strong> <strong>Computer</strong> Science, University <strong>of</strong> Wisconsin at Madison<br />
International <strong>Computer</strong> Science Institute<br />
Lawrence Berkeley Laboratory<br />
Permission to make digital or hard copies <strong>of</strong> all or part <strong>of</strong> this work for<br />
personal or classroom use is granted without fee provided that copies are<br />
not made or distributed for pr<strong>of</strong>it or commercial advantage and that copies<br />
bear this notice and the full citation on the first page. To copy otherwise, to<br />
republish, to post on servers or to redistribute to lists, requires prior specific<br />
permission and/or a fee.<br />
IMC’04, October 25–27, 2004, Taormina, Sicily, Italy.<br />
Copyright 2004 ACM 1-58113-821-0/04/0010 ...$5.00.<br />
can broadly characterize this traffic as nonproductive: it is either<br />
destined for addresses that do not exist, servers that are not running,<br />
or servers that do not want to receive the traffic. It can be a<br />
hostile reconnaissance scan, “backscatter” from a flooding attack<br />
victimizing someone else, spam, or an exploit attempt.<br />
The volume <strong>of</strong> this traffic is not minor. For example, traffic<br />
logs from the Lawrence Berkeley National Laboratory (LBL) for<br />
an arbitrarily-chosen day show that 138 different remote hosts each<br />
scanned 25,000 or more LBL addresses, for a total <strong>of</strong> about 8 million<br />
connection attempts. This is more than double the site’s entire<br />
quantity <strong>of</strong> successfully-established incoming connections, originated<br />
by 47,000 distinct remote hosts. A more fine-grained study<br />
<strong>of</strong> remote scanning activity found (for a different day) 13,000 different<br />
scanners probing LBL addresses [14].<br />
What is all this nonproductive traffic trying to do? How can we<br />
filter it out in order to detect new types <strong>of</strong> malicious activity?<br />
Because this new phenomenon <strong>of</strong> incessant nonproductive traffic<br />
has not yet seen detailed characterization in the literature, we have<br />
lacked the means to answer these questions. In this study we aim<br />
to provide an initial characterization <strong>of</strong> this traffic. Given the traffic’s<br />
pervasive nature (as we will demonstrate), we term it <strong>Internet</strong><br />
“background radiation”.<br />
A basic issue when attempting to measure background radiation<br />
is how, in the large, to determine which observed traffic is indeed<br />
unwanted. If we simply include all unsuccessful connection attempts,<br />
then we will conflate truly unwanted traffic with traffic representing<br />
benign, transient failures, such as accesses to Web servers<br />
that are usually running but happen to be <strong>of</strong>f-line during the measurement<br />
period.<br />
By instead only measuring traffic sent to hosts that don’t exist—i.e.,<br />
<strong>Internet</strong> addresses that are either unallocated or at least<br />
unused—we can eliminate most forms <strong>of</strong> benign failures and focus<br />
on traffic highly likely to reflect unwanted activity. In addition,<br />
analyzing unused addresses yields a second, major measurement<br />
benefit: we can safely respond to the traffic we receive. This gives<br />
us the means to not only passively measure unwanted traffic (for<br />
example, what ports get probed), but to then engage the remote<br />
sources in order to elicit from them their particular intentions (for<br />
example, what specific actions they will take if duped into thinking<br />
they have found a running server).<br />
Given the newness <strong>of</strong> this type <strong>of</strong> <strong>Internet</strong> measurement, one <strong>of</strong><br />
the contributions <strong>of</strong> our study is the set <strong>of</strong> methodologies we develop<br />
for our analysis. These include considerations for how to<br />
use filtering to reduce the load on the measurement system, how to<br />
construct active responders to differentiate different types <strong>of</strong> background<br />
radiation, and ways for interpreting which facets <strong>of</strong> the collected<br />
data merit investigation and which do not.<br />
In some ways, the goals <strong>of</strong> our study are prosaic: we aim to char-
acterize the nature <strong>of</strong> the background, which, by its very ubiquity,<br />
runs the risk <strong>of</strong> having a boring sameness to it. In fact, one measure<br />
<strong>of</strong> success for us would be to achieve a numbingly complete<br />
characterization <strong>of</strong> background radiation which could then facilitate<br />
the construction <strong>of</strong> classifiers to remove known elements <strong>of</strong><br />
background radiation from a given set <strong>of</strong> observations. Such classifiers<br />
could both <strong>of</strong>fload various types <strong>of</strong> network analyzers (for<br />
example, reducing the state a network intrusion detection system<br />
must track) and provide a means to return to the simpler world<br />
<strong>of</strong> a decade ago, by allowing us to recover a notion <strong>of</strong> “normal,”<br />
attack-free traffic. Such attack-free traffic can be highly valuable<br />
for establishing baselines for types <strong>of</strong> analysis that flag departures<br />
from normality as harbingers <strong>of</strong> malicious activity meriting investigation.<br />
We proceed with our study as follows. First, in ¥ 2 we discuss<br />
previous work related to our efforts. In ¥ 3 we describe the sources<br />
<strong>of</strong> data used in our study and our methodology related to capturing<br />
and analyzing this data. ¥ 4 analyzes what we can learn from our<br />
monitoring when we use it purely passively, and ¥ 5 then extends<br />
this to what we can learn if we also respond to traffic we receive.<br />
In ¥ 6 we evaluate aspects <strong>of</strong> traffic source behavior. We conclude<br />
with a summary <strong>of</strong> the themes developed during our study.<br />
2. RELATED WORK<br />
Several studies have characterized specific types <strong>of</strong> malicious<br />
traffic. Moore et al. investigate the prevalence <strong>of</strong> denial-<strong>of</strong>-service<br />
attacks in the <strong>Internet</strong> using “backscatter analysis” [23], i.e., observing<br />
not the attack traffic itself but the replies to it sent by the<br />
flooding victim, which are routed throughout the <strong>Internet</strong> due to the<br />
attacker’s use <strong>of</strong> spo<strong>of</strong>ed source addresses. Measurement studies <strong>of</strong><br />
the Code Red I/II worm outbreaks [21] and the Sapphire/Slammer<br />
worm outbreak [20, 19] provide detail on the method, speed and effects<br />
<strong>of</strong> each worm’s propagation through the <strong>Internet</strong>. Additional<br />
studies assess the speed at which counter-measures would have to<br />
be deployed to inhibit the spread <strong>of</strong> similar worms [22].<br />
The empirical components <strong>of</strong> these studies were based largely<br />
on data collected at “network telescopes” (see below) similar to<br />
those used in our study, though without an active-response component.<br />
A related paper by Staniford et al. mathematically models<br />
the spread <strong>of</strong> Code Red I and considers threats posed by potential<br />
future worms [33]. A small scale study <strong>of</strong> <strong>Internet</strong> attack processes<br />
using a fixed honeypot setup is provided in [8]. Yegneswaran et al.<br />
explore the statistical characteristics <strong>of</strong> <strong>Internet</strong> attack and intrusion<br />
activity from a global perspective [43]. That work was based<br />
on the aggregation and analysis <strong>of</strong> firewall and intrusion detection<br />
logs collected by Dshield.org over a period <strong>of</strong> months. The coarsegrained<br />
nature <strong>of</strong> that data precluded an assessment <strong>of</strong> attacks beyond<br />
attribution to specific ports. Finally, Yegneswaran et al. provide<br />
a limited case study in [42] that demonstrates the potential<br />
<strong>of</strong> network telescopes to provide a broad perspective on <strong>Internet</strong><br />
attack activity. We extend that work by developing a much more<br />
comprehensive analysis <strong>of</strong> attack activity.<br />
Unused IP address space has become an important source <strong>of</strong> information<br />
on intrusion and attack activity. Measurement systems<br />
deployed on unused IP address ranges have been referred to as “<strong>Internet</strong><br />
Sink-holes” [12], and “Network Telescopes” [18]. Active<br />
projects focused on unused address space monitoring include Honeynet<br />
[13] and Honeyd [27]. Honeynet focuses on the use <strong>of</strong> live<br />
VMware-based systems to monitor unused addresses. Honeyd uses<br />
a set <strong>of</strong> stateful virtual responders to operate as an interactive honeypot.<br />
Finally, network intrusion detection systems, including<br />
Snort [29, 6], Bro [26], and a variety <strong>of</strong> commercial tools, are<br />
commonly used to detect scans for specific malicious payloads.<br />
An emerging area <strong>of</strong> research is in the automated generation <strong>of</strong><br />
attack signatures. For example, Honeycomb [17] is an extension<br />
<strong>of</strong> Honeyd that uses a longest common substring (LCS) algorithm<br />
on packet-level data recorded by Honeyd to automatically generate<br />
signatures. Other recent work pursues a similar approach, including<br />
Earlybird [32] and Autograph [15]. Our study can inform<br />
future developments <strong>of</strong> such systems with respect to both the type<br />
and volume <strong>of</strong> ambient background attack activity.<br />
3. MEASUREMENT METHODOLOGY<br />
This section describes the methods and tools we use to measure<br />
and analyze background radiation traffic, addressing two key issues:<br />
1. Taming large traffic volume: We listen and respond to<br />
background traffic on thousands to millions <strong>of</strong> IP addresses.<br />
The sheer volume <strong>of</strong> traffic presents a major hurdle. We handle<br />
this with two approaches: 1) devising a sound and effective<br />
filtering scheme, so that we can significantly reduce the<br />
traffic volume while maintaining the variety <strong>of</strong> traffic; and<br />
2) building a scalable responder framework, so we can respond<br />
to traffic at a high rate.<br />
2. Building application-level responders: We find that TCP<br />
SYN packets dominate background radiation traffic in our<br />
passive measurements, which means we need to accept connections<br />
from the sources and extend the dialog as long as<br />
possible to distinguish among the types <strong>of</strong> activities. This involves<br />
building responders for various application protocols,<br />
such as HTTP, NetBIOS, and CIFS/SMB, among others.<br />
3.1 Taming the Traffic Volume<br />
Responding to the entirety <strong>of</strong> background radiation traffic received<br />
by thousands to millions <strong>of</strong> IP addresses would entail processing<br />
an enormous volume <strong>of</strong> traffic. For example, we see nearly<br />
30,000 packets per second <strong>of</strong> background radiation on the Class A<br />
network we monitor. Taming the traffic volume requires effective<br />
filtering, and it is also important to investigate scalable approaches<br />
to building responders. We discuss each in turn.<br />
3.1.1 Filtering<br />
When devising a filtering scheme, we try to balance trade-<strong>of</strong>fs<br />
between traffic reduction and the amount <strong>of</strong> information lost in filtering.<br />
We considered the following strategies:<br />
Source-Connection Filtering: This strategy keeps the ¦ first<br />
connections initiated by each source and discards the remainder.<br />
A disadvantage <strong>of</strong> this strategy is that it provides an<br />
inconsistent view <strong>of</strong> the network to the source: that is, live<br />
IP addresses become unreachable. Another problem is that<br />
an effective value <strong>of</strong> ¦<br />
can be service- or attack-dependent.<br />
For certain attacks (e.g., “Code Red”), ¦¨§© suffices, but<br />
multi-stage activities like Welchia, or multi-vector activities<br />
like Agobot, require larger values <strong>of</strong> ¦ .<br />
Source-Port Filtering: This strategy is similar except we ¦ keep<br />
connections for each source/destination port pair. This alleviates<br />
the problem <strong>of</strong> ¦ estimating for multi-vector activities<br />
like Agobot, but multi-stage activities on a single destination<br />
port like Welchia remain a problem. This strategy also exposes<br />
an inconsistent view <strong>of</strong> the network.
Effectiveness <strong>of</strong> Filter (% reduction in pkts or bytes)<br />
98<br />
96<br />
94<br />
92<br />
90<br />
Campus (pkts)<br />
Campus(bytes)<br />
LBL (pkts)<br />
LBL(bytes)<br />
5 10 15 20<br />
Filter Size (Number <strong>of</strong> Live Destination IPs per Source)<br />
Effectiveness <strong>of</strong> Filter (% reduction in pkts)<br />
100<br />
80<br />
60<br />
40<br />
20<br />
0<br />
Port 80 (HTTP)<br />
Port 135 (DCERPC)<br />
Port 139,445 (NetBIOS/SMB)<br />
Port 3127 (Mydoom)<br />
Others<br />
5 10 15 20<br />
Filter Size (Number <strong>of</strong> Live Destination IPs per Source)<br />
Figure 1: Effectiveness <strong>of</strong> Filtering, Networks (left) and Services (right)<br />
Source-Payload Filtering: This strategy keeps one instance <strong>of</strong><br />
each type <strong>of</strong> activity per source. From a data richness perspective,<br />
this seems quite attractive. However, it is very hard<br />
to implement in practice as we do not <strong>of</strong>ten know whether<br />
two activities are similar until we respond to several packets<br />
(especially true for multi-stage activities and chatty protocols<br />
like NetBIOS). This strategy also requires significant state.<br />
Source-Destination Filtering: This is the strategy we chose for<br />
our experiments, based on the assumption that background<br />
radiation sources possess the same degree <strong>of</strong> affinity to all<br />
monitored IP addresses. More specifically, if a source contacts<br />
a destination IP address displaying certain activity, we<br />
assume that we will see the same kind <strong>of</strong> activity on all other<br />
IP addresses that the source tries to contact. We find this<br />
assumption generally holds, except for the case <strong>of</strong> certain<br />
multi-vector worms that pick one exploit per IP address, for<br />
which we will identify only one <strong>of</strong> the attack vectors.<br />
Figure 1 illustrates the effectiveness <strong>of</strong> this filtering on different<br />
networks and services when run for a two-hour interval. The first<br />
plot shows that the filter reduces the inbound traffic by almost two<br />
orders <strong>of</strong> magnitude in both networks. The LBL network obtains<br />
more significant gains than the larger Campus networks because the<br />
Campus network intentionally does not respond to the last stage <strong>of</strong><br />
exploits from certain frequently-seen Welchia variants that in their<br />
last step send a large attack payload ( 30KB buffer overflow). The<br />
second plot illustrates the effectiveness <strong>of</strong> the filter for the various<br />
services. Since Blaster (port 135) and MyDoom (port 3127) scanners<br />
tend to horizontally sweep IP subnets, they lead to significant<br />
gains from filtering, while less energetic HTTP and NetBIOS scanners<br />
need to be nipped in the bud (low ¦ ) to have much benefit.<br />
3.1.2 Active Sink: an Event-driven Stateless Responder<br />
Platform<br />
Part <strong>of</strong> our active response framework explores a stateless approach<br />
to generating responses, with a goal <strong>of</strong> devising a highly<br />
scalable architecture. Active Sink is the active response component<br />
<strong>of</strong> iSink[42], a measurement system developed to scalably monitor<br />
background radiation observed in large IP address blocks. Active<br />
Sink simulates virtual machines at the network level, much like<br />
Honeyd [27], but to maximize scalability it is implemented in a<br />
stateless fashion as a Click kernel module [42] [16]. It achieves<br />
statelessness by using the form <strong>of</strong> incoming application traffic to<br />
determine an appropriate response (including appropriate sequence<br />
numbers), without maintaining any transport or application level<br />
state. A key question for this approach is whether all necessary<br />
responders can be constructed in such a stateless fashion. While<br />
exploring this issue is beyond the scope <strong>of</strong> the present work, we<br />
note that for all <strong>of</strong> the responders we discuss, we were able to implement<br />
a stateless form for Active Sink, as well as a stateful form<br />
based on Honeyd. (To facilitate the dual development, we developed<br />
interface modules so that each could use the same underlying<br />
code for the responders.)<br />
3.2 Application-Level Responders<br />
Our approach to building responders was “data driven”: we determined<br />
which responders to build based on observed traffic volumes.<br />
Our general strategy was to pick the most common form<br />
<strong>of</strong> traffic, build a responder for it detailed enough to differentiate<br />
the traffic into specific types <strong>of</strong> activity, and, once the “Unknown”<br />
category for that type <strong>of</strong> activity was sufficiently small, repeat the<br />
process with the next largest type <strong>of</strong> traffic.<br />
Using this process, we built an array <strong>of</strong> responders for the following<br />
protocols (Figure 2): HTTP (port 80), NetBIOS (port 137/139),<br />
CIFS/SMB [7] (port 139/445), DCE/RPC [10] (port 135/1025 and<br />
CIFS named pipes), and Dameware (port 6129). We also built<br />
responders to emulate the backdoors installed by MyDoom (port<br />
3127) and Beagle (port 2745) [5], [24].<br />
Application-level responders need to not only adhere to the structure<br />
<strong>of</strong> the underlying protocol, but also to know what to say. Most<br />
sources are probing for a particular implementation <strong>of</strong> a given protocol,<br />
and we need to emulate behavior <strong>of</strong> the target s<strong>of</strong>tware in<br />
order to keep the conversation going.<br />
The following example <strong>of</strong> HTTP/WebDAV demonstrates what<br />
this entails. We see frequent "GET /" requests on port 80. Only<br />
by responding to them and mimicking a Micros<strong>of</strong>t IIS with Web-<br />
DAV enabled will elicit further traffic from the sources. The full<br />
sequence plays as:<br />
GET<br />
<br />
/<br />
|200 OK ... Server: Micros<strong>of</strong>t-IIS/5.0|<br />
SEARCH /<br />
|411 Length Required|<br />
SEARCH /AAA... (URI length 30KB)<br />
(buffer overflow exploit received)<br />
Some types <strong>of</strong> activity require quite intricate responders. Many<br />
Micros<strong>of</strong>t Windows services run on top <strong>of</strong> CIFS (port 139/445),<br />
which lead us to develop the detailed set <strong>of</strong> responses shown in<br />
Figure 3. Requests on named pipes are further tunneled to various<br />
DCE/RPC responders. One <strong>of</strong> the most complicated activities<br />
is the exploit on the SAMR and later on the SRVSVC pipe,<br />
which involves more than ten rounds exchanging messages before<br />
the source will reveal its specific intent by attempting to create an<br />
executable file on the destination host. Figure 4 shows an example<br />
where we cannot classify the source until the “NT Create AndX”
Honeyd/Active Sink<br />
OS Responder<br />
Honey Interface<br />
ports<br />
80,1080,3128,8888<br />
port 137<br />
port 139<br />
port 6129<br />
ports 2745,3127<br />
HTTP Responder<br />
(Welchia,Agobot,CodeRed,Tickerbar)<br />
NBNS Responder<br />
(NetBIOS name requests)<br />
port 445<br />
NB Responder<br />
Dameware Responder<br />
(Agobot)<br />
Echo Responder<br />
(Beagle,MyDoom,Agobot)<br />
SMB?<br />
ports 135,1025<br />
SMB Responder<br />
(Welchia, Sasser, Xibo, Agobot,Randex)<br />
RPC?<br />
DCERPC Responder<br />
(Welchia, Blaster, Agobot)<br />
Figure 2: Top level Umbrella <strong>of</strong> Application Responders<br />
request for msmsgri32.exe. (The NetrRemoteTOD command<br />
is used to schedule the worm process to be invoked one minute<br />
after TimeOfDay [4].) We found this attack sequence is shared<br />
across several viruses, including the Lioten worm [4] and Agobot<br />
variants [1].<br />
Building responders like this one can prove difficult due to<br />
the lack <strong>of</strong> detailed documentation on services such as CIFS and<br />
DCE/RPC. Thus, we sometimes must resort to probing an actual<br />
Windows system running in a virtual machine environment, in order<br />
to analyze the responses it makes en route to becoming infected.<br />
We modified existing trace replay tools like flowreplay for this<br />
purpose [11].<br />
More generally, as new types <strong>of</strong> activities emerge over time, our<br />
responders also need to evolve. While we find the current pace <strong>of</strong><br />
maintaining the responders tractable, an important question is to<br />
what degree we can automate the development process.<br />
msmsgri32.exe<br />
Xi.exe<br />
13,273<br />
srvsvc<br />
10,150<br />
82<br />
winlord32.exe<br />
10,161<br />
svcctl<br />
1543<br />
62<br />
samr<br />
626<br />
wmmiexe.exe<br />
lsarpc<br />
52<br />
Port445<br />
Negotiate_Protocol<br />
Session_Setup<br />
644<br />
472,180 / 506,892<br />
460,630<br />
24,996 843 478<br />
112 422,378<br />
4,393<br />
Lovgate.exe<br />
epmapper<br />
(MS03-011)<br />
RPC Buffer Overflow)<br />
100<br />
micros<strong>of</strong>t.exe<br />
locator<br />
Welchia (MS03-001)<br />
Locator Buffer Overflow<br />
Figure 3: Example summary <strong>of</strong> port 445 activity on Class A<br />
(500K Sessions) Arcs indicate number <strong>of</strong> sessions<br />
3.3 Traffic Analysis<br />
Once we can engage in conversations with background radiation<br />
sources, we then need to undertake the task <strong>of</strong> understanding the<br />
traffic. Here our approach has two components: first, we separate<br />
traffic analysis from the responders themselves; second, we try to<br />
analyze the traffic in terms <strong>of</strong> its application-level semantics.<br />
Regarding the first <strong>of</strong> these, while it might appear that the job <strong>of</strong><br />
traffic analysis can be done by the responders(since the responders<br />
need to understand the traffic anyway), there are significant benefits<br />
to performing traffic analysis independently. We do so by capturing<br />
and storing tcpdump packet traces for later <strong>of</strong>f-line analysis. This<br />
approach allows us to preserve the complete information about the<br />
traffic and evolve our analysis algorithms over time. The flip side is<br />
that doing so poses a challenge for the analysis tool, since it needs<br />
to do TCP stream reassembly and application-protocol parsing. To<br />
address this issue, we built our tool on top <strong>of</strong> the Bro intrusion<br />
detection system [26], which provides a convenient platform for<br />
application-level protocol analysis.<br />
We found early on that in order to filter the background radiation<br />
traffic from the “normal” traffic, we need to understand the application<br />
semantics <strong>of</strong> the traffic. This is because the background radiation<br />
traffic has very distinctive application semantic characteristics<br />
compared to the “normal” traffic (as we will see in the following<br />
sections), but the differences are far more difficult to detect at the<br />
network or transport level.<br />
Our analysis has an important limitation: we do not attempt to<br />
understand the binary code contained in buffer-overrun exploits.<br />
This means we cannot tell for sure which worm or autorooter sent<br />
us a particular exploit (also due to lack <strong>of</strong> a publicly available<br />
database <strong>of</strong> worm/virus/autorooter packet traces). If a new variant<br />
<strong>of</strong> an existing worm arises that exploits the same vulnerability,<br />
we may not be able to discern the difference. However, the analysis<br />
will identify a new worm if it exploits a different vulnerability, as<br />
in the case <strong>of</strong> the Sasser worm [30].<br />
3.4 Experimental Setup<br />
We conducted our experiments at two different sites. These ran<br />
two different systems, iSink and LBL Sink, which conducted the<br />
same forms <strong>of</strong> application response but used different underlying<br />
mechanisms.<br />
iSink: Our iSink instance monitored background traffic observed<br />
in a Class A network (/8, addresses), and two 19 subnets<br />
(16K addresses) on two adjacent UW campus class B net-
-> SMB Negotiate Protocol Request<br />
SMB Session Setup AndX Request<br />
SMB Tree Connect AndX Request,<br />
Path: \\XX.128.18.16\IPC$<br />
SMB NT Create AndX Request, Path: \samr<br />
DCERPC Bind: call_id: 1 UUID: SAMR<br />
SAMR Connect4 request<br />
SAMR EnumDomains request<br />
SAMR LookupDomain request<br />
SAMR OpenDomain request<br />
SAMR EnumDomainUsers request<br />
Now start another session, connect to the<br />
SRVSVC pipe and issue NetRemoteTOD<br />
(get remote Time <strong>of</strong> Day) request<br />
-> SMB Negotiate Protocol Request<br />
SMB Session Setup AndX Request<br />
SMB Tree Connect AndX Request,<br />
Path: \ \XX.128.18.16\IPC$<br />
SMB NT Create AndX Request, Path: \srvsvc<br />
DCERPC Bind: call_id: 1 UUID: SRVSVC<br />
SRVSVC NetrRemoteTOD request<br />
SMB Close request<br />
SMB Tree Connect AndX Request, Path: \\XX.128.18.16\ADMIN$<br />
SMB NT Create AndX Request,<br />
Path:\system32\msmsgri32.exe
state management at the forwarder. However, tunneling requires<br />
the receive end to a) decapsulate traces before analysis, b) handle<br />
fragmentation <strong>of</strong> full-MTU packets, and c) allocate a dedicated tunnel<br />
port. NAT, on the other hand, does not have these three issues,<br />
but necessitates maintaining per-flow state at the forwarder, which<br />
can be significant in large networks. The stateless responder deployed<br />
at the UW site allows such state to be ephemeral, which<br />
makes the approach feasible. That is we only need to maintain a<br />
consistent flow ID for each outstanding incoming packet, so the<br />
corresponding flow record at the filter can be evicted as soon as it<br />
sees a response. Hence, the lifetime <strong>of</strong> flow records is on the order<br />
<strong>of</strong> milliseconds (RTT between the forwarder and active-sink)<br />
instead <strong>of</strong> seconds.<br />
4. PASSIVE MEASUREMENT OF BACK-<br />
GROUND RADIATION<br />
This section presents a baseline <strong>of</strong> background radiation traffic<br />
on unused IP addresses without actively responding to any packet.<br />
It starts with a traffic breakdown by protocols and ports, and then<br />
takes a close look at one particular facet <strong>of</strong> the traffic: backscatter.<br />
4.1 Traffic Composition<br />
A likely first question about background radiation characteristics<br />
is “What is the type and volume <strong>of</strong> observed traffic?”. We start to<br />
answer this question by looking at two snapshots <strong>of</strong> background<br />
radiation traffic shown in Table 2 which includes an 80 hour trace<br />
collected at UW Campus on a /19 network from May 1 to May 4,<br />
a one week trace at LBL collected on 10 contiguous /24 networks<br />
from April 28 to May 5, and finally a one-week trace at Class A<br />
with 1/10 sampling from March 11 to 18.<br />
Protocol UW-1 LBL-P Class A<br />
Rate % Rate % Rate %<br />
TCP 928 95.0% 664 56.5% 130 88.5%<br />
ICMP 4.00 4.2% 488 39.6% 0.376 0.3%<br />
UDP 0.156 0.8% 45.2 3.8% 16.5 11.3%<br />
Table 2: Traffic rate breakdown by protocols. The rate is computed<br />
as number <strong>of</strong> packets per destination IP address per day,<br />
i.e., with network size and sampling rate normalized<br />
Clearly, TCP dominates more or less in all three networks. The<br />
relatively lower TCP rate at Class A is partly due to the artifact<br />
that the Class A trace was collected in Mar instead in May, when<br />
we see a few large worm/malware outbreaks (include the Sasser<br />
worm). Not shown in the table, about 99% <strong>of</strong> the observed TCP<br />
packets are TCP/SYN.<br />
The large number <strong>of</strong> ICMP packets (<strong>of</strong> which more than 99.9%<br />
are ICMP/echo-req) we see at LBL form daily high volume<br />
spikes (Figure 6), which are the result <strong>of</strong> a small number <strong>of</strong> sources<br />
scanning every address in the observed networks. On the other<br />
hand we see a lot fewer ICMP packets at the Class A monitor<br />
which is probably because the Welchia worm, which probes with<br />
ICMP/echo-req, avoids the Class A network.<br />
Finally, the surprising low rate <strong>of</strong> UDP packets observed at UW<br />
is largely due to the artifact that UW filters UDP port 1434 (the<br />
Slammer worm).<br />
In Figure 6, we can also see that TCP/SYN packets seen at LBL<br />
arrive at a relatively steady rate, (and this is the case for the other<br />
two networks as well) in contrast to daily ICMP spikes. A closer<br />
look at the breakdown <strong>of</strong> TCP/SYN packets by destination port<br />
numbers at LBL (Table 4) reveals that a small number <strong>of</strong> ports are<br />
Number <strong>of</strong> Packets per Hour<br />
ICMP<br />
TCP<br />
6 UDP<br />
4<br />
2<br />
0<br />
0 20 40 60 80 100 120 140 160<br />
8 x 10⁵ Time (hour)<br />
Figure 6: Number <strong>of</strong> background radiation packets per hour<br />
seen at LBL<br />
the targets <strong>of</strong> a majority <strong>of</strong> TCP/SYN packets (the eight ports listed<br />
in the table account for more than 83% <strong>of</strong> the packets).<br />
Table 3 shows the same traces from the perspective <strong>of</strong> the source<br />
<strong>of</strong> the traffic. Note that the rows are not mutually exclusive as one<br />
host may send both TCP and UDP packets. It is clear that TCP<br />
packets dominate in the population <strong>of</strong> source hosts we see. The<br />
distribution across ports <strong>of</strong> LBL traffic is shown in Table 4; as before,<br />
a small number <strong>of</strong> ports are dominant.<br />
Protocol UW LBL<br />
#SrcIP Percentage #SrcIP Percentage<br />
TCP 759,324 87.9% 586,025 90.0%<br />
ICMP 109,135 12.6% 64,120 9.8%<br />
UDP 4,273 0.5% 4,360 0.7%<br />
Table 3: Traffic breakdown by number <strong>of</strong> sources.<br />
TCP Port # Source IP (%) # Packets (%)<br />
445 43.4% 19.7%<br />
80 28.7% 7.3%<br />
135 19.1% 30.4%<br />
1025 4.3% 5.8%<br />
2745 3.2% 3.6%<br />
139 3.2% 11.1%<br />
3127 2.7% 3.2%<br />
6129 2.2% 2.4%<br />
Table 4: The Most Popular TCP Ports. Ports that are visited by<br />
the most number <strong>of</strong> source IPs, as in a one week passive trace at<br />
LBL. In total there are 12,037,064 packets from 651,126 distinct<br />
source IP addresses.<br />
As TCP/SYN packets constitute a significant portion <strong>of</strong> the<br />
background radiation traffic observed on a passive network, the<br />
next obvious question is, “What are the intentions <strong>of</strong> these connection<br />
requests?”. We explore this question in Section 5 and 6.<br />
4.2 Analysis <strong>of</strong> Backscatter Activity<br />
The term Backscatter is commonly used to refer to unsolicited<br />
traffic that is the result <strong>of</strong> responses to attacks spo<strong>of</strong>ed with a network’s<br />
IP address. Figure 7 provides a time-series graph <strong>of</strong> the<br />
backscatter activity seen on the four networks. Not surprisingly,<br />
TCP RSTs and SYN-ACKs account for the majority <strong>of</strong> the scans<br />
seen in all four networks. These would be the most common responses<br />
to a spo<strong>of</strong>ed SYN-flood (Denial <strong>of</strong> Service) attack. The<br />
figures for the two UW and the Class A networks span the same
Number <strong>of</strong> Packets Per IP (per hour)<br />
0.2<br />
0.1<br />
RST<br />
Syn-Ack<br />
Comm Adm Proh (Host)<br />
TTL Exceeded<br />
Number <strong>of</strong> Packets per IP (per hour)<br />
0.2<br />
0.1<br />
RST<br />
Syn-Ack<br />
Comm Adm Proh (Host)<br />
TTL Exceeded<br />
Number <strong>of</strong> Packets per IP (per hour)<br />
0.2<br />
0.1<br />
RST<br />
Syn-Ack<br />
TTL Exceeded<br />
0<br />
Wed Thu Fri Sat Sun Mon Tue Wed<br />
Day <strong>of</strong> the week<br />
0<br />
Wed Thu Fri Sat Sun Mon Tue Wed<br />
Day <strong>of</strong> the week<br />
0<br />
Wed Thu Fri Sat Sun Mon Tue Wed<br />
Day <strong>of</strong> the Week<br />
(a) Backscatter at UW I<br />
(b) Backscatter at UW II<br />
(c) Backscatter at LBL<br />
Number <strong>of</strong> Packets per IP (per hour)<br />
0.2<br />
0.1<br />
RST<br />
Syn-Ack<br />
Other backscatter<br />
Number <strong>of</strong> Packets per IP (per hour)<br />
2×10 -2<br />
1×10 -2<br />
5×10 -3<br />
TTL Excd in Transit<br />
Comm Adm Prohibited<br />
Comm Adm Prohibited (Host)<br />
Port Unreachable<br />
Host Unreachable<br />
0<br />
Fri Sat Sun Mon Tue Wed Thu<br />
Day <strong>of</strong> the week<br />
0<br />
Fri Sat Sun Mon Tue Wed Thu<br />
Day <strong>of</strong> the week<br />
(d) Syn-Acks and RSTs in Class A<br />
(e) Remaining Backscatter in Class A<br />
Figure 7: Time series <strong>of</strong> weekly backscatter in the four networks. Note that Class A is shown in two charts, the second one (e) showing<br />
the other components <strong>of</strong> backscatter besides the dominant RST, SYN-ACK’s.<br />
two weeks. The backscatter in the two UW networks looks highly<br />
similar both in terms <strong>of</strong> volume and variability. This can be observed<br />
both in the TCP RSTs/SYN-ACKs and the two surges in<br />
ICMP TTL-Exceeded shown in Figures 7(a) and (b), and makes<br />
sense if the spo<strong>of</strong>ed traffic which is eliciting the backscatter is uniformly<br />
distributed across the UW addresses. The only difference<br />
between the networks is that UW I tends to receive more “Communication<br />
administratively prohibited” ICMP messages than UW II.<br />
We do yet have an explanation why. While we see some common<br />
spikes in the SYN-ACKS at the Class A and UW networks, there<br />
seem to be significant differences in the RSTs. Another notable difference<br />
is that the Class A network attracts much more backscatter<br />
in other categories, as shown in Figure 7(e).<br />
The LBL graph shown in Figure 7(c) belongs to a different week<br />
and displays a quite different pattern than that <strong>of</strong> UW. We note that<br />
the backscatter in the UW networks for the same week (not shown<br />
here) shows a very similar pattern as at LBL for the dominant traffic<br />
types (TCP RSTs/SYN-ACKs and ICMP TTL-Exceeded). This is<br />
not surprising, because the two UW networks and the LBL network<br />
belong to the same /8 network. On the other hand, the LBL network<br />
seems to receive far fewer scans in the other categories.<br />
A significant portion <strong>of</strong> ICMP host-unreach messages we<br />
see at Class A are responses to UDP packets with spo<strong>of</strong>ed source<br />
addresses from port 53 to port 1026. We first thought we were<br />
seeing backscatters <strong>of</strong> DNS poisoning attempts, but then we found<br />
that we are also seeing the UDP packets in other networks as well.<br />
Examining these packets reveals that they are not DNS packets, but<br />
rather Windows Messenger Pop-Up spams, as discussed in the next<br />
section.<br />
5. ACTIVITIES IN BACKGROUND RADI-<br />
ATION<br />
In this section we will first divide the traffic by ports and present<br />
a tour <strong>of</strong> dominant activities on the popular ports. Then we will<br />
add the temporal element to our analysis to see how the volume <strong>of</strong><br />
activities vary over time.<br />
5.1 Details per Port<br />
We rank activities’ popularity mostly by number <strong>of</strong> source IPs,<br />
rather than by packet or byte volume, for the following reasons.<br />
First, our filtering algorithm is biased against sources that try to<br />
reach many destinations, thus affects packet/byte volumes unevenly<br />
for different activities. The number <strong>of</strong> source IPs, however, should<br />
largely remain unaffected by filtering, assuming a symmetry among<br />
destinations. Also, number <strong>of</strong> source IPs reflects popularity <strong>of</strong> the<br />
activity across the <strong>Internet</strong> — an activity with a huge number <strong>of</strong><br />
sources is likely to be prominent on the whole <strong>Internet</strong>. Finally,<br />
while a single-source activities might be merely a result <strong>of</strong> an eccentric<br />
host, a multi-source activity is more likely to be intentional.
Port/Abbrev. Activity<br />
80/Get "GET /"<br />
80/GetSrch "GET /" "SEARCH /"<br />
80/SrchAAA "GET /" "SEARCH /" "SEARCH /AAA..."<br />
80/Srch64K "SEARCH /\x90\x02\xb1\x02\xb1..."<br />
(65536 byte URI)<br />
135/Bind1 RPC bind: 000001a0-0000-0000-c000-<br />
000000000046<br />
135/RPC170 Unknown RPC request (170 bytes)<br />
135/Bla RPC exploit: Blaster<br />
135/Wel RPC exploit: Welchia<br />
135/RPC-X1 RPC exploit: Exploit1624a<br />
135/EP24-X2 135/tcp/[empty] => 135/tcp/Probe24a =><br />
135/tcp/RPC exploit: Exploit2904a<br />
445/Nego 445/tcp/[session negotiation only]<br />
445/Locator "\\\IPC$ \locator";<br />
RPC exploit: Exploit1896a<br />
445/Samr-exe "\\\IPC$ \samr"<br />
"\\\IPC$ \srvsvc"<br />
CREATE FILE: "[...].exe"<br />
445/Samr "\\\IPC$ \samr"<br />
445/Srvsvc "\\\IPC$ \srvsvc"<br />
445/Epmapper "\\\IPC$ \epmapper"<br />
Table 5: Abbreviations for Popular Activities<br />
When a source host contacts a port, it is common that it sends<br />
one or more probes before revealing its real intention, sometimes<br />
in its second or third connection to the destination host. A probe<br />
can be an empty connection, i.e. the source opens and closes the<br />
connection without sending a byte, or some short request, e.g., an<br />
HTTP "GET /". Since we are more interested in the intention <strong>of</strong><br />
sources, we choose to look at the activities at a per-session (sourcedestination<br />
pair) granularity rather than a per-connection granularity.<br />
Otherwise one might reach the conclusion that the probes<br />
are the dominant elements. We consider all connections between<br />
a source-destination pair on the given destination port collectively<br />
and suppress repetitions. This approach usually gives us a clear<br />
picture <strong>of</strong> activity on each port.<br />
Below we examine the activities on popular destination ports,<br />
and for each port we will present the dominant activities. For convenience<br />
<strong>of</strong> presentation, we introduce abbreviations for activity<br />
descriptions, as shown in Table 5. We pick an arbitrary day, March<br />
29, 2004, to compare the distribution <strong>of</strong> activities seen at different<br />
networks, LBL, UW (I,II), and the Class A network. We consider<br />
the two UW networks as a single network to eliminate possible bias<br />
that might occur due to a single filter.<br />
The background radiation traffic is highly concentrated on a<br />
small number <strong>of</strong> popular ports. For example, on Mar 29 we saw<br />
32,072 distinct source IPs at LBL, 1 and only 0.5% <strong>of</strong> the source<br />
hosts contacted a port not among the “popular” ports discussed below.<br />
Thus by looking at the most popular ports, we cover much <strong>of</strong><br />
the background radiation activity.<br />
Note that looking at the ports alone does not allow us to distinguish<br />
the background radiation traffic, because many <strong>of</strong> the popular<br />
ports, e.g., 80/tcp (HTTP), 135/tcp (DCE/RPC) and 445/tcp<br />
(SMB), are also heavily used by the normal traffic. On the other<br />
hand, once we look at the background radiation traffic at application<br />
semantic level, it has a very distinctive modal distribution.<br />
For example, the activities on port 135 are predominantly targeted<br />
on two particular interfaces, and almost all buffer-overrun exploits<br />
are focused on one interface. It is worth noting that the activity<br />
composition may change dramatically over time, especially when<br />
Here we ignore the effect <strong>of</strong> source IP spo<strong>of</strong>ing, since our responder was<br />
able to establish TCP connections with most <strong>of</strong> the source hosts.<br />
Activity LBL UW Class A<br />
Get 5.1% 2.9% 4.6%<br />
GetSrch 5.2% 93.2% 93.4%<br />
SrchAAA 84.2% 0.0% 0.0%<br />
Srch64K 0.9% 1.1% 0.0%<br />
CodeRed 0.6% 0.4% 0.5%<br />
Nimda 0.2% 0.1% 0.2%<br />
Other 3.8% 2.3% 1.3%<br />
Table 6: Port 80 Activities (Mar 29, 2004) Note that to reduce<br />
trace size the active responders at UW and Class A do not respond<br />
to "SEARCH /" to avoid getting the large SrchAAA requests.<br />
new vulnerabilities/worms appear, e.g., the dominant activity on<br />
port 445 is no longer “Locator” after the rise <strong>of</strong> the Sasser worm.<br />
However, we believe the modal pattern will last as long as the background<br />
radiation traffic remains highly automated.<br />
TCP Port 80 (HTTP) and HTTP Proxy Ports: Most activities<br />
we see on port 80 (Table 6) are targeted against the Micros<strong>of</strong>t IIS<br />
server. In most cases, imitating the response <strong>of</strong> a typical IIS server<br />
enables us to attract follow-up connections from the source.<br />
The dominant activity on port 80 is a WebDAV buffer-overrun<br />
exploit [39] (denoted as SrchAAA). The exploit always makes two<br />
probes: "GET /" and "SEARCH /", each in its own connection,<br />
before sending a "SEARCH" request with a long URI (in<br />
many cases 33,208 bytes, but the length can vary) starting with<br />
"/AAAA..." to overrun the buffer. Unlike exploits we see on<br />
many other ports, this exploit shows a lot <strong>of</strong> payload diversity —<br />
the URIs can be different from each other by hundreds <strong>of</strong> bytes,<br />
and the difference is not due to byte shifting. More interestingly,<br />
the URIs are composed solely <strong>of</strong> lower-case letters except for a few<br />
dozens <strong>of</strong> Unicode characters near the beginning. The URI appears<br />
to be constructed with the Venetian exploit [2], and it will become<br />
executable x86 code after Unicode encoding (inserting a byte 0 at<br />
every other byte). Besides this exploit, we also see other WebDAV<br />
exploits, e.g., one popular exploit (Srch64K) from Agobot carries a<br />
fixed 65,536 byte URI.<br />
Old IIS worms, Nimda and CodeRed II, remain visible in the<br />
datasets. The CodeRed II worm is almost the same as the original<br />
CodeRed II, except shift <strong>of</strong> a space and the change <strong>of</strong> expiration<br />
date to year 0x8888. We also <strong>of</strong>ten see a "OPTIONS /" followed<br />
by a "PROPFIND" request. As both requests are short, they look<br />
like probes. We have not been able to elicit further requests from<br />
the sources and do not yet fully comprehend the intention behind<br />
such probes. We suspect that they might be scanners trying to obtain<br />
a listing <strong>of</strong> list <strong>of</strong> scriptable files by sending “translate: f” in<br />
the header <strong>of</strong> the HTTP request [31].<br />
An interesting component <strong>of</strong> background radiation observed<br />
across all networks on the HTTP proxy ports:<br />
81/1080/3128/8000/8080/8888, 2 as well as on port 80, is source<br />
hosts using open-proxies to send probes to tickerbar.net.<br />
A typical request is shown in Figure 8. These requests are<br />
from sources abusing a “get rich quick” money scheme from<br />
greenhorse.com–a web site pays users money for running tickerbar<br />
while they surf the net. By using open-proxies, these sources can<br />
potentially appear to be running hundreds <strong>of</strong> nodes [35]. The<br />
Greenhorse website seems to have since been inactivated.<br />
Though some <strong>of</strong> these ports are not <strong>of</strong>ficially assigned to HTTP, the traffic<br />
<br />
we received almost contained only HTTP requests.
GET http://dc.tickerbar.net/tld/pxy.m?nc=262213531 HTTP/1.0<br />
Host: dc.tickerbar.net<br />
Connection: Close<br />
Percentage <strong>of</strong> Source IPs (%)<br />
Figure 8: Typical HTTP request <strong>of</strong> a tickerbar host<br />
100.0<br />
80.0<br />
60.0<br />
40.0<br />
20.0<br />
0.0<br />
LBL UW Class A<br />
(334) (960) (6220)<br />
Data Set(Volume)<br />
Figure 9: Port 135 activities on Mar 29<br />
Other<br />
135/EP24-X2<br />
135/RPC-X1<br />
135/Wel<br />
135/Bla<br />
135/RPC170<br />
135/Bind1<br />
135/empty<br />
TCP Port 135/1025 (DCE/RPC): Port 135 is the Endpoint Mapper<br />
port on Windows systems [10] and one <strong>of</strong> the entry points to exploit<br />
the infamous Micros<strong>of</strong>t Windows DCOM RPC service buffer overrun<br />
vulnerability [37]. This vulnerability is exploited by the Blaster<br />
worm and the Welchia worm among others.<br />
Figure 9 shows the dominant activities on the port. The Blaster<br />
worm was seen on all three networks, but strangely we only saw<br />
the Welchia worm at LBL. There were also a number <strong>of</strong> empty<br />
connections without follow-ups and a few types <strong>of</strong> probes (e.g.,<br />
135/RPC170) we do not understand well. Comparing the activity<br />
distribution across three networks, the difference is striking and unlike<br />
what we see on other ports. This may be due to 1) lack <strong>of</strong> a<br />
single dominant activity and 2) that certain scanning and exploits<br />
might be targeted or localized.<br />
On port 1025, which is open on a normal Windows XP host, we<br />
see a similar set <strong>of</strong> exploits. Further, DCE/RPC exploits are also<br />
seen on SMB name pipes on port 139 and 445. We will present a<br />
closer look <strong>of</strong> RPC exploit in Section 5.2.2.<br />
TCP Port 139/445 (CIFS): Port 139 is the NetBIOS Session Service<br />
port and is usually used on Windows systems for CIFS (Common<br />
<strong>Internet</strong> File System) [7] over NetBIOS. Port 445 is for CIFS<br />
over TCP and is also known as Micros<strong>of</strong>t-DS. When used for CIFS<br />
sessions, the two ports are almost identical except that NetBIOS<br />
requires an extra step <strong>of</strong> session setup. Sources simultaneously<br />
connecting to both ports prefer port 445 and abandon the port 139<br />
connection. Thus we frequently see empty port 139 connections.<br />
As many Windows services run on top <strong>of</strong> CIFS there are a great<br />
variety <strong>of</strong> exploits we see on these two ports. Figure 3 shows a<br />
snapshot <strong>of</strong> exploits we see on port 445 at the Class A network.<br />
There are basically two kinds <strong>of</strong> activities: 1) buffer-overrun RPC<br />
exploits through named pipes, e.g. the Locator pipe [38] or the<br />
Epmapper pipe (connected to the endpoint mapper service); and<br />
2) access control bypassing followed by attempts to upload executable<br />
files to the target host, e.g. as in exploit 445/Samr-exe.<br />
As shown in Table 7, the Locator pipe exploit dominates port<br />
445 activities at all four networks. Besides that, some sources did<br />
not go beyond the session negotiation step — the first step in a<br />
Activity LBL UW Class A<br />
445/empty 2.4% 1.3% 0.9%<br />
445/Nego 3.3% 2.4% 3.7%<br />
445/Locator 72.7% 89.4% 89.3%<br />
445/Samr-exe 11.6% 1.8% 1.1%<br />
445/Samr 2.7% 0.8% 0.6%<br />
445/Srvsvc 1.1% 0.4% 0.8%<br />
445/Epmapper 0.8% 0.3% 0.0%<br />
Other 5.4% 3.7% 3.5%<br />
Table 7: Port 445 activities<br />
CIFS session. We also see exploits that first connect to the SAMR<br />
(Session Account Manager) pipe, then connect to the SRVSVC<br />
pipe and attempt to create an executable file with names such as<br />
msmsgri.exe(W32 Randex.D) [28] and Micros<strong>of</strong>t.exe [1].<br />
Finally, by connecting to the Epmapper pipe the sources are exploiting<br />
the same vulnerability as on port 135/1025 — note that<br />
this activity is not seen at the Class A network.<br />
On port 139, 75% to 89% <strong>of</strong> source hosts either merely initiate<br />
empty connections or do not go beyond the NetBIOS session setup<br />
stage, and then migrate to port 445; The dominant activity that we<br />
accurately identify are attempts to create files on startup folders after<br />
connecting to the SRVSVC pipe Xi.exe(W32-Xibo) [41].Unlike<br />
port 445, we see few hosts attempting to exploit the buffer<br />
overflows on the Locator or Epmapper pipe. We also see Agobot<br />
variants that connect to the SAMR pipe and drop executables.<br />
TCP Port 6129 (Dameware): Port 6129 is listened by Dameware<br />
Remote Control, an administration tool for Windows systems,<br />
which has a buffer overrun vulnerability in its early versions [36].<br />
The Dameware exploits we see are similar to those <strong>of</strong> published exploit<br />
programs but do not have exactly the same payload. To launch<br />
an exploit, the source host will first send a 40 byte message to probe<br />
operating system version and then ship the exploit payload, which<br />
is almost always 5,096 bytes long.<br />
On Mar 29, 2004, 62% <strong>of</strong> the source hosts that connect to port<br />
6129 at LBL 3 close the connections without sending a byte; another<br />
26% abandoned the connections after sending the probe message;<br />
and we see exploit messages from the remaining 12% (the number<br />
is over 30% on Apr 29). It would be reasonable to question if the<br />
large number <strong>of</strong> abandoned connections suggest that the sources<br />
did not like our responders. However, we also find source hosts<br />
that would first connect with an empty connection and later came<br />
back to send an exploit. Port 6129 is associated with the Agobot<br />
that connects a variety <strong>of</strong> ports (see Section 6.1), and possibilities<br />
are that the bots may connect to a number <strong>of</strong> ports simultaneously<br />
and decide to exploit the port that they receive a response from first.<br />
TCP Port 3127/2745/4751 (Virus Backdoors): Port 3127 and<br />
2745/4751 are known to be the backdoor ports <strong>of</strong> the MyDoom<br />
virus and the Beagle viruses, respectively. On most port 3127 connections,<br />
we see a fixed 5-byte header followed by one or more<br />
Windows executable files uploads. The files are marked by "MZ"<br />
as the first two bytes and contain the string "This program<br />
cannot be run in DOS mode" near head <strong>of</strong> the file. Running<br />
several captured executable files in a closed environment reveals<br />
that the programs scan TCP ports 3127, 135, and 445.<br />
On port 2745, the dominant payload we see at LBL and UW is<br />
the following FTP URL, which comes after exchanging <strong>of</strong> one or<br />
Due to an iSink responder problem we do not have data for the UW and<br />
Class A network.
two short binary messages.<br />
"ftp://bla:bla@:/bot.exe 0"<br />
On the Class A network, however, we do not see a lot <strong>of</strong> port<br />
2745 activities. Interestingly, we see several source hosts that attempt<br />
to upload Windows executables. We also see many hosts that<br />
close the connection after exchange <strong>of</strong> an initial message.<br />
On port 4751, in some cases we see binary upload after echoing a<br />
header, similar to what happens on port 3721, but in most cases we<br />
receive a cryptic 24-byte message, and are unable to elicit further<br />
response by echoing.<br />
TCP Port 1981/4444/9996: (Exploit Follow-Ups): While worms<br />
such as CodeRed and Slammer are contained completely within the<br />
buffer-overrun payload, several <strong>of</strong> the other worms such as Blaster<br />
and Sasser infect victim hosts in two steps. First, the buffer-overrun<br />
payload carries only a piece <strong>of</strong> “shell code” that will listen on a<br />
particular port to accept further commands; Second, the source then<br />
instructs the shell code to download and execute a program from a<br />
remote host. For example, on port 4444, the follow-up port for the<br />
Blaster worm, we <strong>of</strong>ten see:<br />
tftp -i GET msblast.exe<br />
start msblast.exe<br />
msblast.exe<br />
Similarly, on port 1981 (Agobots) and 9996 (Sasser) we see sequences<br />
<strong>of</strong> shell commands to download and execute a bot.exe.<br />
In contrast, there is a different kind <strong>of</strong> shell code called “reverse<br />
shell” which does not listen on any particular port, but instead connects<br />
back to the source host (“phone home”). The port on the<br />
source host can be randomly chosen and is embedded in the shell<br />
code sent to the victim. The Welchia worm uses a reverse shell<br />
(though its random port selection is flawed). This makes it much<br />
harder to capture the contents <strong>of</strong> follow-up connections, because<br />
1) we will have to understand the shell code to find out the “phonehome”<br />
port; and 2) initiating connections from our honeypots violates<br />
the policy <strong>of</strong> the hosting networks.<br />
empty).<br />
UDP Port 53: We expected to see a lot <strong>of</strong> DNS requests, but instead,<br />
find sources sending us non-DNS (or malformed) packets as<br />
shown below:<br />
20:27:43.866952 172.147.151.249.domain > 128.3.x.x.domain: [udp sum ok]<br />
258 [b2&3=0x7] [16323a] [53638q] [9748n] [259au]<br />
Type26904 (Class 13568)? [|domain] (ttl 115, id 12429, len 58)<br />
0x0000 (...)<br />
0x0010 xxxx xxxx 0035 0035 0026 xxxx 0102 0007 ................<br />
0x0020 d186 3fc3 2614 0103 d862 6918 3500 d54c ..?.&....bi.5..L<br />
0x0030 8862 3500 cb1f ee02 3500 .b5.....5.<br />
We do not know what these packets are. These requests dominate<br />
UDP packets observed in the LBL and UW (I,II) networks.<br />
Table 8 provides a summary <strong>of</strong> the DNS activity observed in<br />
the Class A network during a 24 hour trace showing a more diverse<br />
activity. Much like the UW and LBL networks, sources sending<br />
malformed DNS requests dominate. However, in terms <strong>of</strong> packet<br />
counts other queries are substantial. We suspect these are possibly<br />
due to misconfigured DNS server IP addresses on hosts. These<br />
queries are sent to various destination IP addresses and originate<br />
from various networks. Hence it seems unlikely that these are a<br />
result <strong>of</strong> stale DNS entries.<br />
The biggest contributor in terms <strong>of</strong> volume are standard A<br />
queries that resolve IP address for domain names. The SOA packets<br />
are “Start <strong>of</strong> Authority” packets used to register domain authorities.<br />
We observed 45 sources (out <strong>of</strong> total 95) registering different domain<br />
authorities in BGC.net. Other queries include PTR queries<br />
(used for reverse DNS lookups), SRV records (used to specify locations<br />
<strong>of</strong> services) and AAAA queries (IPv6 name resolution).<br />
Type Num packets Num sources<br />
Malformed packets 5755 3616<br />
Standard (A) queries 10139 150<br />
Standard query (SOA) 4059 95<br />
Standard query (PTR) 1281 27<br />
DNS Standard query SRV packets 785 20<br />
DNS Standard query AAAA packets 55 16<br />
DNS Standard unused packets 739 3<br />
DNS Standard unknown packets 1485 3<br />
Table 8: Summary <strong>of</strong> DNS activity seen in the Class A (24<br />
hours)<br />
UDP Port 137: The activities are dominated by NetBIOS standard<br />
name queries (probes).<br />
UDP Port 1026, 1027 (Windows Messenger Pop-Up Spam):<br />
These appear as UDP packets with source port 53 and destination<br />
port 1026 (or 1027). While this port combination typically connotes<br />
a DNS reply, examination <strong>of</strong> packet contents reveal that they<br />
are in fact DCE/RPC requests that exploit a weakness in the Windows<br />
Messenger API to deliver spam messages to unpatched Windows<br />
desktops [40]. Figure 10 shows a trace <strong>of</strong> a typical packet.<br />
The source IP addresses <strong>of</strong> these packets are <strong>of</strong>ten spo<strong>of</strong>ed, as<br />
suggested by the observed ICMP host-unreach backscatter <strong>of</strong><br />
these attacks in the Class A. The choice <strong>of</strong> source port 53 is most<br />
likely to evade firewalls.<br />
05:23:16.964060 13.183.182.178.domain > xxx.xxx.xxx.xxx.1026: 1024 op5<br />
[4097q] 68/68/68 (Class 0) Type0[|domain] (DF)<br />
...<br />
0x0010 .... .... .... .... .... .... 0400 a880 ................<br />
0x0020 1001 000a 000a 000a 0000 0000 0000 0000 ................<br />
0x0030 0000 0000 f891 7b5a 00ff d011 a9b2 00c0 ......{Z........<br />
0x0040 4fb6 e6fc 4ba6 e851 f713 8030 a761 c319 O...K..Q...0.a..<br />
0x0050 13f0 e28c 0000 0000 0100 0000 0000 0000 ................<br />
0x0060 0000 ffff ffff 6400 0000 0000 0c00 0000 ......d.........<br />
0x0070 0000 0000 0c00 0000 5265 616c 2057 6f6d ........Real.Wom<br />
0x0080 656e 0000 0400 0000 0000 0000 0400 0000 en..............<br />
0x0090 596f 7500 3000 0000 0000 0000 3000 0000 You.0.......0...<br />
0x00a0 5741 4e54 2053 4558 3f0d 0a0d 0a46 494e WANT.SEX?....FIN<br />
0x00b0 4420 5553 2041 543a 0d0a 0d0a 0977 7777 D.US.AT:.....www<br />
0x00c0 2exx xxxx xxxx xxxx xx2e 4249 5a0d 0a00 .********.BIZ...<br />
Figure 10: Observed Windows Messenger Pop-Up Spam packets.<br />
UDP Port 1434: The Slammer worm is still alive and is the only<br />
background radiation we see on port 1434.<br />
TCP Port 1433: We have not yet built a detailed responder for<br />
MS-SQL. It appears that most source hosts are trying to log in with<br />
blank passwords.<br />
TCP Port 5000: We do not know enough about this port. The port<br />
is reserved for Universal Plug-and-Play on Windows Systems, but<br />
almost none <strong>of</strong> requests we see are valid HTTP requests. However,<br />
most requests contain a number <strong>of</strong> consecutive 0x90’s (NOP) and<br />
thus look like buffer-overrun exploits.<br />
All the ports we examine above exhibit a modal distribution at<br />
the application semantic level, i.e., they all contain one or a few<br />
dominant elements. The only exception is the DCE/RPC ports,<br />
on which we see some diversity, but in some sense, the various<br />
exploits on DCE/RPC ports have a single dominant element on a<br />
higher level — they target the same vulnerability. As the dominant<br />
elements are quite different from what we see in the normal traffic,<br />
this suggests that we will be able to filter out the majority <strong>of</strong><br />
background radiation traffic with a sound classification scheme at
Number <strong>of</strong> Source Hosts<br />
10000<br />
9000<br />
8000<br />
7000<br />
6000<br />
5000<br />
4000<br />
3000<br />
2000<br />
1000<br />
445/Locator<br />
80/SrchAAA<br />
135/RPC exploit (1464 bytes)<br />
445/Sasser ("lsarpc")<br />
0<br />
0 2 4 6 8 10 12 14 16<br />
Time (day)<br />
Figure 11: The Big Exploits (Apr 20 to May 7, 2004), as observed<br />
on 5 /C networks at LBL. The source hosts are counted<br />
every three hours.<br />
the application semantic level.<br />
5.2 Temporal Distribution <strong>of</strong> Activities<br />
We will examine two cases <strong>of</strong> temporal activity. First, we will<br />
look at the exploits with the largest source population and consider<br />
the distributional variation over time; Second, we look at the exploits<br />
targeted at a particular vulnerability and consider how these<br />
exploits evolve and diversify over time. We will focus on the LBL<br />
network for this analysis.<br />
5.2.1 The Dominant Exploits<br />
Figure 11 shows how the numbers <strong>of</strong> source hosts vary over the<br />
course <strong>of</strong> 18 days for the four exploits with largest source population.<br />
The source volumes for the SrchAAA and Locator exploits are<br />
relatively stable and close to each other over time. This is not<br />
surprising because these exploits are likely coming from the same<br />
worm, as we will see in Section 6.2.<br />
The other two exploits, Exploit1464 and Sasser, show much a<br />
wider range <strong>of</strong> source volume dynamics — this is especially true<br />
for Exploit1464, which temporarily retreated to a much smaller<br />
scale around April 30th.<br />
All four exploits demonstrate a strong diurnal pattern, with obvious<br />
peaks at local time noon. We do not have good explanations<br />
for this pattern. For SrchAAA, Locator, and the Sasser exploits,<br />
the peak might be due to hosts being turned on at daytime and doing<br />
local-biased search. However, for Exploit1464, the steep narrow<br />
peaks lead us to believe they could be caused by the scanning<br />
mechanism itself.<br />
5.2.2 DCE/RPC Exploits<br />
DCE/RPC exploits that target the Micros<strong>of</strong>t DCOM RPC vulnerability<br />
[37] present an interesting case <strong>of</strong> a single well-known<br />
vulnerability being used and reused by various worms and/or autorooters.<br />
This vulnerability is particularly attractive because it exists<br />
on every unpatched Windows 2000/XP system, in contrast to, e.g.<br />
vulnerabilities that exist only on IIS or SQL servers.<br />
We have seen quite a few different exploit payloads in this data.<br />
There are at least 11 different payload lengths. This does not appear<br />
to be result <strong>of</strong> intentional polymorphism, for two reasons: 1) from<br />
almost every single source IP we see only one payload length; and<br />
2) it would be easy to vary the length <strong>of</strong> payload by simply inserting<br />
NOP’s if the adversary wanted to incorporate some polymorphism.<br />
Thus we infer that the diversity <strong>of</strong> payloads is not due to deliberate<br />
polymorphism but due to different code bases. While the payloads<br />
themselves might not be very interesting, since the diversity<br />
is likely due to the various “shell code” they carry, the diversity <strong>of</strong>fers<br />
us an opportunity to look at the rising and ebbing <strong>of</strong> different<br />
exploit programs.<br />
Without a robust way to cluster payloads by contents (payloads<br />
<strong>of</strong> same length sometimes differ on tens to hundreds bytes and the<br />
differences are not merely byte shifting), we choose to cluster the<br />
exploits by lengths and the ports on which they appear, including<br />
port 135/1025 and the Epmapper pipes on port 445/139. Under this<br />
scheme, we see more than 30 different exploit types. We select 9<br />
<strong>of</strong> the popular exploits and consider how the number <strong>of</strong> source IP<br />
addresses for each exploit varies over time during April 2004. The<br />
exploits have 4 different payload lengths: 1448, 1464, 2972, and<br />
2904, and are seen on port 135, 1025, and 445.<br />
We observe strong temporal correlation among exploits <strong>of</strong> the<br />
same length for lengths 2792 and 2904, while this is not the case<br />
for lengths 1448 and 1464. The four exploits also show some correlation<br />
in terms <strong>of</strong> activity to port 135 and to port 445, which is<br />
due to the same source probing both ports. We also find that even<br />
for multiple sources, activity for particular port/length pairs tends<br />
to come in bursty spikes, suggesting synchronized scanning among<br />
the sources.<br />
6. CHARACTERISTICS OF SOURCES<br />
In this section we examine the background radiation activities in<br />
terms <strong>of</strong> source hosts. We associate various activities coming from<br />
the same source IP to construct an “activity vector” for each source<br />
IP, which we then examine in three dimensions: 1) across ports,<br />
2) across destination networks, and 3) over time.<br />
There is a caveat about identifying hosts with IP addresses: due<br />
to DHCP, hosts might be assigned different addresses over time. A<br />
study [21] concluded that “IP addresses are not an accurate measure<br />
<strong>of</strong> the spread <strong>of</strong> a worm on timescales longer than 24 hours”.<br />
However, without a better notion to identify hosts, we will still use<br />
IP addresses to identify hosts, while keeping this caveat in mind.<br />
6.1 Across Ports<br />
Associating activities across ports sometimes gives us a significantly<br />
better picture <strong>of</strong> a source’s goals. This especially helps with<br />
analyzing puzzling activities, because it puts behavior on individual<br />
ports in the context <strong>of</strong> collective activity. For example, simply<br />
looking at an RPC exploit may not readily reveal the worm or autorooter<br />
that sends it, but once we see a follow-up to port 4444 with<br />
"tftp msblast.exe", we know that the earlier exploit comes<br />
from Blaster.<br />
Table 9 provides a summary <strong>of</strong> the top multi-port scanning<br />
episodes seen in the four networks. The most common is sources<br />
that scan both 139 and 445. Many viruses that exploit Net-<br />
BIOS/SMB (CIFS) exhibit this behavior since for propagation the<br />
ports can be used interchangeably. This next most common multiport<br />
source behavior exploits the Micros<strong>of</strong>t DCE/RPC vulnerability<br />
[37] both via port 135 and by connecting to the Epmapper pipe<br />
through port 139 and port 445 during the same episode. These are<br />
likely variants <strong>of</strong> Welchia. Most port 5000 connections are empty<br />
and the rest small portion <strong>of</strong> them look like buffer overrun exploits.<br />
We also find Agobot variants that occasionally target these services.<br />
They connect to the SAMR pipe through CIFS to obtain registry information,<br />
following the sequence described in Figure 4 and drop<br />
the file mdms.exe into one <strong>of</strong> the startup folders. The least common<br />
pr<strong>of</strong>iles are used exclusively by Agobot variants (I, II and III).
Number <strong>of</strong> Sources (per hour)<br />
10000<br />
8000<br />
6000<br />
4000<br />
2000<br />
1025<br />
6129<br />
2745<br />
135<br />
3127<br />
Number <strong>of</strong> Sources (per hour)<br />
10000<br />
8000<br />
6000<br />
4000<br />
2000<br />
1025<br />
6129<br />
2745<br />
135<br />
3127<br />
0<br />
Mar-26 Mar-27 Mar-28 Mar-29 Mar-30<br />
0<br />
Mar-26 Mar-27 Mar-28 Mar-29 Mar-30<br />
Date (Month-Day)<br />
Date (Month-Day)<br />
(a) Agobot Sources: UW I<br />
(b) Agobot Sources: UW II<br />
Figure 12: Time series <strong>of</strong> activity on Agobot ports in the two UW /19 networks (on adjacent Class B networks)<br />
Name Ports Description LBL UW I UW II Class A<br />
num sources (rank) num sources (rank) num sources(rank) num sources (rank)<br />
NB-1 139,445 Xi.exe (W32-Xibo), 4,310 (1) 4,300 (1) 4,313 (1) 7,408 (1)<br />
msmsgri32.exe (Randex.D),<br />
Antivirus32.exe (SDBot.JW)<br />
NB-EP1 135,139,445 EP-2704, mdms.exe(Agobot) 1,187 (2) 1,028 (2) 1,046 (2) 537(4)<br />
NB-EP2 135,139,445,5000 EP-2792, EP-2904 780 (3) 678(3) 721(3) 15<br />
Agobot-1 1025,1981,2745,6129 Agobot variant-I 16 452 (4) 68(10) 0<br />
Agobot-2 1025,2745,6129 Agobot variant-II 1 437 (5) 3 0<br />
Agobot-3 80,139,1025, Agobot variant-III 0 415 (6) 0 0<br />
2745,6129<br />
Table 9: 24 hours <strong>of</strong> multi-port source activity at the four sites<br />
We can examine the spatial variance <strong>of</strong> multi-port pr<strong>of</strong>iles by<br />
comparing the data collected at each network during the same<br />
24 hour period. We order the pr<strong>of</strong>iles based on the ranks <strong>of</strong> all<br />
multi-port pr<strong>of</strong>iles collected at the UW I network, which showed<br />
the greatest affinity to Agobot. The table reveals several notable<br />
observations. First, the top two exploits are extensively observed<br />
across all four networks and their rankings are consistent in the<br />
Class B networks — a spatial invariant. Second, although the LBL<br />
network is much smaller, it observes the same number <strong>of</strong> sources<br />
as the other two UW networks for the top three exploits. This is<br />
probably due to the fact that the networks belong to the same /8,<br />
and suggests that these multi-port sources <strong>of</strong>ten sweep the address<br />
space. Third, UW I receives many more Agobot scans than the<br />
other networks, though we don’t know why.<br />
We explore Agobot scans in greater detail in Figure 12. The figures<br />
show the volume <strong>of</strong> unique sources per hour on several <strong>of</strong> the<br />
Agobot ports during a five day period in March at the two adjacent<br />
UW networks. The graph at UW I shows four visible spikes,<br />
indicating an Agobot attack. While UW II background radiation<br />
seems to otherwise closely follow UW I, these Agobot spikes are<br />
peculiarly absent. These graphs also provide a temporal perspective<br />
on the growth <strong>of</strong> Agobot, with a striking daily spike-followed-bydecay<br />
pattern, presumably as new machines are cleaned up over the<br />
course <strong>of</strong> the day.<br />
We see little Agobot on the Class A network. This likely reflects<br />
Agobot’s “maturity” as malwares go. It has gone through iterative<br />
enhancements and likely has (essentially) “evolved” to have<br />
Activity LBL UW Class A LBL UW LBL Class A<br />
All 31K 276K 582K 15K 6.5K<br />
Srch+Loc 76% 85% 57% 75% 91%<br />
Samr-exe 1,601 2,111 2,012 1,634 116<br />
Witty 72 241 162 61 18<br />
Table 10: Traffic from sources seen across networks: intersections<br />
vs. individual networks<br />
been programmed to avoid telescopes; or perhaps it has become<br />
equipped with list <strong>of</strong> target networks, or the scanning is being consciously<br />
focused by a human operator via IRC control channels.<br />
6.2 Sources Seen Across Networks<br />
We now consider sets <strong>of</strong> source hosts seen on multiple networks<br />
at approximately the same time. We analyze source IPs seen across<br />
networks on an arbitrarily chosen day (Mar 29 GMT), characterizing<br />
them in terms <strong>of</strong>: 1) How many such source hosts are there?<br />
2) Do they send the same traffic to different networks? 3) What<br />
does the activity distribution look like? and 4) how does it compare<br />
to the distribution on individual networks?<br />
As shown in Table 10, source IPs seen at LBL and UW have a<br />
surprisingly large intersection set—almost half the source IPs seen<br />
at LBL are also seen at UW. In contrast, the intersection <strong>of</strong> LBL<br />
and the Class A is much smaller, even though we are seeing many
Mar 29 Mar 30 Apr 29 1-Day 1-Month<br />
All 31K 30K 62K 1,513 680<br />
Srch+Loc 76% 83% 42% 68% 85%<br />
Witty 72 64 0 15 0<br />
Blaster 30 31 24 8 7<br />
Table 11: Traffic from sources seen over time: intersections vs.<br />
individual periods<br />
more source IPs at the Class A than at UW. 4 This contrast may be<br />
due to some sources avoiding the Class A networks, and also the<br />
proximity <strong>of</strong> LBL and UW in the IP address space.<br />
The next evaluation is to confirm that a given source indeed sends<br />
the same traffic to the different networks. We extract an activity<br />
vector for each source IP on the LBL and UW networks and compare,<br />
finding that indeed this is the case, with one peculiarity: while<br />
several thousand SrchAAA and Locator sources are common, we<br />
also find nearly two thousand Locator-only sources at one network<br />
that are SrchAAA-only sources at the other. This turns out to be due<br />
to the interaction between source-destination filtering and the scanning<br />
mechanism <strong>of</strong> the SrchAAA/Locator sources. These sources<br />
choose, apparently randomly, to send either SrchAAA or Locator<br />
to a given destination, but not both.<br />
Finally, what does the activity pr<strong>of</strong>ile <strong>of</strong> a given source tell us<br />
about how likely we are to see it elsewhere? As shown in Table<br />
10, sources exhibiting the dominant activity pr<strong>of</strong>ile—SrchAAA<br />
and Locator—are <strong>of</strong>ten seen at multiple locations in the network.<br />
On the other hand, Samr-exe and Witty present an interesting case.<br />
The Samr-exe sources we see in the intersection <strong>of</strong> LBL and UW<br />
are more than what we find at LBL alone! (1,634 vs 1,601) This<br />
seeming inconsistency is caused by a number <strong>of</strong> source hosts not<br />
completing the exploit when contacting LBL, and thus not being<br />
identified there, but doing so at UW. In addition, the Samr-exe population<br />
seen at UW is merely 2,061 (0.7%), so we see a surprisingly<br />
large overlap for it between LBL and UW. On the other hand, LBL<br />
and the Class A have only 116 Samr-exe sources in common, out<br />
<strong>of</strong> more than 2,000 seen on the Class A, suggesting that Samr-exe<br />
sources scan with a local bias.<br />
6.3 Sources Seen Over Time<br />
To characterize sources seen at the same network over time, we<br />
analyze activity seen at LBL on three days: March 29, March 30,<br />
and April 29. This gives us comparisons for adjacent days and one<br />
month apart, respectively. Table 11 characterizes the variation. We<br />
see that the intersection <strong>of</strong> source hosts—even in the case <strong>of</strong> only<br />
one day apart—is much smaller than the intersection across networks.<br />
While this is partly because the UW network is larger than<br />
LBL, looking at the set <strong>of</strong> sources seen on another LBL network<br />
<strong>of</strong> the same size on March 29 we find more than 5,000 hosts in<br />
common. This confirms that we tend to see a larger intersection<br />
<strong>of</strong> source IPs across networks than over time. One effect we have<br />
not controlled for here, however, is DHCP artifacts: a host might<br />
be assigned different addresses on different days. We also note that<br />
one month’s time does not greatly further reduce the intersection<br />
size, suggesting that if a host does not have the DHCP artifact, then<br />
it tends to stay in the intersection. The initial steep decaying <strong>of</strong><br />
source IP sets also suggest that it will be easier to track a (malicious)<br />
host across space than across time.<br />
Since we only see ICMP Unreachable backscatter only on the Class A<br />
<br />
network, and these constitute a significant number <strong>of</strong> source IPs, here we<br />
exclude them from the comparison to avoid skewing the activity distribution.<br />
The number <strong>of</strong> source hosts seen over time also varies by activity.<br />
For example, Witty did not persist over a month (nor could<br />
it, as it was a rare instance <strong>of</strong> a worm that deliberately damages<br />
its host); Blaster’s grip on hosts is quite tenacious; and the SrchAAA/Locator<br />
sources fall in between.<br />
7. SUMMARY<br />
Previous studies <strong>of</strong> <strong>Internet</strong> traffic have identified a number <strong>of</strong><br />
now well-established properties: diurnal cycles in volume; variability<br />
in mix across sites and over time; bursty arrivals; the ubiquity<br />
<strong>of</strong> heavy-tailed distributions. Over the past several years, however,<br />
an important new dimension <strong>of</strong> <strong>Internet</strong> traffic has emerged,<br />
and it has done so without any systematic observation or characterization.<br />
The gross features <strong>of</strong> this new breed <strong>of</strong> traffic are that<br />
it is complex in structure, highly automated, frequently malicious,<br />
potentially adversarial, and mutates at a rapid pace. Each <strong>of</strong> these<br />
characteristics motivates the need for a deeper understanding <strong>of</strong> this<br />
“unwanted” traffic.<br />
We have presented an initial study <strong>of</strong> the broad characteristics <strong>of</strong><br />
<strong>Internet</strong> background radiation. Our evaluation is based on traffic<br />
measurements from four large, unused subnets within the IPv4 address<br />
space. We developed filtering techniques and active responders<br />
to use in our monitoring, analyzing both the characteristics <strong>of</strong><br />
completely unsolicited traffic (passive analysis) and the details <strong>of</strong><br />
traffic elicited by our active responses (activities analysis).<br />
Passive analysis demonstrates both the prevalence and variability<br />
<strong>of</strong> background radiation. Evaluation <strong>of</strong> destination ports reveals<br />
that the vast majority <strong>of</strong> traffic targets services with frequentlyexploited<br />
vulnerabilities. Analysis <strong>of</strong> backscatter traffic shows the<br />
overall dominance <strong>of</strong> TCP SYN-ACK/RST packets, but otherwise<br />
we do not find a great deal <strong>of</strong> consistency across the monitored<br />
subnets.<br />
Our activities analysis focused on the most popular services targeted<br />
by background radiation, finding a rich variegation. Activities<br />
across all <strong>of</strong> the monitored services include new worms released<br />
during our study, vestiges <strong>of</strong> old worms such as Code Red<br />
and Nimda, the frequent presence <strong>of</strong> “autorooter” scans (similar to<br />
worms, but without self-propagation), and a noticeable number <strong>of</strong><br />
connections that are simply empty even when given an opportunity<br />
to send data. As with the passive analysis, we find significant<br />
diversity across the subnets we monitored, and also over time.<br />
We also examined background radiation from the perspective <strong>of</strong><br />
source host behavior. Considering source activities across ports<br />
reveals consistent behavior in each <strong>of</strong> the measurement sites for<br />
the most prevalent multi-port scan type (scans to both ports 139<br />
and 445). Furthermore, there was an appreciable intersection <strong>of</strong><br />
sources across measurement sites. This can be explained by the<br />
random scanning behavior <strong>of</strong> worms like Welchia. However, there<br />
was a much smaller set <strong>of</strong> sources common to all measurement sites<br />
when they are considered over time.<br />
Perhaps the most striking result <strong>of</strong> our analysis is the extreme<br />
dynamism in many aspects <strong>of</strong> background radiation. Unlike benign<br />
traffic, which only shows major shifts in constituency when<br />
new applications become popular (which happens on fairly lengthy<br />
time scales), the mix <strong>of</strong> background radiation sometimes changes<br />
on a nearly-daily basis. This dynamism results in a potpourri <strong>of</strong><br />
connection-level behavior, packet payloads, and activity sessions<br />
seen in different regions <strong>of</strong> the address space.<br />
Our efforts have implications for both the research and operational<br />
communities. The ubiquity <strong>of</strong> background radiation presents<br />
significant difficulties for those who monitor <strong>Internet</strong> traffic: it can<br />
clog stateful analyzers with uninteresting activity, and due to its variety<br />
it can significantly complicate the detection <strong>of</strong> new types <strong>of</strong>
activity (for example, a new worm using the same port as existing<br />
worms). It is clear from the highly diverse and dynamic activity we<br />
have found that further work is needed to both assess the evolution<br />
<strong>of</strong> background radiation over time and to develop more detailed<br />
characterizations. We believe that our framework—prefiltering the<br />
traffic, using lightweight responders to engage sources in enough<br />
detail to categorize them, analyzing the resulting traffic along the<br />
axes we have explored—is an important first step towards comprehensively<br />
studying this new phenomenon.<br />
Acknowledgments<br />
Our thanks to the System and Network Security group and the network<br />
operations staff <strong>of</strong> the Lawrence Berkeley National Laboratory<br />
for hosting the LBL monitoring setup. We are grateful to Dave<br />
Plonka, Jeff Bartig, Ge<strong>of</strong>f Horne and Bill Jensen for their continuing<br />
support <strong>of</strong> the iSink project. We would also like to thank Niels<br />
Provos for his help in setting up the Honeyd monitor at LBL, and<br />
the anonymous reviewers for their constructive critiques.<br />
This work was supported by ARO grant DAAD19-02-1-0304,<br />
NSF grant CCR-0325653, NSF grant ITR/ANI-0205519 and NSF<br />
grant ANI-0335214.<br />
8. REFERENCES<br />
[1] W32 Agobot IB. http://www.sophos.com/virusinfo/analyses/<br />
trojagobotib.html.<br />
[2] C. Anley. Creating arbitrary shellcode in unicode expanded strings,<br />
January 2002. http://www.nextgenss.com/papers/unicodebo.pdf.<br />
[3] M. Arlitt and C. Williamson. Web server workload characterization:<br />
The search for invariants. In Proceedings <strong>of</strong> SIGMETRICS,<br />
Philadelphia, May 1996.<br />
[4] L. Baldwin, P. Sloss, and S. Friedl. Iraqi Trace.<br />
http://www.mynetwatchman.com/kb/security/articles/iraqiworm<br />
/iraqitrace.htm.<br />
[5] W32 Beagle.J. http://securityresponse.symantec.com/avcenter/venc/<br />
data/w32.beagle.j@mm.html.<br />
[6] B. Caswell and M. Roesch. The SNORT network intrusion detection<br />
system. http://www.snort.org, April 2004.<br />
[7] Common <strong>Internet</strong> File System. http://www.snia.org/tech activities/<br />
CIFS/CIFS-TR-1p00 FINAL.pdf.<br />
[8] M. Dacier, F. Pouget, and H. Debar. Attack processes found on the<br />
internet. In Proceedings <strong>of</strong> NATO Symposium, 2004.<br />
[9] P. Danzig, S. Jamin, R. Cáceres, D. Mitzel, , and D. Estrin. An<br />
empirical workload model for driving wide-area TCP/IP network<br />
simulations. <strong>Internet</strong>working: Research and Experience, 3:1-26,<br />
1992.<br />
[10] DCE 1.1: Remote procedure call. http://www.opengroup.org/<br />
onlinepubs/9629399/toc.htm.<br />
[11] Flowreplay Design Notes. http://www.synfin.net/papers/flowreplay.pdf.<br />
[12] B. Greene. BGPv4 Security Risk Assessment, June 2002.<br />
[13] The Honeynet Project. http://project.honeynet.org, 2003.<br />
[14] J. Jung, V. Paxson, A. Berger, , and H. Balakrishnan. Fast portscan<br />
detectionusing sequential hypothesis testing. In Proceedings <strong>of</strong> the<br />
IEEE Symposium on Security and Privacy, Oakland, CA, May 2004.<br />
[15] H. Kim and B. Karp. Autograph: Toward automated, distributed<br />
worm signature detection. In 13 USENIX Security Symposium, San<br />
Diego, California, August 2004.<br />
[16] E. Kohler, R. Morris, B. Chen, J. Jannotti, and F. Kaashoek. The<br />
click modular router. ACM Transactions on <strong>Computer</strong> Systems,<br />
18(3), August 2000.<br />
[17] C. Kreibich and J. Crowcr<strong>of</strong>t. Honeycomb–creating intrusion<br />
detection signatures using honeypots. In 2 Workshop on Hot<br />
Topics in Networks (Hotnets-II), Cambridge, Massachusetts,<br />
November 2003.<br />
[18] D. Moore. Network telescopes: Observing small or distant security<br />
events. Invited Presentation at the 11th USENIX Security<br />
Symposium, 2002.<br />
[19] D. Moore, V. Paxson, S. Savage, C. Shannon, S. Staniford, and<br />
N. Weaver. Inside the slammer worm. In Proceedings <strong>of</strong> IEEE<br />
Security and Privacy, June 2003.<br />
[20] D. Moore, V. Paxson, S. Savage, C. Shannon, S. Staniford, and<br />
N. Weaver. The spread <strong>of</strong> the sapphire/slammer worm.<br />
http://www.caida.org/outreach/papers/2003/sapphire/sapphire.html,<br />
2003.<br />
[21] D. Moore, C. Shannon, and J. Brown. Code red: A case study on the<br />
spread and victims <strong>of</strong> an internet worm. In Proceedings <strong>of</strong> ACM<br />
SIGCOMM <strong>Internet</strong> Measurement Workshop, November 2002.<br />
[22] D. Moore, C. Shannon, G. Voelker, and S. Savage. <strong>Internet</strong><br />
quarantine: Requirements for containing self-propagating code. In<br />
Proceedings <strong>of</strong> IEEE INFOCOM, April 2003.<br />
[23] D. Moore, G. Voelker, and S. Savage. Inferring internet denial <strong>of</strong><br />
service activity. In Proceedings <strong>of</strong> the 2001 USENIX Security<br />
Symposium, Washington D.C., August 2001.<br />
[24] W32 Mydoom.A@mm. http://securityresponse.symantec.com/<br />
avcenter/venc/data/w32.mydoom.a@mm.html.<br />
[25] V. Paxson. Empirically-derived analytic models <strong>of</strong> wide-area tcp<br />
connections. IEEE/ACM Transactions on Networking, 2:316-336,<br />
1994.<br />
[26] V. Paxson. Bro: A system for detecting network intruders in real<br />
time. <strong>Computer</strong> Networks, December 1999.<br />
[27] N. Provos. The Honeyd Virtual Honeypot. http://www.honeyd.org,<br />
2003.<br />
[28] W32 Randex.D. http://www.liutilities.com/products/wintaskspro/<br />
processlibrary/msmsgri32.<br />
[29] M. Roesch. Snort: Lightweight intrusion detection for networks. In<br />
Proceedings <strong>of</strong> USENIX LISA, 1999.<br />
[30] W32 Sasser.Worm. http://securityresponse.symantec.com/avcenter/<br />
venc/data/w32.sasser.worm.html.<br />
[31] Security Focus. Micros<strong>of</strong>t IIS 5.0 “translate: f” source disclosure<br />
vulnerability. http://www.securityfocus.com/bid/1578/discussion/, April<br />
2004.<br />
[32] S. Singh, C. Estan, G. Varghese, and S. Savage. The Earlybird system<br />
for real-time detection <strong>of</strong> unknown worms. Technical Report<br />
CS2003-0761, University <strong>of</strong> California, San Diego, August 2003.<br />
[33] S. Staniford, V. Paxson, and N. Weaver. How to 0wn the <strong>Internet</strong> in<br />
Your Spare Time. In Proceedings <strong>of</strong> the 11th USENIX Security<br />
Symposium, 2002.<br />
[34] K. Thompson, G. Miller, and R. Wilder. Wide area <strong>Internet</strong> traffic<br />
patterns and characteristics. IEEE Network, 11(6):10–23, November<br />
1997.<br />
[35] Make your richer! Get more money easily! http://www.per.rcpt.to/lists/<br />
rlinetd/msg01850.html.<br />
[36] DameWare Mini Remote Control Server 3.72 buffer overflow.<br />
http://www.securityfocus.com/archive/1/347576.<br />
[37] Micros<strong>of</strong>t Windows DCOM RPC interface buffer overrun<br />
vulnerability (MS03-026). http://www.securityfocus.com/bid/8205.<br />
[38] Micros<strong>of</strong>t Windows Locator Service buffer overflow vulnerability<br />
(MS03-001). http://www.securityfocus.com/bid/6666.<br />
[39] Micros<strong>of</strong>t Windows 2000 WebDAV buffer overflow vulnerability<br />
(MS03-007). http://www.securityfocus.com/bid/7116.<br />
[40] Windows Messenger Popup Spam. http://www.lurhq.com/<br />
popup spam.html.<br />
[41] W32 Xibo. http://www.sophos.com/virusinfo/analyses/w32xiboa.html.<br />
[42] V. Yegneswaran, P. Barford, and D. Plonka. On the design and use <strong>of</strong><br />
internet sinks for network abuse monitoring. In Proceedings <strong>of</strong><br />
Recent Advances in Intrusion Detection, 2004.<br />
[43] V. Yegneswaran, P. Barford, and J. Ullrich. <strong>Internet</strong> intrusions:<br />
Global characteristics and prevalence. In Proceedings <strong>of</strong> ACM<br />
SIGMETRICS, June 2003.