Seven Degrees of Separation in Mobile Ad Hoc Networks - ICS
Seven Degrees of Separation in Mobile Ad Hoc Networks - ICS
Seven Degrees of Separation in Mobile Ad Hoc Networks - ICS

Create successful ePaper yourself
Turn your PDF publications into a flip-book with our unique Google optimized e-Paper software.
Average Delay (sec)<br />
400<br />
300<br />
Users # =10<br />
Users # =5<br />
Users # =25<br />
Users # =15<br />
Time (sec)<br />
700<br />
600<br />
500<br />
200<br />
400<br />
100<br />
300<br />
0<br />
0 50 100 150<br />
Query Interval (sec)<br />
200<br />
10 20 30 40 50<br />
Num Users<br />
Fig. 1. Averagedelay <strong>of</strong> a mobile to get the data for different population<br />
size and query <strong>in</strong>tervals.<br />
Time (sec)<br />
800<br />
600<br />
400<br />
200<br />
#Users 5<br />
#Users 10<br />
#Users 15<br />
#Users 25<br />
0 50 100 150<br />
Query Interval (sec)<br />
Fig. 2. Average delay for the data to spread among all users as a function<br />
<strong>of</strong> the population and the query <strong>in</strong>terval.<br />
becomes dataholder. As the query <strong>in</strong>terval <strong>in</strong>creases the average<br />
delay for the mobile host to get the data <strong>in</strong>creases almost<br />
l<strong>in</strong>early. In addition, the larger is the population size the faster<br />
a user gets the data.<br />
Fig. 2 illustrates similar behavior for the time data spreads<br />
among mobile users. We f<strong>in</strong>d that <strong>in</strong> a sett<strong>in</strong>g with 25 mobiles,<br />
with<strong>in</strong> 64 s the data will be propagated among all the mobile<br />
users, assum<strong>in</strong>g a query <strong>in</strong>terval <strong>of</strong> 1.5 s. Also, the average<br />
delay is only 12 s. For a query <strong>in</strong>terval <strong>of</strong> 180 s, it takes 436 s.<br />
For less popular data item, e.g., for five mobiles with a query<br />
period <strong>of</strong> 1.5 s, the propagation time (to all the users) is 643 s.<br />
In that case, the average delay for a user to acquire the data is<br />
354 s.<br />
We fix the query <strong>in</strong>terval at 60 s. Fig. 3 illustrates the average<br />
delay for the data to propagate among all the mobiles as a<br />
function <strong>of</strong> the population size <strong>in</strong> the system. As expected, as<br />
the population size <strong>in</strong>creases the delay decreases. This is due<br />
to the fact that, as the population size <strong>in</strong>creases, dataholders<br />
will come <strong>in</strong> close proximity with a larger number <strong>of</strong> mobiles<br />
and therefore the data propagation will be faster. For population<br />
size , ¢¡¤£¦¥ , the decrease is more rapid, and when<br />
reaches 25 the slope becomes smaller.<br />
Subway Model<br />
Fig. 3. Average time for the data to propagate among all users as a<br />
function <strong>of</strong> the population. The query<strong>in</strong>g period is 60s.<br />
Number <strong>of</strong> Data Holders (%)<br />
80<br />
70<br />
60<br />
50<br />
40<br />
30<br />
0 100 200 300 400<br />
Query Interval (sec)<br />
1/λ<br />
180<br />
120<br />
110<br />
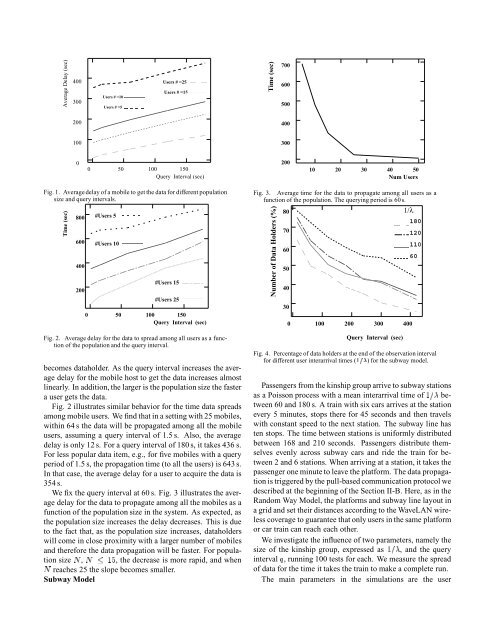
Fig. 4. Percentage <strong>of</strong> data holders at the end <strong>of</strong> the observation <strong>in</strong>terval<br />
for different user <strong>in</strong>terarrival times (§©¨ ) for the subway model.<br />
Passengers from the k<strong>in</strong>ship group arrive to subway stations<br />
as a Poisson process with a mean <strong>in</strong>terarrival time <strong>of</strong> £ between<br />
60 and 180 s. A tra<strong>in</strong> with six cars arrives at the station<br />
every 5 m<strong>in</strong>utes, stops there for 45 seconds and then travels<br />
with constant speed to the next station. The subway l<strong>in</strong>e has<br />
ten stops. The time between stations is uniformly distributed<br />
between 168 and 210 seconds. Passengers distribute themselves<br />
evenly across subway cars and ride the tra<strong>in</strong> for between<br />
2 and 6 stations. When arriv<strong>in</strong>g at a station, it takes the<br />
passenger one m<strong>in</strong>ute to leave the platform. The data propagation<br />
is triggered by the pull-based communication protocol we<br />
described at the beg<strong>in</strong>n<strong>in</strong>g <strong>of</strong> the Section II-B. Here, as <strong>in</strong> the<br />
Random Way Model, the platforms and subway l<strong>in</strong>e layout <strong>in</strong><br />
a grid and set their distances accord<strong>in</strong>g to the WaveLAN wireless<br />
coverage to guarantee that only users <strong>in</strong> the same platform<br />
or car tra<strong>in</strong> can reach each other.<br />
We <strong>in</strong>vestigate the <strong>in</strong>fluence <strong>of</strong> two parameters, namely the<br />
size <strong>of</strong> the k<strong>in</strong>ship group, expressed as £ , and the query<br />
<strong>in</strong>terval , runn<strong>in</strong>g 100 tests for each. We measure the spread<br />
<strong>of</strong> data for the time it takes the tra<strong>in</strong> to make a complete run.<br />
The ma<strong>in</strong> parameters <strong>in</strong> the simulations are the user<br />
60