Adaptive AM–FM Signal Decomposition With Application to ... - ICS
Adaptive AM–FM Signal Decomposition With Application to ... - ICS
Adaptive AM–FM Signal Decomposition With Application to ... - ICS

You also want an ePaper? Increase the reach of your titles
YUMPU automatically turns print PDFs into web optimized ePapers that Google loves.
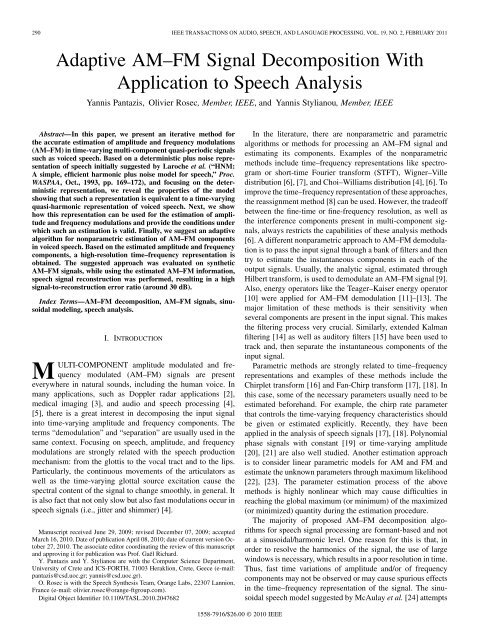
290 IEEE TRANSACTIONS ON AUDIO, SPEECH, AND LANGUAGE PROCESSING, VOL. 19, NO. 2, FEBRUARY 2011<br />
<strong>Adaptive</strong> <strong>AM–FM</strong> <strong>Signal</strong> <strong>Decomposition</strong> <strong>With</strong><br />
<strong>Application</strong> <strong>to</strong> Speech Analysis<br />
Yannis Pantazis, Olivier Rosec, Member, IEEE, and Yannis Stylianou, Member, IEEE<br />
Abstract—In this paper, we present an iterative method for<br />
the accurate estimation of amplitude and frequency modulations<br />
(<strong>AM–FM</strong>) in time-varying multi-component quasi-periodic signals<br />
such as voiced speech. Based on a deterministic plus noise representation<br />
of speech initially suggested by Laroche et al. (“HNM:<br />
A simple, efficient harmonic plus noise model for speech,” Proc.<br />
WASPAA, Oct., 1993, pp. 169–172), and focusing on the deterministic<br />
representation, we reveal the properties of the model<br />
showing that such a representation is equivalent <strong>to</strong> a time-varying<br />
quasi-harmonic representation of voiced speech. Next, we show<br />
how this representation can be used for the estimation of amplitude<br />
and frequency modulations and provide the conditions under<br />
which such an estimation is valid. Finally, we suggest an adaptive<br />
algorithm for nonparametric estimation of <strong>AM–FM</strong> components<br />
in voiced speech. Based on the estimated amplitude and frequency<br />
components, a high-resolution time–frequency representation is<br />
obtained. The suggested approach was evaluated on synthetic<br />
<strong>AM–FM</strong> signals, while using the estimated <strong>AM–FM</strong> information,<br />
speech signal reconstruction was performed, resulting in a high<br />
signal-<strong>to</strong>-reconstruction error ratio (around 30 dB).<br />
Index Terms—<strong>AM–FM</strong> decomposition, <strong>AM–FM</strong> signals, sinusoidal<br />
modeling, speech analysis.<br />
I. INTRODUCTION<br />
MULTI-COMPONENT amplitude modulated and frequency<br />
modulated (<strong>AM–FM</strong>) signals are present<br />
everywhere in natural sounds, including the human voice. In<br />
many applications, such as Doppler radar applications [2],<br />
medical imaging [3], and audio and speech processing [4],<br />
[5], there is a great interest in decomposing the input signal<br />
in<strong>to</strong> time-varying amplitude and frequency components. The<br />
terms “demodulation” and “separation” are usually used in the<br />
same context. Focusing on speech, amplitude, and frequency<br />
modulations are strongly related with the speech production<br />
mechanism: from the glottis <strong>to</strong> the vocal tract and <strong>to</strong> the lips.<br />
Particularly, the continuous movements of the articula<strong>to</strong>rs as<br />
well as the time-varying glottal source excitation cause the<br />
spectral content of the signal <strong>to</strong> change smoothly, in general. It<br />
is also fact that not only slow but also fast modulations occur in<br />
speech signals (i.e., jitter and shimmer) [4].<br />
Manuscript received June 29, 2009; revised December 07, 2009; accepted<br />
March 16, 2010. Date of publication April 08, 2010; date of current version Oc<strong>to</strong>ber<br />
27, 2010. The associate edi<strong>to</strong>r coordinating the review of this manuscript<br />
and approving it for publication was Prof. Gaël Richard.<br />
Y. Pantazis and Y. Stylianou are with the Computer Science Department,<br />
University of Crete and <strong>ICS</strong>-FORTH, 71003 Heraklion, Crete, Geece (e-mail:<br />
pantazis@csd.uoc.gr; yannis@csd.uoc.gr).<br />
O. Rosec is with the Speech Synthesis Team, Orange Labs, 22307 Lannion,<br />
France (e-mail: olivier.rosec@orange-ftgroup.com).<br />
Digital Object Identifier 10.1109/TASL.2010.2047682<br />
In the literature, there are nonparametric and parametric<br />
algorithms or methods for processing an <strong>AM–FM</strong> signal and<br />
estimating its components. Examples of the nonparametric<br />
methods include time–frequency representations like spectrogram<br />
or short-time Fourier transform (STFT), Wigner–Ville<br />
distribution [6], [7], and Choi–Williams distribution [4], [6]. To<br />
improve the time–frequency representation of these approaches,<br />
the reassignment method [8] can be used. However, the tradeoff<br />
between the fine-time or fine-frequency resolution, as well as<br />
the interference components present in multi-component signals,<br />
always restricts the capabilities of these analysis methods<br />
[6]. A different nonparametric approach <strong>to</strong> <strong>AM–FM</strong> demodulation<br />
is <strong>to</strong> pass the input signal through a bank of filters and then<br />
try <strong>to</strong> estimate the instantaneous components in each of the<br />
output signals. Usually, the analytic signal, estimated through<br />
Hilbert transform, is used <strong>to</strong> demodulate an <strong>AM–FM</strong> signal [9].<br />
Also, energy opera<strong>to</strong>rs like the Teager–Kaiser energy opera<strong>to</strong>r<br />
[10] were applied for <strong>AM–FM</strong> demodulation [11]–[13]. The<br />
major limitation of these methods is their sensitivity when<br />
several components are present in the input signal. This makes<br />
the filtering process very crucial. Similarly, extended Kalman<br />
filtering [14] as well as audi<strong>to</strong>ry filters [15] have been used <strong>to</strong><br />
track and, then separate the instantaneous components of the<br />
input signal.<br />
Parametric methods are strongly related <strong>to</strong> time–frequency<br />
representations and examples of these methods include the<br />
Chirplet transform [16] and Fan-Chirp transform [17], [18]. In<br />
this case, some of the necessary parameters usually need <strong>to</strong> be<br />
estimated beforehand. For example, the chirp rate parameter<br />
that controls the time-varying frequency characteristics should<br />
be given or estimated explicitly. Recently, they have been<br />
applied in the analysis of speech signals [17], [18]. Polynomial<br />
phase signals with constant [19] or time-varying amplitude<br />
[20], [21] are also well studied. Another estimation approach<br />
is <strong>to</strong> consider linear parametric models for AM and FM and<br />
estimate the unknown parameters through maximum likelihood<br />
[22], [23]. The parameter estimation process of the above<br />
methods is highly nonlinear which may cause difficulties in<br />
reaching the global maximum (or minimum) of the maximized<br />
(or minimized) quantity during the estimation procedure.<br />
The majority of proposed <strong>AM–FM</strong> decomposition algorithms<br />
for speech signal processing are formant-based and not<br />
at a sinusoidal/harmonic level. One reason for this is that, in<br />
order <strong>to</strong> resolve the harmonics of the signal, the use of large<br />
windows is necessary, which results in a poor resolution in time.<br />
Thus, fast time variations of amplitude and/or of frequency<br />
components may not be observed or may cause spurious effects<br />
in the time–frequency representation of the signal. The sinusoidal<br />
speech model suggested by McAulay et al. [24] attempts<br />
1558-7916/$26.00 © 2010 IEEE
PANTAZIS et al.: ADAPTIVE <strong>AM–FM</strong> SIGNAL DECOMPOSITION WITH APPLICATION TO SPEECH ANALYSIS 291<br />
<strong>to</strong> balance the time and frequency resolution requests of speech<br />
signals by choosing the length of the analysis window and the<br />
frame rate. However, when fast transitions occur in amplitude<br />
and/or in frequency, the sinusoidal model is inadequate for<br />
tracking the <strong>AM–FM</strong> components of the signal, since this<br />
model assumes speech stationarity within an analysis frame.<br />
In this paper, we suggest an adaptive method for estimating<br />
the instantaneous components of voiced speech signals. The<br />
suggested approach can also be applied <strong>to</strong> other time-varying<br />
multi-component <strong>AM–FM</strong> signals like music signals, signals<br />
(or calls) generated by marine mammals, birds, etc. The suggested<br />
method is based on a model initially introduced by<br />
Laroche et al. for audio modeling of percussive sounds [25]<br />
and for speech analysis [1]. In [26], the model was reintroduced<br />
revealing its main properties: it was shown that the model is<br />
equivalent <strong>to</strong> a time-varying quasi-harmonic representation<br />
of speech. In the following, this model will be referred <strong>to</strong> as<br />
Quasi-Harmonic Model (QHM).<br />
In this paper, we first show the robustness of QHM as frequency<br />
estima<strong>to</strong>r. QHM assumes that an initial estimate for the<br />
frequencies of the components is provided as well as that the<br />
number of components is known a priori. Then, the remaining<br />
parameters are estimated by minimizing the mean squared error<br />
between the speech signal and the model which leads <strong>to</strong> a least<br />
squares (LS) solution. In practice, however, a frequency mismatch<br />
between the original and the initial estimates of frequencies<br />
is inevitable. Reformulating the QHM representation, we<br />
show that QHM provides a mechanism for iteratively estimating<br />
the frequency mismatch and consequently improving the amplitude<br />
estimation in the mean-squared sense. Robustness issues of<br />
the frequency mismatch estimation algorithm are discussed and<br />
bounds on the magnitude of frequency mismatch for which the<br />
algorithm converges are provided.<br />
Similar <strong>to</strong> sinusoidal modeling, QHM assumes speech <strong>to</strong><br />
be locally stationary. In the case of signals exhibiting strong<br />
<strong>AM–FM</strong>, experiments show that QHM is limited in the sense<br />
that it can capture variations of frequencies and amplitudes<br />
but only up <strong>to</strong> a certain point. To overcome this limitation, we<br />
expand QHM <strong>to</strong> a novel speech representation referred <strong>to</strong> as<br />
adaptive QHM, or aQHM, where speech is not assumed <strong>to</strong> be<br />
locally stationary, taking in<strong>to</strong> account the trajec<strong>to</strong>ries of the<br />
instantaneous frequencies. Then, the speech signal is projected<br />
in a space generated by time varying nonparametric sinusoidal<br />
basis functions. Therefore, the basis functions are adapted <strong>to</strong><br />
the local characteristics of the input signal. The basis functions<br />
are updated by minimizing the mean squared error between<br />
the input signal and the aQHM model, at each adaptation<br />
step. This leads <strong>to</strong> a non-parametric <strong>AM–FM</strong> decomposition<br />
algorithm for speech signals. This is indeed, one key difference<br />
between aQHM and other <strong>AM–FM</strong> decomposition approaches<br />
like those suggested in [20], [22], where the amplitude and/or<br />
phase functions are represented by linear parametric models.<br />
In that sense, aQHM suggests a more flexible <strong>AM–FM</strong> decomposition<br />
algorithm. Another key difference between these<br />
approaches and aQHM, lies in the fact that aQHM takes in<strong>to</strong><br />
account the specific properties of voiced speech signals (i.e.,<br />
quasi-harmonic structure). In that sense, aQHM suggests a<br />
representation that is more suitable for speech than the generic<br />
models suggested in [20] and [22]. On the other hand, the suggested<br />
representation can be applied in a straightforward way<br />
on other multicomponent signals, simply by adjusting accordingly<br />
the expected distribution of the frequency information.<br />
For instance, in the case of singing voice or music, or certain<br />
marine biologic sounds, frequencies are expected <strong>to</strong> have a<br />
quasi-harmonic structure. In other cases, however, signals may<br />
contain a sparse and uncorrelated frequency content. In any<br />
case, prior knowledge about the structure and properties of<br />
the input signal may reduce the complexity of models while<br />
increasing their modeling efficiency.<br />
The Sinusoidal Model (SM) suggests a maximum-likelihood<br />
frequency estima<strong>to</strong>r, assuming a harmonic structure for<br />
the speech waveform. This leads <strong>to</strong> a simple peak-picking<br />
algorithm for estimating, at the analysis stage, the parameters<br />
of the model from the short-time Fourier transform of the<br />
signal [24]. Then at the synthesis stage, parametric models for<br />
the instantaneous amplitude (linear model) and phase (cubic<br />
model) are used for the signal reconstruction. Comparisons<br />
between SM, QHM, and aQHM were conducted for validation<br />
purposes, on synthetic signals under various noise conditions,<br />
while for evaluation we used voiced speech signals. Results<br />
show that the suggested approaches outperform SM in terms of<br />
accuracy in parameters estimation (for synthetic signals) and in<br />
signal-<strong>to</strong>-reconstruction error ratio (for speech signals).<br />
The organization of the paper is as follows. Section II presents<br />
an overview of QHM and reveals its main time and frequency<br />
properties showing that under certain conditions, QHM may<br />
be used <strong>to</strong> enhance frequency estimation. In Section III, these<br />
conditions are further examined and bounds where such an enhancement<br />
is possible in the context of QHM, are provided.<br />
The iterative adaptive <strong>AM–FM</strong> decomposition algorithm based<br />
on aQHM is presented in Section IV. The validity of the proposed<br />
approach, its robustness under noisy conditions, as well<br />
as its comparison with the SM on synthetic <strong>AM–FM</strong> signals<br />
are shown in Section V. To further support our suggestions,<br />
results of signal reconstruction on voiced speech signals from<br />
many speakers using SM, QHM, and aQHM are provided in<br />
Section VI. Section VII concludes the paper and discusses future<br />
directions of this work.<br />
II. QUASI-HARMONIC MODEL<br />
A. Overview QHM<br />
<strong>With</strong>in an analysis window, the deterministic (i.e., quasi-harmonic)<br />
component of a speech signal is modeled as ([27, Ch.<br />
4])<br />
where is the fundamental frequency of the harmonic signal,<br />
specifies the order of the model, i.e., the number of harmonics,<br />
are the complex amplitudes, are the complex<br />
slopes, and denotes the analysis window which is typically<br />
a Hamming window and zero outside a symmetric interval<br />
. Thus, will always denote the center of the analysis<br />
window. Note that for real signals such as speech, audio,<br />
(1)
292 IEEE TRANSACTIONS ON AUDIO, SPEECH, AND LANGUAGE PROCESSING, VOL. 19, NO. 2, FEBRUARY 2011<br />
etc., and , where is the conjugate opera<strong>to</strong>r.<br />
This model is an extension <strong>to</strong> the classic harmonic model<br />
in which the term is omitted [27]. As a result, it follows<br />
that the signal in (1) is projected on<strong>to</strong> the complex exponential<br />
functions, as in the simple harmonic case, and <strong>to</strong> functions of<br />
type . It is worth noting that the model in (1) can also<br />
be written for nonharmonically related frequency components.<br />
Therefore, a more general model can be expressed as<br />
(2)<br />
where will be referred <strong>to</strong> as initial estimates of the frequencies<br />
that will be considered <strong>to</strong> be known. Initial frequencies<br />
(or ) are considered <strong>to</strong> be known but not necessary optimal<br />
in representing the input signal in the mean squared error sense.<br />
For speech as well as for music signals, this is quite often the<br />
case.<br />
Assuming that the speech signal is defined on ,<br />
the estimation of the model parameters<br />
is<br />
performed in<strong>to</strong> two steps. At first, the fundamental frequency,<br />
and the number of harmonic components, , are estimated<br />
using spectral and au<strong>to</strong>correlation information as described in<br />
[27]. Then, the computation of is performed<br />
by minimizing a mean squared error which leads <strong>to</strong> a simple<br />
least squares solution [27]. The same procedure is applied if<br />
the initial estimates of frequencies are not restricted <strong>to</strong> be<br />
multiples of a fundamental frequency. In this case, frequencies<br />
may be obtained by peak picking the magnitude spectrum of<br />
the Fourier transform of the input signal as suggested in [24].<br />
In the following, we will not restrict the analysis <strong>to</strong> ,<br />
unless otherwise mentioned.<br />
From (2), it is easily seen that the instantaneous amplitude of<br />
each component is a time-varying function given by<br />
where and denote the real and the imaginary parts of ,<br />
respectively.<br />
Since both the amplitudes and the slopes are complex<br />
variables, the instantaneous frequency of each component is not<br />
a constant function over time but varies according <strong>to</strong><br />
while the instantaneous phase is given by<br />
A feature of the model worth noting is that the second term of<br />
the instantaneous frequency in (4) depends on the instantaneous<br />
(3)<br />
(4)<br />
(5)<br />
Fig. 1. Projection of b<br />
component.<br />
in<strong>to</strong> one parallel and one perpendicular <strong>to</strong> a<br />
amplitude. In other words, the accuracy of the frequency estimation<br />
(or, the estimation of phase function) depends on the amplitude<br />
information [28].<br />
B. Frequency-Domain Properties of QHM<br />
To understand the important features of QHM, we suggest<br />
discussing its frequency domain properties. To this end, let us<br />
consider the Fourier transform of in (2)<br />
where is the Fourier transform of the analysis window,<br />
, and is the derivative of over . For simplicity,<br />
we will only consider the th component of<br />
To reveal the main properties of QHM, we suggest the projection<br />
of on<strong>to</strong> as illustrated in Fig. 1. Accordingly,<br />
where denotes the perpendicular (vec<strong>to</strong>r) <strong>to</strong> , while<br />
and are computed as<br />
and<br />
Thus, the th component of can be written as<br />
Considering the Taylor series expansion of<br />
we obtain<br />
(6)<br />
(7)<br />
(8)<br />
(9)<br />
(10)<br />
(11)<br />
(12)
PANTAZIS et al.: ADAPTIVE <strong>AM–FM</strong> SIGNAL DECOMPOSITION WITH APPLICATION TO SPEECH ANALYSIS 293<br />
For a rectangular window it holds that<br />
, where<br />
is the duration of the analysis window, . Since the duration<br />
of the analysis window determines its bandwidth, it turns out<br />
that the larger the bandwidth the smaller the value of the term<br />
at . Thus, assuming short analysis windows and low<br />
values for we can approximate (12) as<br />
Consequently, from (11) and (13) it follows that [26]<br />
which is written in the time domain as<br />
(13)<br />
(14)<br />
(15)<br />
From (15), it is clear that accounts for the mismatch<br />
between the frequency of the th component and the initial estimate<br />
of the frequency, , while accounts for the normalized<br />
amplitude slope of the th component. Another way <strong>to</strong> see<br />
this relationship, is <strong>to</strong> associate the time domain and the frequency<br />
domain properties of QHM. From (4) and (10) it follows<br />
that<br />
(16)<br />
Therefore, accounts for a frequency deviation between<br />
the initially estimated frequency, , and the value of the instantaneous<br />
frequency at the center of the analysis window ( ).<br />
Similarly, for ,wehave<br />
(17)<br />
which shows that provides the normalized slope of the amplitude<br />
for the th component, considering the instantaneous<br />
amplitude at the center of the analysis window.<br />
III. EFFECTS OF ASSUMPTIONS AND APPROXIMATIONS<br />
ON THE FREQUENCY ESTIMATION PROCESS<br />
In the previous section, we showed that can be an estima<strong>to</strong>r,<br />
under certain conditions, of the frequency mismatch between<br />
the original and the initially estimated frequencies of the<br />
underlying sine waves. In this section, we shall treat the effects<br />
of these conditions.<br />
A. Effect and Importance of Window Length<br />
From (1) and assuming a real signal, we see that there are<br />
complex unknown parameters ( for and for ).<br />
Thus, the length of the analysis window should be at least<br />
(in samples) in order <strong>to</strong> obtain stable least squares solutions.<br />
Moreover, low-frequency components need larger windows,<br />
and an empirical choice for the analysis window length is that<br />
this should be at least , where denotes the<br />
floor opera<strong>to</strong>r while is the sampling frequency. Furthermore,<br />
when the <strong>AM–FM</strong> signal is contaminated by noise, more<br />
samples (larger window) are needed in order <strong>to</strong> perform more<br />
robust and accurate estimation of the unknown parameters<br />
[28], [29]. On the other hand, when larger windows are used,<br />
the possibility the signal is nonstationary is higher, which<br />
may introduce errors and bias in the estimation procedure.<br />
Additionally, the analysis presented in the following section<br />
shows that the smaller the window length the more valid is the<br />
approximation in (13). From the above discussion, it should be<br />
clear that the length of the analysis window is very important<br />
and there is a tradeoff between the accuracy of the proposed<br />
algorithm and its robustness. As a general rule, we suggest the<br />
use of as small as possible window length.<br />
B. Frequency Mismatch Computation<br />
Because of the approximation in (13) and of the expected<br />
nonstationary character of the input signal, the suggested estima<strong>to</strong>r<br />
for the frequency mismatch is generally not an unbiased<br />
estima<strong>to</strong>r. The frequency mismatch (i.e., the error between<br />
the actual and the estimated values), cannot be, in the general<br />
case, computed analytically. Nevertheless, it is important <strong>to</strong> examine<br />
the adequacy and the validity of the proposed algorithm.<br />
In the case where the signal has multiple components and/or is<br />
characterized as nonstationary, the estimation of frequency mismatch<br />
will be analyzed numerically. However, in the case where<br />
the input signal is mono component and stationary, the estimation<br />
of the frequency mismatch can be derived analytically. Note<br />
also that the frequency parameter is the most significant since if<br />
the correct value of a frequency is known, then unbiased estimates<br />
of the amplitude and the phase for that frequency can be<br />
obtained through least-squares (LS) [28], [29]. Thus, the focus<br />
is on the frequency mismatch estimation.<br />
Let us consider the mono component case ( ) of a stationary<br />
signal given by<br />
(18)<br />
where is the amplitude, is the phase offset, is the carrier<br />
(or analysis) frequency and is the (angular) frequency mismatch<br />
<strong>to</strong> be estimated. In the context of QHM, the input signal<br />
is modeled in one analysis frame as<br />
(19)<br />
where and are the unknown complex amplitude and slope,<br />
respectively, which are estimated through LS if is known.<br />
At the moment, we assume that . It can be shown that<br />
the LS method involves the projection of the input signal on<strong>to</strong><br />
two orthogonal basis functions: and . Thus, for<br />
a rectangular window the complex amplitude is obtained by<br />
(20)
294 IEEE TRANSACTIONS ON AUDIO, SPEECH, AND LANGUAGE PROCESSING, VOL. 19, NO. 2, FEBRUARY 2011<br />
Fig. 3. Upper panel: the estimation error of using a Hamming window of<br />
16 ms length, after 10 Monte-Carlo simulations of (25). Lower panel: same as<br />
above, but with two iterations for the estimation of .<br />
Fig. 2. Upper panel: the estimation error for a rectangular window computed<br />
analytically (solid line) and numerically (dashed line). Middle panel: the estimation<br />
error for a rectangular (solid line) and Hamming window (dashed line).<br />
Lower panel: error using the Hamming window (as in b) without (solid line) and<br />
with two iterations (dashed line). Note that the iterative estimation fails when<br />
j j=2 > B=3.<br />
where<br />
as<br />
denotes the inner product between functions, defined<br />
The complex slope is obtained by<br />
Then, the estimated value for<br />
is given by<br />
(21)<br />
(22)<br />
To inquire as <strong>to</strong> the properties of this estima<strong>to</strong>r, it is worth computing<br />
its error in estimating the frequency mismatch (i.e., estimation<br />
error)<br />
(23)<br />
In the case of a mono-component signal and using a rectangular<br />
window, the estimation error can be computed analytically as<br />
above. Please note that is an angular frequency expressed in<br />
rad/s. For the readability of the paper, we will present in Figs. 2<br />
and 3 the estimation error in Hz, i.e., as a function<br />
of . Fig. 2(a) depicts the error for a rectangular window<br />
of 16 ms ( ms) obtained analytically via (22) (solid line),<br />
and numerically through LS computation of and then<br />
applying (10) (dashed line). Both ways <strong>to</strong> compute the estimation<br />
error provide the same result. Although there is no guarantee<br />
that this will be true in the general case, we suggest <strong>to</strong><br />
compute numerically the estimation error <strong>to</strong> infer its analytical<br />
value, whenever the latter is not computationally tractable. In<br />
Fig. 2(a), the estimation error is small 1 (see the bold line) if the<br />
frequency mismatch is below 50 Hz. For a Hamming window,<br />
the error is small if the frequency mismatch is below 135 Hz as<br />
shown in Fig. 2(b).<br />
In order <strong>to</strong> get further insight on the role played by the analysis<br />
window, we can first notice from (20) and (21) that the<br />
Fourier Transform of the square of the analysis window appears<br />
in the LS estimates of and and consequently in the denomina<strong>to</strong>r<br />
of . Thus, the frequency mismatch must be smaller<br />
than the bandwidth (i.e., the width of the main lobe [30]) of<br />
the squared analysis window. Note also that the bandwidth of<br />
a (squared) rectangular window of length is<br />
Hz ( ms) while for a squared Hamming window we<br />
have<br />
Hz, which may explain why the region<br />
with small estimation error is about three times larger for a<br />
Hamming window than for a rectangular window. After testing<br />
a variety of window types and window lengths, we found that<br />
for mono-component stationary signals the estimation error is<br />
small when the frequency mismatch is smaller than one third of<br />
the bandwidth of the squared analysis window, i.e., when<br />
(24)<br />
Once an initial estimation of is obtained through , the<br />
initial estimation for frequency in (19) can be updated and<br />
then the input signal can be modeled again by QHM using now<br />
the updated frequency value, i.e.,<br />
. Thus,<br />
1 By small, we mean that jer( )j < j j.
PANTAZIS et al.: ADAPTIVE <strong>AM–FM</strong> SIGNAL DECOMPOSITION WITH APPLICATION TO SPEECH ANALYSIS 295<br />
TABLE I<br />
INTERVALS FOR EACH PARAMETER IN (25)<br />
new estimations of can be obtained iteratively. In Fig. 2(c),<br />
the estimation error is depicted for no iteration (solid line) and<br />
after two iterations (dashed line). We observe that the estimation<br />
error is considerably reduced (mainly is zero) if the initial<br />
frequency mismatch is smaller than .<br />
We now consider a more complicated case where the input<br />
signal has time-varying components (AM and FM)<br />
(25)<br />
where<br />
and the amplitude coefficients as well as the<br />
phase coefficients are real numbers. Based on the QHM model<br />
[i.e., on (19)], and assuming , we would like <strong>to</strong> estimate<br />
. Since—even for such a mono-component signal—the<br />
estimation error cannot be computed analytically, we resort<br />
<strong>to</strong> evaluating the error by numerically computing and<br />
Monte-Carlo simulations. Each parameter in (25) takes values<br />
uniformly distributed on the intervals provided in Table I. The<br />
analysis window is as before a Hamming window of duration<br />
ms. Note that the synthetic signal under consideration<br />
changes its characteristics very fast. For example, if all the<br />
coefficients in (25) are set <strong>to</strong> zero except for , which is set<br />
<strong>to</strong> , then the instantaneous amplitude starts from 0 at the<br />
beginning of the frame and ends (after 16 ms) at the value of<br />
. Fig. 3(a) depicts the results of this test for Monte-Carlo<br />
runs. It can be seen that a reasonable estimate can be obtained<br />
if the frequency mismatch is smaller than 100 Hz, which is less<br />
than in the stationary case (125 Hz). More importantly, even for<br />
very low-frequency mismatch a persistent error is present. This<br />
is why further updates of the frequencies [depicted in Fig. 3(b)]<br />
only provides marginal refinements but do not systematically<br />
decrease the estimation error at each iteration as is the case<br />
for a mono-component stationary complex exponential. In<br />
the following section, an adaptive scheme based on QHM is<br />
suggested which is able <strong>to</strong> model non stationary signals such<br />
as in (25).<br />
IV. ADAPTIVE <strong>AM–FM</strong> DECOMPOSITION<br />
In Section III-B, we showed that the iterative process suggested<br />
by QHM successfully adjusts the frequencies when the<br />
frequency components evolves slowly. In the case of fast variations,<br />
refinement of the frequencies can also be obtained, but<br />
only up <strong>to</strong> a certain point, since Fig. 3(b) clearly shows a persistent<br />
error even for a small frequency mismatch. This error is due<br />
<strong>to</strong> the fact that in such cases, stationary basis functions are used<br />
which are not adequate <strong>to</strong> model the input signal. Stated differently,<br />
iterating the update process by projecting on<strong>to</strong> a basis that<br />
does not fit the characteristics of the signal is not pertinent. In<br />
[31], a variant of this iterative method was proposed, using a<br />
basis of chirp functions in order <strong>to</strong> track linear variations of the<br />
frequencies.<br />
In this section, we suggest a different approach where the<br />
basis functions are not restricted <strong>to</strong> be chirp or exponential functions<br />
but can adapt <strong>to</strong> the locally estimated instantaneous frequency/phase<br />
components. More specifically, an input signal is<br />
projected in a space generated by time varying nonparametric sinusoidal<br />
basis functions. The nonparametric basis functions are<br />
updated iteratively, minimizing the mean squared error at each<br />
iteration. We will refer <strong>to</strong> this modeling approach as adaptive<br />
QHM, or aQHM.<br />
Initialization of aQHM is provided by QHM. Let ,<br />
, and , denote the updated frequencies, the corresponding<br />
amplitudes and phases at time instant (center of<br />
analysis window), with , where is the number<br />
of frames. We recall that these parameters are estimated using<br />
QHM as follows:<br />
(26a)<br />
(26b)<br />
(26c)<br />
In case the distance between the consecutive analysis time<br />
instants correspond <strong>to</strong> one sample then, QHM provides an estimation<br />
of the instantaneous amplitude, and instantaneous<br />
phase . Then, in aQHM the signal model is given as<br />
(27)<br />
with , where denotes the duration of the analysis<br />
window. In contrast <strong>to</strong> (1) or (2), where the basis functions are<br />
stationary and parametric, in (27) these are not parametric neither<br />
necessarily stationary. Moreover, since the time-varying<br />
characteristics of the basis functions are based on measurements<br />
from the input signal, these are also adaptive <strong>to</strong> the current characteristics<br />
of the signal. In other words, they are adaptive <strong>to</strong> the<br />
input signal. Also, note that the old phase value at (i.e., )<br />
is subtracted from the instantaneous phase, in order <strong>to</strong> obtain a<br />
new phase estimate from (26c).<br />
The term in (27) plays the same role as in QHM; it provides<br />
a means <strong>to</strong> update the frequency of the underlying sine<br />
wave at the center of the analysis window . The suggestions<br />
regarding the type and size of the analysis window made for<br />
QHM, are also valid for aQHM, since the same update mechanism<br />
is used. Therefore, an iterative analysis procedure using<br />
(27) is possible. In fact, using the initial estimates from QHM,<br />
new values of and are then computed using; however, in<br />
case of aQHM, the basis functions described in (27). Similar <strong>to</strong><br />
QHM, the mean squared error between the signal and the model<br />
is minimized. The solution is straightforward and it is provided<br />
by least squares, as for QHM. Then, new instantaneous values<br />
are computed using (26). The procedure can be iterated until<br />
changes in the mean-squared error are not significant. At the
296 IEEE TRANSACTIONS ON AUDIO, SPEECH, AND LANGUAGE PROCESSING, VOL. 19, NO. 2, FEBRUARY 2011<br />
last step of aQHM, the signal can be finally approximated as<br />
the sum of its <strong>AM–FM</strong> components<br />
(28)<br />
Therefore, aQHM suggests an algorithm for the adaptive<br />
<strong>AM–FM</strong> decomposition of a signal.<br />
For applications such as speech analysis for the purpose of<br />
voice function assessment (i.e., voice disorders, analysis of<br />
tremor), and voice modification, the one sample time step is<br />
accepted. In other applications however, such as speech synthesis,<br />
larger steps are required. In this case, the instantaneous<br />
values of frequency, amplitude, and phase should be estimated<br />
from the set of parameters computed at every analysis time<br />
instant . In SM, between two consecutive synthesis instants,<br />
linear interpolation for the amplitudes and cubic interpolation<br />
for phases were suggested [24]. In aQHM, many analysis time<br />
instants can be considered under the analysis window. For<br />
instantaneous amplitude estimation, we used splines, although<br />
other choices, such as linear interpolation, are possible. Such a<br />
simple solution is not, however, possible for the estimation of<br />
instantaneous phase. For this purpose, we will now describe a<br />
nonparametric approach as an alternative <strong>to</strong> the cubic interpolation<br />
method suggested in [24].<br />
Based on the definition of phase, the instantaneous phase for<br />
the th component can be computed as the integral of the computed<br />
instantaneous frequency. For instance, between two consecutive<br />
analysis time instants and , the instantaneous<br />
phase can be computed as<br />
(29)<br />
This solution however does not take in<strong>to</strong> account the frame<br />
boundary conditions at , which means that there is no guarantee<br />
that , where is the closet integer<br />
<strong>to</strong><br />
. We suggest modifying (29) in<br />
order <strong>to</strong> guarantee phase continuation over frame boundaries as<br />
follows:<br />
(30)<br />
Note that the derivative of the instantaneous phase over time in<br />
both formulas provide the instantaneous frequency computed<br />
from <strong>to</strong> . In (30), the continuation of instantaneous frequency<br />
at the frame boundaries is also guaranteed by the use of<br />
the sine function (although other choices may be used as well).<br />
Moreover, it can be easily shown that using (30) the instantaneous<br />
phase at will be equal <strong>to</strong> if is selected<br />
<strong>to</strong> be<br />
(31)<br />
where is computed as before.<br />
In Fig. 4, the two above formulas are compared on a synthetic<br />
example. The signal was analyzed frame-by-frame using QHM<br />
<strong>to</strong> compute the phase values at the frame boundaries. The actual<br />
Fig. 4. Actual instantaneous frequency (dashed line) and estimated instantaneous<br />
frequency (solid line) as the derivative of the instantaneous phase computed<br />
from (29) (upper panel) and (30) (lower panel).<br />
instantaneous frequency con<strong>to</strong>ur (shown by a dashed line) of<br />
the signal is used in (29) and in (30) for the instantaneous phase<br />
computation. Then an estimation of the instantaneous frequency<br />
is obtained as the derivative over time of the computed instantaneous<br />
phases. Fig. 4(a) and (b) show the estimated instantaneous<br />
frequency (solid line) when (29) and (30) are used, respectively.<br />
It is obvious that in the former case there are spikes at the frame<br />
boundaries while in the latter case, the estimated instantaneous<br />
frequency is free of artefact and very close <strong>to</strong> the actual one.<br />
Having computing the instantaneous amplitude and phase information,<br />
the signal reconstruction is obtained by (28), as previously.<br />
Summarizing, aQHM suggests a non-parametric <strong>AM–FM</strong> decomposition<br />
algorithm which proceeds by successive adaptations<br />
of the decomposition basis functions <strong>to</strong> the characteristics<br />
of the underlying sine waves of the input signal. A pseudocode<br />
of the algorithm is presented next.<br />
<strong>Adaptive</strong> <strong>AM–FM</strong> decomposition alg. (aQHM)<br />
1) Initialization (QHM):<br />
Provide initial estimate<br />
For<br />
a) Compute , using as initial frequency<br />
estimates in (2)<br />
b) Update using (26a) and (10)<br />
c) Compute and using (26b) and (26c),<br />
respectively<br />
d)<br />
end<br />
Interpolate , , as described<br />
2) Adaptations:<br />
For<br />
For
PANTAZIS et al.: ADAPTIVE <strong>AM–FM</strong> SIGNAL DECOMPOSITION WITH APPLICATION TO SPEECH ANALYSIS 297<br />
a) Compute , using and (27)<br />
b) Update using (26a) and (10)<br />
c) Compute and using (26b) and (26c),<br />
respectively<br />
end<br />
Interpolate , , as described<br />
end<br />
The aQHM algorithm is intuitively simple, and, as concerns<br />
its complexity, the most time-consuming part is the computation<br />
of and via LS at each time step. For each time step, the cost<br />
is , where is the window length is samples.<br />
For comparison purposes, when there is only one component,<br />
the complexity of each step is . This order of complexity<br />
is comparable <strong>to</strong> <strong>AM–FM</strong> decomposition algorithms with very<br />
low complexity such as the DESA algorithm [11].<br />
Finally, having provided the algorithm for the iterative<br />
<strong>AM–FM</strong> decomposition, we would like <strong>to</strong> make the following<br />
comment that may be found useful during the implementation<br />
of the algorithm. As it was mentioned previously, frequencies<br />
are updated by adding a corrective term which depends on<br />
the amplitude as follows:<br />
(32)<br />
Therefore, if the value of the th amplitude is close <strong>to</strong> zero,<br />
the estimated value for the th instantaneous frequency will<br />
be erroneously high. This may create serious accuracy problems<br />
in the estimation of the other components of the signal<br />
and subsequently during the adaptation procedure. To overcome<br />
this, we suggest <strong>to</strong> exclude that component from the updating<br />
process and keep the initial value of the component. Alternatively,<br />
one could consider that this is not a component of the<br />
input signal. Such exclusion occurs if, at iteration ,<br />
. Since the corresponding amplitude has a<br />
low value, any solution will not have a serious effect in the signal<br />
reconstruction process.<br />
V. VALIDATION ON SYNTHETIC SIGNALS<br />
In this section, the performance of the suggested adaptive<br />
<strong>AM–FM</strong> decomposition algorithm (aQHM) will be validated on<br />
two <strong>AM–FM</strong> synthetic signals. The first signal is a chirp signal<br />
with a second-order polynomial for AM, while the second signal<br />
has two sinusoidally time-varying <strong>AM–FM</strong> components. Moreover,<br />
we will consider the case with additive noise in order <strong>to</strong><br />
further validate the robustness of the proposed algorithm. Since<br />
the synthetic signals are parametric in <strong>AM–FM</strong> components, we<br />
will use as a validation metric the mean absolute error (MAE)<br />
between the true and the estimated <strong>AM–FM</strong> components. For<br />
comparison purposes, we suggest comparing aQHM with QHM<br />
and the estimation procedure used in the SM [24]. Regarding<br />
SM, at each analysis frame, we compute the Fourier transform<br />
of the windowed signal and determine the frequency and amplitude<br />
of each component of the signal by performing peak<br />
picking in the magnitude spectrum. To improve the frequency<br />
resolution of this standard approach, parabolic interpolation in<br />
the magnitude spectrum is used. The Fourier transform of the<br />
TABLE II<br />
MEAN ABSOLUTE ERROR (MAE) OF AM AND FM COMPONENTS FOR QHM,<br />
AQHM, AND SM WITHOUT NOISE, AND WITH COMPLEX ADDITIVE WHITE<br />
GAUSSIAN NOISE AT 30-dB AND 10-dB LOCAL SNR<br />
signal is computed at 2048 frequency bins (from 0 <strong>to</strong> ). Since<br />
we use a peak picking approach for the frequency estimation in<br />
the case of SM, the notion of frequency mismatch is irrelevant in<br />
this case. Therefore, frequency mismatch is only considered for<br />
the QHM and aQHM cases. Thus, it is worth noting that QHM<br />
and aQHM have <strong>to</strong> cope with both the initial frequency mismatch<br />
and the additive noise, while SM has <strong>to</strong> cope only with<br />
the additive noise.<br />
For all synthetic examples, we will consider a sampling frequency<br />
Hz and for all methods the same fixedlength<br />
Hamming window will be used. The time step (hop size)<br />
will be fixed <strong>to</strong> one sample ( ).<br />
First let us consider the following monocomponent ( )<br />
chirp signal with a second-order amplitude modulation<br />
(33)<br />
whose instantaneous frequency is<br />
(Hz).<br />
Based on the analysis presented in Section III, the maximum<br />
frequency mismatch between the initial estimate and the actual<br />
frequency of the signal is defined as one third of the bandwidth<br />
of the squared analysis window. In this experiment, we will use<br />
a 10-ms Hamming window, for which the squared window has<br />
bandwidth<br />
Hz. Therefore, the maximum frequency<br />
mismatch is Hz. The center of the first analysis<br />
window is located at 5 ms, where the actual instantaneous frequency<br />
is 475 Hz. We set the initial frequency estimate <strong>to</strong> 400<br />
Hz which means that there is frequency mismatch of 75 Hz. We<br />
consider the case without noise as well as with complex additive<br />
white Gaussian noise of 30-dB and 10-dB local SNR. In case of<br />
additive noise, the average performance of each algorithm was<br />
measured based on simulations.<br />
Table II reports the MAE between the estimated and the actual<br />
AM and FM component, for QHM, aQHM, and SM. Two iterations<br />
were used in the case of QHM, and two iterations (or adaptations)<br />
were used for aQHM. First, we observe that aQHM outperforms<br />
all the other approaches, while QHM and SM present<br />
about the same performance. When there is no additive noise,<br />
aQHM efficiently resolves the nonstationary character of the<br />
signal in contrast <strong>to</strong> the other two approaches. As the local SNR<br />
decreases, the performance of aQHM decreases <strong>to</strong>o, while the<br />
performance of QHM and SM remains about the same. In this<br />
experiment, estimation error has mainly two sources. One stems<br />
from the nonstationarity characteristics of the input signal. The<br />
other stems from the additive noise. The former source seems
298 IEEE TRANSACTIONS ON AUDIO, SPEECH, AND LANGUAGE PROCESSING, VOL. 19, NO. 2, FEBRUARY 2011<br />
TABLE III<br />
MEAN ABSOLUTE ERROR FOR QHM, AQHM AND SM FOR THE<br />
TWO-COMPONENT SYNTHETIC <strong>AM–FM</strong> SIGNAL, WITHOUT NOISE, AND WITH<br />
COMPLEX ADDITIVE WHITE GAUSSIAN NOISE AT 10-dB LOCAL SNR.<br />
<strong>to</strong> be more important for the case of QHM and SM, while the<br />
latter affects more aQHM. However, even for 10-dB local SNR,<br />
aQHM is more than 200% and 60% better than SM (in terms of<br />
MAE) in estimating the AM, and FM components, respectively.<br />
Let us consider a two component <strong>AM–FM</strong> signal of the form<br />
(34)<br />
where instantaneous amplitudes and frequencies present sinusoidally<br />
time-varying characteristics. Note that the AM of the<br />
second component (AM2) varies faster than the corresponding<br />
AM of the first component (AM1), and that frequency modulation<br />
for both components is important: 130 cycles per second. A<br />
Hamming window of length 16 ms is used. In case of QHM, an<br />
initial frequency mismatch of 32 Hz is assumed for both components,<br />
which is a bit below the maximum allowable mismatch<br />
(namely Hz in this example) The performance of the<br />
algorithms is tested without additive noise and with complex additive<br />
white Gaussian noise of 10-dB local SNR. As previously,<br />
in case of additive noise, the average performance of each algorithm<br />
was measured based on simulations. In Table III,<br />
the performance of QHM, aQHM, and SM is shown in terms<br />
of MAE. It is worth noting here, that over the duration of the<br />
window length, the signal components change quickly; therefore,<br />
it may be seen as a highly nonstationary signal. Specifically,<br />
in 16 ms, about two periods of the FM components are<br />
observed. Regarding amplitude modulation, this is about half<br />
of one period for AM1 and about one period for AM2. Therefore,<br />
more iterations in aQHM are expected <strong>to</strong> reduce the MAE<br />
for each of these components. Indeed, aQHM required 11 iterations<br />
(or adaptations) <strong>to</strong> converge (meaning that no significant<br />
changes in MAE were observed) in case of clean data and<br />
eight adaptations in case of additive noise. QHM required two<br />
iterations.<br />
As in the mono component signal, QHM and SM have similar<br />
performance regarding the AM components, while for the<br />
FM components, QHM performs better than SM. It seems that<br />
the presence of two components affects more SM than QHM because<br />
of the interference between the components. Also, aQHM<br />
outperforms both QHM and SM for all the parameters and under<br />
all conditions. In contrast <strong>to</strong> the mono component case, however,<br />
aQHM is not so sensitive <strong>to</strong> the additive noise. In this case,<br />
the source of the estimation error, because of the highly nonstationary<br />
character of the input signal, is more important than<br />
the corresponding error source because of the presence of noise.<br />
Therefore, decreasing the SNR, does not significantly affect the<br />
performance of aQHM.<br />
VI. <strong>AM–FM</strong> DECOMPOSITION OF VOICED SPEECH<br />
The suggested iterative <strong>AM–FM</strong> decomposition algorithm<br />
based on aQHM can be applied on voiced speech signals in<br />
a straightforward way. Actually, the aQHM algorithm can be<br />
applied on large voiced speech segment. Indeed, assuming that<br />
voiced speech is quasi-periodic and that the frequency content<br />
of voiced speech signals does not change very fast, then we only<br />
need <strong>to</strong> provide the fundamental frequency of the first voiced<br />
frame at the beginning of the voiced segment, and then<br />
assume<br />
. After the QHM analysis of the first<br />
voiced frame, an updated set of will be obtained for that<br />
frame. The updated set of frequencies can then be used as initial<br />
estimates for the next voiced frame. Continuing in this way,<br />
the whole voiced region will be analyzed by providing just the<br />
fundamental frequency for the first frame of the voiced segment.<br />
Another option could be <strong>to</strong> use the average fundamental<br />
frequency of the voiced segment as an initial frequency estimation<br />
. It is worth noting that the accuracy of the fundamental<br />
frequency estima<strong>to</strong>r is not crucial for aQHM, since<br />
frequency mismatches are easily corrected (of course, we exclude<br />
cases of fundamental frequency doubling or halving). For<br />
evaluation of the adaptive <strong>AM–FM</strong> decomposition algorithm<br />
we propose <strong>to</strong> reconstruct the original signal by using the estimated<br />
<strong>AM–FM</strong> components and measure then the signal-<strong>to</strong>-reconstruction-error<br />
ratio (SRER) defined as<br />
(35)<br />
where denotes the standard deviation of , and is the<br />
reconstructed signal computed from (28).<br />
In this section, we will compare aQHM with QHM and SM in<br />
terms of quality of voiced speech signal reconstruction. If time<br />
step is one sample, then all algorithms have an estimation of<br />
the instantaneous amplitude and phase as these are estimated at<br />
the center of their analysis windows. For SM, parabolic interpolation<br />
in the magnitude spectrum is used in order <strong>to</strong> improve<br />
frequency resolution. Phases are then computed from the phase<br />
spectrum by considering the phase at the point nearest the interpolated<br />
frequency. As previously, the Fourier transform of the<br />
signal is computed at 2048 frequency bins (from 0 <strong>to</strong> ).<br />
In Fig. 5(a), a segment from a voiced speech signal generated<br />
by a male speaker is shown (sampling frequency 16 kHz).<br />
The analysis was performed using a Hamming window of 16<br />
ms and with one sample as step size. For QHM, we set<br />
Hz (the average fundamental frequency of the segment) and<br />
. Only one iteration was used for QHM. The results<br />
from QHM were used as an initialization for aQHM, where only<br />
one adaptation was performed. Regarding SM, the most prominent<br />
40 components in the magnitude spectrum were selected<br />
after peak picking and parabolic interpolation. We verified that<br />
the frequency of the selected peaks were closely related <strong>to</strong> the<br />
updated frequencies, of QHM. The estimated instantaneous<br />
amplitude and phase information for all the methods (QHM,<br />
aQHM, and SM) were then used <strong>to</strong> reconstruct the speech signal<br />
as in (28). The reconstruction error for each method is depicted<br />
in Fig. 5(b)–(d), for QHM, aQHM, and SM, respectively. Again,<br />
aQHM provides the best reconstruction compared <strong>to</strong> the other
PANTAZIS et al.: ADAPTIVE <strong>AM–FM</strong> SIGNAL DECOMPOSITION WITH APPLICATION TO SPEECH ANALYSIS 299<br />
TABLE IV<br />
MEAN AND STANDARD DEVIATION OF SIGNAL-TO-RECONSTRUCTION-ERROR<br />
RATIO (IN dB) FOR APPROXIMATELY FIVE MINUTES OF VOICED SPEECH<br />
FOR 20 MALE AND 20 FEMALE SPEAKERS FROM TIMIT.<br />
Fig. 5. (a) Original speech signal and reconstruction error for (b) QHM after<br />
one iteration, (c) aQHM after one adaptation, and (d) SM, using K =40components.<br />
two alternatives even if only one iteration is applied. The SRER<br />
is 19.5 dB for SM, 24.1 dB for QHM, and 30.5 dB for aQHM.<br />
In case the step size is bigger than one sample, then the<br />
instantaneous amplitudes and phases should be computed from<br />
the estimated parameters at the analysis time instances. For<br />
QHM and aQHM, the instantaneous amplitude and instantaneous<br />
frequency are computed using splines. The instantaneous<br />
phase is computed from (30). For SM, instantaneous amplitude<br />
is computed with linear interpolation while for the instantaneous<br />
phase, cubic interpolation is used [24]. Using three<br />
different step sizes, namely 1, 2, and 4 ms, we analyzed and<br />
reconstruct about 200 minutes of voiced speech from 20 male<br />
and 20 female speakers (about 5 minutes per speaker) from<br />
the TIMIT database. The sampling frequency is 16 000 Hz.<br />
Assuming an average pitch of 100 and 160 Hz for male and<br />
female speakers, respectively, we used Hamming windows of<br />
fixed length; 2.5 times the average pitch period. Thus, we used<br />
a fixed length analysis window: 25 ms for male and 15 ms<br />
for female speakers. The same windows was used for all the<br />
algorithms. The number of components was set <strong>to</strong> for<br />
male voices and <strong>to</strong> for female voices. The average and<br />
standard deviation of the SRER (dB) is provided in Table IV<br />
along with various step sizes. For QHM, only one iteration<br />
was used. In the case of aQHM, the relative change of SRER<br />
is observed. When this is below a threshold, convergence is<br />
assumed. Table IV presents the mean number of adaptations<br />
needed for aQHM <strong>to</strong> converge. Since only aQHM suggests an<br />
adaptive algorithm, this column of the table is considered only<br />
for aQHM.<br />
We observe that the reconstruction error has lower power for<br />
the female voices than for the male voices. This is expected<br />
as the duration of analysis window is shorter in this case. As<br />
already mentioned, step size is a crucial parameter, in QHM,<br />
and aQHM. Results show that there is a minor decrease in the<br />
performance of these two algorithms when the time step is increasing.<br />
Comparing aQHM with SM, we see that the improvement<br />
in SRER is between 56% (for males) and 55% (for females),<br />
thus providing an average improvement of over 55%.<br />
Compared <strong>to</strong> QHM, aQHM provides an average improvement<br />
of 22% in SRER.<br />
VII. CONCLUSION<br />
In this paper, we showed the robustness of the QHM as a<br />
frequency estima<strong>to</strong>r and we expanded QHM <strong>to</strong> a novel speech<br />
representation referred <strong>to</strong> as adaptive QHM, or aQHM. The<br />
resulting representation suggests an iterative nonparametric<br />
<strong>AM–FM</strong> decomposition of speech. The algorithm was validated<br />
on synthetic mono and multi component <strong>AM–FM</strong> signals<br />
with or without the presence of additive noise. The proposed<br />
approach was also applied <strong>to</strong> estimate the <strong>AM–FM</strong> components<br />
of voiced speech. <strong>Signal</strong> reconstruction using the estimated<br />
instantaneous components of the signal leads <strong>to</strong> a high-quality<br />
reconstruction of voiced speech. An average signal <strong>to</strong> reconstruction<br />
error ratio of about 30 dB was obtained, which shows<br />
the accuracy of the suggested estima<strong>to</strong>r. Furthermore, based<br />
on the proposed decomposition algorithm, high resolution<br />
time–frequency representations of voiced speech can be obtained<br />
revealing details in the structure of speech signals. Based<br />
on these results, the proposed method is expected <strong>to</strong> be useful<br />
in many speech applications including speech analysis, speech<br />
synthesis and modifications, and objective voice function<br />
assessment.<br />
REFERENCES<br />
[1] J. Laroche, Y. Stylianou, and E. Moulines, “HNM: A simple, efficient<br />
harmonic plus noise model for speech,” in Proc. Workshop Applicat.<br />
<strong>Signal</strong> Process. Audio Acoust. (WASPAA), New Paltz, NY, Oct. 1993,<br />
pp. 169–172.<br />
[2] A. W. Rihaczek, Principles of High-Resolution Radar. Norwood,<br />
MA: Artech House, 1985.<br />
[3] M. S. Pattichis, C. S. Pattichis, M. Avraam, A. Bovik, and K. Kyriakou,<br />
“<strong>AM–FM</strong> texture segmentation in electron microscopic muscle<br />
imaging,” IEEE Trans. Med. Imag., vol. 19, no. 12, pp. 1253–1257,<br />
Dec. 2000.
300 IEEE TRANSACTIONS ON AUDIO, SPEECH, AND LANGUAGE PROCESSING, VOL. 19, NO. 2, FEBRUARY 2011<br />
[4] T. F. Quatieri, Speech <strong>Signal</strong> Processing. Upper Saddle River, NJ:<br />
Prentice-Hall, 2002, <strong>Signal</strong> Processing Series.<br />
[5] A. Rao and R. Kumaresan, “On decomposing speech in<strong>to</strong> modulated<br />
components,” IEEE Trans. Speech Audio Process., vol. 8, no. 3, pp.<br />
240–254, May 2000.<br />
[6] L. Cohen, Time–Frequency Analysis. New York: Prentice-Hall, 1995.<br />
[7] P. J. Loughlin and B. Tacer, “On the amplitude- and frequency-modulation<br />
decomposition of signals,” J. Acoust. Soc. Amer., vol. 100, pp.<br />
1594–1601, Sep. 1996.<br />
[8] F. Auger and P. Flandrin, “Improving the readability of time–frequency<br />
and time-scale representations by the reassignment method,”<br />
IEEE Trans. <strong>Signal</strong> Process., vol. 43, no. 5, pp. 1068–1089, May 1995.<br />
[9] D. Vakman, “On the analytic signal, the Teager-Kaiser energy algorithm,<br />
and other methods for defining amplitude and frequency,” IEEE<br />
Trans. <strong>Signal</strong> Process., vol. 44, no. 4, pp. 791–797, Apr. 1996.<br />
[10] J. F. Kaiser, “On a simple algorithm <strong>to</strong> calculate the ’energy’ of a<br />
signal,” in Proc. IEEE Int. Conf. Acoust., Speech, <strong>Signal</strong> Process.<br />
(ICASSP), Albuquerque, NM, Apr. 1990, pp. 381–384.<br />
[11] P. Maragos, J. Kaiser, and T. Quatieri, “On separating amplitude from<br />
frequency modulations using energy opera<strong>to</strong>rs,” in Proc. IEEE Int.<br />
Conf. Acoust., Speech, <strong>Signal</strong> Process. (ICASSP), San Francisco, CA,<br />
Mar. 1992, pp. 1–4.<br />
[12] B. Santhanam, “Multicomponent <strong>AM–FM</strong> energy demodulation with<br />
applications <strong>to</strong> signal processing and communications,” Ph.D., Georgia<br />
Inst. of Technol., Atlanta, 1997.<br />
[13] J. H. L. Hansen, L. Gavidia-Ceballos, and J. F. Kaiser, “A nonlinear opera<strong>to</strong>r-based<br />
speech feature analysis method with application <strong>to</strong> vocal<br />
fold pathology assessment,” IEEE Trans. Biomed. Eng., vol. 45, no. 3,<br />
pp. 300–312, Mar. 1998.<br />
[14] W. C. Pai and P. C. Doerschuk, “Statistical <strong>AM–FM</strong> models, extended<br />
Kalman filter demodulation, Cramer–Rao bounds and speech analysis,”<br />
IEEE Trans. <strong>Signal</strong> Process., vol. 48, no. 8, pp. 2300–2313, Aug. 2000.<br />
[15] T. F. Quatieri, T. E. Hanna, and G. C. O’Leary, “<strong>AM–FM</strong> separation<br />
using audi<strong>to</strong>ry-motivated filters,” IEEE Trans. Speech Audio Process.,<br />
vol. 5, no. 5, pp. 465–480, Sep. 1997.<br />
[16] S. Mann and S. Haykin, “The Chirplet transform: A generalization of<br />
Gabor’s logon transform,” in Proc. Vision Interface.<br />
[17] L. Weruaga and M. Kepesi, “The Fan-Chirp transform for non-stationary<br />
harmonic signals,” <strong>Signal</strong> Process., vol. 87, pp. 1504–1522,<br />
2007.<br />
[18] R. Dunn and T. F. Quatieri, “Sinewave analysis/synthesis based on<br />
the Fan-Chirp transform,” in Proc. Workshop Applicat. <strong>Signal</strong> Process.<br />
Audio Acoust. (WASPAA), Oct. 2007, pp. 16–19.<br />
[19] S. Peleg and B. Friedlander, “The discrete polynomial-phase transform,”<br />
IEEE Trans. <strong>Signal</strong> Process., vol. 43, no. 8, pp. 1901–1914, Aug.<br />
1995.<br />
[20] G. Zhou, G. B. Giannakis, and A. Swami, “On polynomial phase signals<br />
with time-varying amplitudes,” IEEE Trans. <strong>Signal</strong> Process., vol.<br />
44, no. 4, pp. 848–861, Apr. 1996.<br />
[21] M. Betser, P. Collen, G. Richard, and B. David, “Estimation of frequency<br />
for AM/FM models using the phase vocoder framework,” IEEE<br />
Trans. <strong>Signal</strong> Process., vol. 56, no. 2, pp. 505–517, Feb. 2008.<br />
[22] B. Friedlander and J. M. Francos, “Estimation of amplitude and phase<br />
parameters of multicomponent signals,” IEEE Trans. <strong>Signal</strong> Process.,<br />
vol. 43, no. 4, pp. 917–926, Apr. 1995.<br />
[23] S. Gazor and R. R. Far, “<strong>Adaptive</strong> maximum windowed likelihood<br />
multicomponent <strong>AM–FM</strong> signal decomposition,” IEEE Trans. Audio,<br />
Speech, Lang. Process., vol. 14, no. 2, pp. 497–491, Mar. 2006.<br />
[24] R. J. McAulay and T. F. Quatieri, “Speech analysis/synthesis based<br />
on a sinusoidal representation,” IEEE Trans. Acoust., Speech, <strong>Signal</strong><br />
Process., vol. ASSP-34, no. 4, pp. 744–754, Aug. 1986.<br />
[25] J. Laroche, “A new analysis/synthesis system of musical signals using<br />
Prony’s method. <strong>Application</strong> <strong>to</strong> heavily damped percussive sounds,”<br />
in Proc. IEEE Int. Conf. Acoust., Speech, <strong>Signal</strong> Process. (ICASSP),<br />
Glasgow, U.K., May 1989, pp. 2053–2056.<br />
[26] Y. Pantazis, O. Rosec, and Y. Stylianou, “On the properties of a timevarying<br />
quasi-harmonic model of speech,” in Proc. Interspeech, Brisbane,<br />
Australia, Sep. 2008, pp. 1044–1047.<br />
[27] Y. Stylianou, “Harmonic plus noise models for speech, combined with<br />
statistical methods, for speech and speaker modification,” Ph.D. dissertation,<br />
Ecole Nationale Supérieure des Télécomm., Paris, France, 1996.<br />
[28] S. M. Kay, Funtamentals of Statistical <strong>Signal</strong> Processing: Estimation<br />
Theory. Englewood Cliffs, NJ: Prentice-Hall, 1993.<br />
[29] P. S<strong>to</strong>ica, H. Li, and J. Li, “Amplitude estimation of sinusoidal signals:<br />
Survey, new results, and an application,” IEEE Trans. <strong>Signal</strong> Process.,<br />
vol. 48, no. 2, pp. 338–352, Feb. 2000.<br />
[30] A. V. Oppenheim, R. W. Schafer, and J. R. Buck, Discrete-Time <strong>Signal</strong><br />
Processing, 2nd ed. Englwood Cliffs, NJ: Prentice-Hall, 1989, <strong>Signal</strong><br />
Processing Series.<br />
[31] Y. Pantazis, O. Rosec, and Y. Stylianou, “Chirp rate estimation of<br />
speech based on a time-varying quasi-harmonic model,” in Proc.<br />
IEEE Int. Conf. Acoust., Speech, <strong>Signal</strong> Process. (ICASSP), 2009, pp.<br />
3985–3988.<br />
Yannis Pantazis received the B.A. and M.S. degrees<br />
in computer science from the University of Crete,<br />
Heraklion, Greece, in 2004 and 2006, respectively.<br />
He is currently pursuing the Ph.D. degree in signal<br />
processing from the University of Crete.<br />
Since 2003, he has been a member of Institute of<br />
Computer Science, FORTH, Heraklion, Greece. His<br />
research interests include speech analysis and synthesis,<br />
voice pathology, and signal modeling and estimation.<br />
Olivier Rosec (M’07) received the M.Sc. degree in<br />
electronics and the Ph.D. degree in signal processing<br />
both from the Université de Bretagne Occidentale,<br />
Brest, France, in 1995 and 2000, respectively.<br />
He is a Research Engineer at Orange Labs, Lannion,<br />
France. From 1996 until 1999, he was with the<br />
Acoustics and Seismics Department of IFREMER,<br />
Brest, as a Research Engineer. Since 2000, he has<br />
been a Research Engineer in signal processing within<br />
the Speech Synthesis Team, Orange Labs. His current<br />
research interests include speech modeling and analysis,<br />
speech modification and coding for concatenative synthesis, voice transformation,<br />
and voice conversion.<br />
Yannis Stylianou (M’95) received the Diploma of<br />
Electrical Engineering from the National Technical<br />
University of Athens, Athens, Greece, in 1991 and<br />
the M.Sc. and Ph.D. degrees in signal processing<br />
from the Ecole National Superieure des Telecommunications,<br />
ENST, Paris, France, in 1992 and 1996,<br />
respectively.<br />
He is an Associate Professor in the Department<br />
of Computer Science, University of Crete, and an<br />
Associate Researcher in the Networks and Telecommunications<br />
Labora<strong>to</strong>ry, Institute of Computer<br />
Science at FORTH. From 1996 until 2001, he was with AT&T Labs Research,<br />
Murray Hill and Florham Park, NJ, as a Senior Technical Staff Member.<br />
In 2001, he joined Bell-Labs Lucent Technologies, Murray Hill (now Alcatel-Lucent).<br />
Since 2002, he has been with the Computer Science Department,<br />
University of Crete and the Institute of Computer Science at FORTH. He<br />
has over 100 peer-reviewed papers, and holds nine U.S. patents. He is on<br />
the Edi<strong>to</strong>rial Board of the Journal of Electrical and Computer Engineering,<br />
Hindawi, Associate Edi<strong>to</strong>r of the EURASIP Journal on Speech, Audio, and<br />
Music Processing, and of the EURASIP Research Letters in <strong>Signal</strong> Processing.<br />
He is member of ISCA and the Technical Chamber of Greece.<br />
Prof. Stylianou is on the Board of the International Speech Communication<br />
Association (ISCA), member of the IEEE Speech and Language Technical<br />
Committee, and of the IEEE Multimedia Communications Technical Committee.<br />
He was Associate Edi<strong>to</strong>r for the IEEE SIGNAL PROCESSING LETTERS.