View - Faculty of Information and Communication Technologies
View - Faculty of Information and Communication Technologies
View - Faculty of Information and Communication Technologies
You also want an ePaper? Increase the reach of your titles
YUMPU automatically turns print PDFs into web optimized ePapers that Google loves.
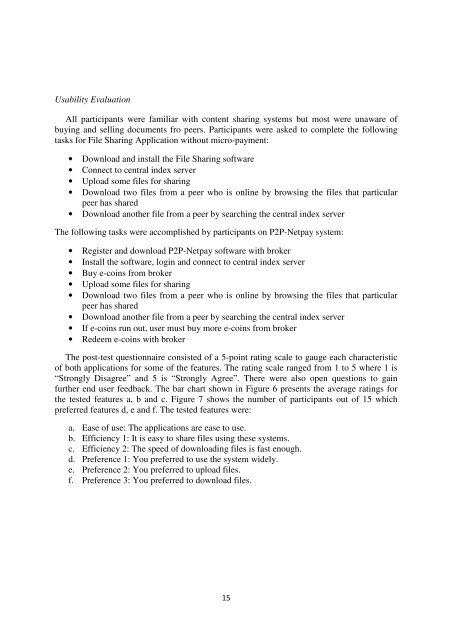
Usability Evaluation<br />
All participants were familiar with content sharing systems but most were unaware <strong>of</strong><br />
buying <strong>and</strong> selling documents fro peers. Participants were asked to complete the following<br />
tasks for File Sharing Application without micro-payment:<br />
• Download <strong>and</strong> install the File Sharing s<strong>of</strong>tware<br />
• Connect to central index server<br />
• Upload some files for sharing<br />
• Download two files from a peer who is online by browsing the files that particular<br />
peer has shared<br />
• Download another file from a peer by searching the central index server<br />
The following tasks were accomplished by participants on P2P-Netpay system:<br />
• Register <strong>and</strong> download P2P-Netpay s<strong>of</strong>tware with broker<br />
• Install the s<strong>of</strong>tware, login <strong>and</strong> connect to central index server<br />
• Buy e-coins from broker<br />
• Upload some files for sharing<br />
• Download two files from a peer who is online by browsing the files that particular<br />
peer has shared<br />
• Download another file from a peer by searching the central index server<br />
• If e-coins run out, user must buy more e-coins from broker<br />
• Redeem e-coins with broker<br />
The post-test questionnaire consisted <strong>of</strong> a 5-point rating scale to gauge each characteristic<br />
<strong>of</strong> both applications for some <strong>of</strong> the features. The rating scale ranged from 1 to 5 where 1 is<br />
“Strongly Disagree” <strong>and</strong> 5 is “Strongly Agree”. There were also open questions to gain<br />
further end user feedback. The bar chart shown in Figure 6 presents the average ratings for<br />
the tested features a, b <strong>and</strong> c. Figure 7 shows the number <strong>of</strong> participants out <strong>of</strong> 15 which<br />
preferred features d, e <strong>and</strong> f. The tested features were:<br />
a. Ease <strong>of</strong> use: The applications are ease to use.<br />
b. Efficiency 1: It is easy to share files using these systems.<br />
c. Efficiency 2: The speed <strong>of</strong> downloading files is fast enough.<br />
d. Preference 1: You preferred to use the system widely.<br />
e. Preference 2: You preferred to upload files.<br />
f. Preference 3: You preferred to download files.<br />
15


