Appendix VIII Qualification of Manual Phased Array UT for Dissimilar ...
Appendix VIII Qualification of Manual Phased Array UT for Dissimilar ...
Appendix VIII Qualification of Manual Phased Array UT for Dissimilar ...

You also want an ePaper? Increase the reach of your titles
YUMPU automatically turns print PDFs into web optimized ePapers that Google loves.
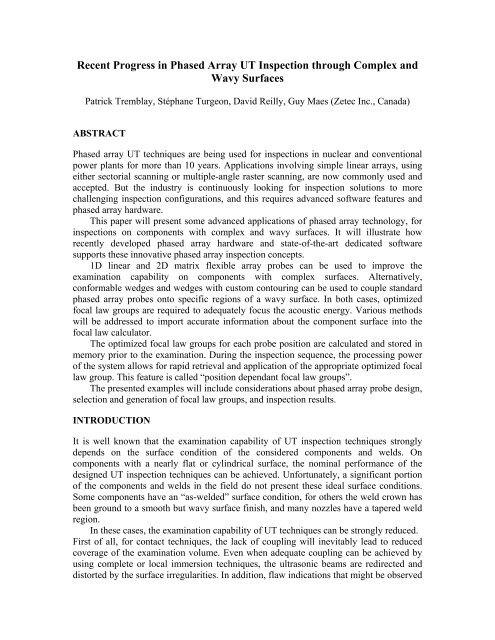
Recent Progress in <strong>Phased</strong> <strong>Array</strong> <strong>UT</strong> Inspection through Complex and<br />
Wavy Surfaces<br />
Patrick Tremblay, Stéphane Turgeon, David Reilly, Guy Maes (Zetec Inc., Canada)<br />
ABSTRACT<br />
<strong>Phased</strong> array <strong>UT</strong> techniques are being used <strong>for</strong> inspections in nuclear and conventional<br />
power plants <strong>for</strong> more than 10 years. Applications involving simple linear arrays, using<br />
either sectorial scanning or multiple-angle raster scanning, are now commonly used and<br />
accepted. But the industry is continuously looking <strong>for</strong> inspection solutions to more<br />
challenging inspection configurations, and this requires advanced s<strong>of</strong>tware features and<br />
phased array hardware.<br />
This paper will present some advanced applications <strong>of</strong> phased array technology, <strong>for</strong><br />
inspections on components with complex and wavy surfaces. It will illustrate how<br />
recently developed phased array hardware and state-<strong>of</strong>-the-art dedicated s<strong>of</strong>tware<br />
supports these innovative phased array inspection concepts.<br />
1D linear and 2D matrix flexible array probes can be used to improve the<br />
examination capability on components with complex surfaces. Alternatively,<br />
con<strong>for</strong>mable wedges and wedges with custom contouring can be used to couple standard<br />
phased array probes onto specific regions <strong>of</strong> a wavy surface. In both cases, optimized<br />
focal law groups are required to adequately focus the acoustic energy. Various methods<br />
will be addressed to import accurate in<strong>for</strong>mation about the component surface into the<br />
focal law calculator.<br />
The optimized focal law groups <strong>for</strong> each probe position are calculated and stored in<br />
memory prior to the examination. During the inspection sequence, the processing power<br />
<strong>of</strong> the system allows <strong>for</strong> rapid retrieval and application <strong>of</strong> the appropriate optimized focal<br />
law group. This feature is called “position dependant focal law groups”.<br />
The presented examples will include considerations about phased array probe design,<br />
selection and generation <strong>of</strong> focal law groups, and inspection results.<br />
INTRODUCTION<br />
It is well known that the examination capability <strong>of</strong> <strong>UT</strong> inspection techniques strongly<br />
depends on the surface condition <strong>of</strong> the considered components and welds. On<br />
components with a nearly flat or cylindrical surface, the nominal per<strong>for</strong>mance <strong>of</strong> the<br />
designed <strong>UT</strong> inspection techniques can be achieved. Un<strong>for</strong>tunately, a significant portion<br />
<strong>of</strong> the components and welds in the field do not present these ideal surface conditions.<br />
Some components have an “as-welded” surface condition, <strong>for</strong> others the weld crown has<br />
been ground to a smooth but wavy surface finish, and many nozzles have a tapered weld<br />
region.<br />
In these cases, the examination capability <strong>of</strong> <strong>UT</strong> techniques can be strongly reduced.<br />
First <strong>of</strong> all, <strong>for</strong> contact techniques, the lack <strong>of</strong> coupling will inevitably lead to reduced<br />
coverage <strong>of</strong> the examination volume. Even when adequate coupling can be achieved by<br />
using complete or local immersion techniques, the ultrasonic beams are redirected and<br />
distorted by the surface irregularities. In addition, flaw indications that might be observed
will not be correctly positioned by the imaging s<strong>of</strong>tware, and there<strong>for</strong>e extremely difficult<br />
to interpret.<br />
When using conventional <strong>UT</strong> techniques, the only partial solution <strong>for</strong> these issues is<br />
to reduce or adapt the footprint <strong>of</strong> the probe(s), and this <strong>of</strong>ten results in poor examination<br />
coverage and even poorer per<strong>for</strong>mance.<br />
This paper will demonstrate the potential <strong>of</strong> phased array technology to <strong>of</strong>fer<br />
adequate solutions <strong>for</strong> the <strong>UT</strong> examination <strong>of</strong> components with complex and wavy<br />
surfaces.<br />
PHASED ARRAY PROBE SOL<strong>UT</strong>IONS<br />
In terms <strong>of</strong> phased array probe design, several solutions have been considered to achieve<br />
adequate coupling through a complex surface.<br />
Flexible array probes have been successfully used in laboratory studies <strong>for</strong> more than<br />
5 years [1]. The first generation <strong>of</strong> flexible probes were rather bulky and not sufficiently<br />
robust <strong>for</strong> field deployment, but improved 1D and 2D flexible array designs have been<br />
developed, and are ready to be evaluated in industrial conditions [1]. This paper will<br />
present some examples <strong>of</strong> the application <strong>of</strong> flexible array probes on irregular inspection<br />
surfaces.<br />
Per<strong>for</strong>ming the <strong>UT</strong> examination in complete immersion is not always an option <strong>for</strong><br />
in-service inspections in power plants. The practical alternative is to use a local<br />
immersion technique, where a standard rigid phased array probe is coupled to the surface<br />
via a “water wedge”. The water is contained in the wedge by a con<strong>for</strong>mable low-loss<br />
membrane. This solution is cost-effective and its feasibility was demonstrated in recent<br />
studies [3]. Some issues may however arise with the robustness <strong>of</strong> the con<strong>for</strong>mable<br />
membrane <strong>for</strong> field inspections.<br />
For components where the surface irregularity is essentially limited to a single plane,<br />
e.g. an axisymmetric tapered nozzle, a solid wedge with a customized footprint can be an<br />
alternative <strong>for</strong> the con<strong>for</strong>mable wedge. Although this design has intrinsic limitations, it<br />
can provide a feasible and practical solution <strong>for</strong> some inspection configurations [4].<br />
INNOVATIONS IN HARDWARE AND SOFTWARE<br />
The phased array probe design is only a part <strong>of</strong> the overall inspection solution. Even if<br />
acoustic energy is well transmitted through the complex interface, the irregular shape<br />
may prevent adequate focusing <strong>of</strong> the sound beam in the region <strong>of</strong> interest.<br />
A major benefit <strong>of</strong> phased array technology is that adequate focusing <strong>of</strong> the acoustic<br />
energy can be achieved by optimizing the individual element delays to compensate <strong>for</strong><br />
the complex surface pr<strong>of</strong>ile.<br />
Different approaches can be used to implement the optimized element delays. Full<br />
Matrix Capture, with subsequent <strong>of</strong>f-line processing <strong>of</strong> the A-scans collected from the<br />
individual probe elements has been identified as the “ultimate solution” [3],[5]. Indeed,<br />
this method allows <strong>for</strong> <strong>of</strong>f-line reconstruction <strong>of</strong> sound beams with every possible wave<br />
mode, refracted angle and focusing. On the other hand, this solution is very time
consuming and may not yet be appropriate <strong>for</strong> industrial inspections. There<strong>for</strong>e, the use<br />
<strong>of</strong> predefined focal laws is worth exploring in more detail.<br />
At the end <strong>of</strong> 2007, Zetec launched its new DYNARAY® system, and very recently<br />
the DYNARAY® Lite was added to the productline. These extremely powerful phased<br />
array <strong>UT</strong> data acquisition systems can be configured with up to 256 (64 <strong>for</strong> DYNARAY<br />
Lite) simultaneously active channels and a large number <strong>of</strong> focal laws (up to 4096), to<br />
fully benefit from the versatility <strong>of</strong> 2D matrix array probes.<br />
The DYNARAY product line also <strong>of</strong>fers improved inspection capability on complex<br />
and wavy surfaces. Owing to its raw processing power, the system supports position<br />
dependant focal law groups. This means that predefined optimized focal law groups can<br />
be sent to the phased array probe during the inspection sequence as a function <strong>of</strong> the<br />
probe position.<br />
The new UltraVision® 3 s<strong>of</strong>tware, with advanced data acquisition and analysis<br />
functions, is required to drive the DYNARAY systems. UltraVision 3 includes all the<br />
features <strong>of</strong> the widely used UltraVision 1 s<strong>of</strong>tware, but in addition it <strong>of</strong>fers a 3D work<br />
environment <strong>for</strong> the creation <strong>of</strong> components, 3D ray-tracing, the generation <strong>of</strong> focal laws<br />
and the visualisation <strong>of</strong> examination data. In particular, the advanced phased array<br />
calculator in UltraVision 3 can generate optimized acoustic beams through complex<br />
inspection surfaces. In addition, the s<strong>of</strong>tware is capable <strong>of</strong> interpreting the spatial position<br />
in<strong>for</strong>mation <strong>of</strong> the beam exit points, to correctly position the phased array data in the<br />
specimen.<br />
A large part <strong>of</strong> the work scope <strong>for</strong> UltraVision 3 is dedicated to the development and<br />
validation <strong>of</strong> 3D tools to support advanced inspection techniques and array probes <strong>for</strong> the<br />
examination <strong>of</strong> complex surfaces. The ray-tracing, modelling and the experimental work<br />
described hereunder are part <strong>of</strong> the on-going internal validation program.<br />
Figure 1: DYNARAY and DYNARAY Lite phased array <strong>UT</strong> systems
TEST SPECIMENS<br />
A number <strong>of</strong> test specimens were designed and fabricated <strong>for</strong> the internal validation<br />
program. All specimens are made <strong>of</strong> aluminum and contain simple artificial reflectors. As<br />
the objective <strong>of</strong> the test program is to investigate the influence <strong>of</strong> the surface condition,<br />
potential influences <strong>of</strong> material and flaw morphology were deliberately eliminated. At<br />
this stage, the complexity <strong>of</strong> the surface was limited to a single plane.<br />
Several reference specimens were machined with a periodical “waviness” <strong>of</strong> the<br />
scanning surface, with various spatial periods and wave amplitudes. The wavy reference<br />
specimen in Figure 2 has a period <strong>of</strong> 50 mm and a peak-to-peak amplitude <strong>of</strong> 4 mm. Each<br />
segment <strong>of</strong> the surface is representative <strong>of</strong> a smoothed weld crown and the weld<br />
shrinkage on either side <strong>of</strong> the crown. The specimen contains two side-drilled holes with<br />
a diameter <strong>of</strong> 2 mm and a far-surface notch with a height <strong>of</strong> 10 mm. In addition, the<br />
specimen edges <strong>of</strong>fer specular reflectors at 30 degrees and 60 degrees inclination.<br />
A flat reference specimen (see Figure 2), containing identical reflectors, was used <strong>for</strong><br />
comparison purposes.<br />
To simulate more realistic inspections conditions, a specimen with a tapered<br />
surface was used, also containing side-drilled holes and machined notches. (see<br />
Figure 3). The pr<strong>of</strong>ile <strong>of</strong> this specimen is representative <strong>of</strong> the dissimilar metal<br />
weld region <strong>of</strong> a PWR pressurizer nozzle.<br />
Figure 2: Flat reference specimen (left) and wavy reference specimen (right)<br />
Figure 3: Realistic tapered specimen
3D RAY-TRACING<br />
The 3D ray tracing tool in UltraVision 3 allows the user to draw 3D rays into a CAD<br />
model <strong>of</strong> the component and visualize the interaction with various reflectors. The<br />
s<strong>of</strong>tware includes various templates <strong>of</strong> components and weld configurations, <strong>for</strong> which<br />
the user can adjust the geometrical parameters and postulate expected indications or<br />
reflectors. In addition, UltraVision 3 supports custom specimens, that can be imported as<br />
*.SAT files. This method was used during the test program on wavy specimens.<br />
Figure 4 shows 3D ray tracing in a wavy reference specimen and in a realistic<br />
tapered specimen. For each position on the specimen, the ideal impingement angle<br />
(measured between the ray and the normal to the flat backwall) and the corresponding<br />
refracted angle (measured between the ray and the normal to the inspection surface at the<br />
exit point) can be determined.<br />
Moreover, the 3D ray-tracing tool can be used to design inspection plans, to assess<br />
coverage, to determine beam direction in complex specimen such as penetrations in a<br />
boiler head, and to model the reflectors interactions <strong>for</strong> either conventional <strong>UT</strong> or phased<br />
array probes, all this in a user-friendly interface that does not require any CAD s<strong>of</strong>tware<br />
knowledge.<br />
Figure 4: 3D ray tracing in complex specimens
MODELLING AND EXPERIMENTAL VALIDATION OF FOCAL LAWS<br />
The advanced phased array calculator in UltraVision 3 provides a 3D graphical interface,<br />
which makes it relatively straight<strong>for</strong>ward to generate the required focal law groups <strong>for</strong> a<br />
phased array probe on a given component. Figure 5 shows typical images displayed in<br />
UltraVision 3 to visualize the focal law groups generated <strong>for</strong> a 1D linear flexible array,<br />
and a 1D linear rigid array fixed onto a rexolite wedge.<br />
Figure 5: Generation and visualization <strong>of</strong> focal laws in complex specimen<br />
Figure 6 shows the results obtained with a flexible 1D array (2 MHz, 24 elements,<br />
pitch 1.4 mm) <strong>for</strong> three different configurations. The leftmost images show actual <strong>UT</strong><br />
images and acoustic beam simulations obtained on the flat reference specimen, using<br />
azimuthal scanning from -75° to 75°LW. The two side-drilled holes (left) and the<br />
machined notch (right) are well detected and accurately positioned. As expected, the<br />
sound beams in the flat specimen are coherent and correctly oriented.<br />
The images in the middle show the results when the flexible array is applied onto the<br />
wavy reference specimen without adapting the focal laws <strong>for</strong> the surface condition. In<br />
this specific case, surprisingly, detection <strong>of</strong> the artificial reflectors is still fairly good, but<br />
the positioning is <strong>of</strong>f by at least 5 mm. This behaviour is corroborated by the results <strong>of</strong><br />
the acoustic beam modelling: the sound energy stays reasonably well-focused, but the<br />
orientation <strong>of</strong> the beams deviates from the intended directions.<br />
The rightmost images show the results <strong>for</strong> the flexible array on the wavy reference<br />
specimen with optimized focal laws and on-line correction <strong>of</strong> the sector scan image <strong>for</strong><br />
the actual surface geometry. The quality <strong>of</strong> the <strong>UT</strong> image, in terms <strong>of</strong> reflector detection<br />
and positioning is very close to the situation <strong>for</strong> the flat reference specimen. Also, the<br />
simulated beams are very similar to those calculated <strong>for</strong> the flat specimen.<br />
Figure 7 shows the results obtained with the flexible array on the realistic tapered<br />
specimen. The <strong>UT</strong> image and the acoustic beam simulation on the left side are obtained<br />
when the flexible array is applied onto the specimen without adapting the focal laws. The<br />
machined notch (h = 5 mm) is simply not detected, most probably because <strong>of</strong> the<br />
redirection <strong>of</strong> the acoustic beam caused by the tapered surface. The images on the right<br />
side are obtained with optimized focal laws and sector scan correction: the tip and the<br />
corner <strong>of</strong> the notch are well-detected and accurately positioned; at the same time the<br />
sound beam is correctly oriented through the complex surface.
flat reference specimen<br />
wavy reference specimen<br />
nominal focal laws<br />
wavy reference specimen<br />
optimized focal laws<br />
on-line sector scan correction<br />
Figure 6: Actual <strong>UT</strong> data (above) and corresponding acoustic beam modelling (below) from azimuthal<br />
scanning with flexible array on reference specimens<br />
realistic tapered specimen<br />
nominal focal laws<br />
realistic tapered specimen<br />
optimized focal laws<br />
on-line sector scan correction<br />
Figure 7: Actual <strong>UT</strong> data on machined notch (above) and corresponding acoustic beam modelling (below)<br />
from azimuthal scanning with flexible array on realistic tapered specimen
The optimization <strong>of</strong> the focal laws to compensate <strong>for</strong> the surface pr<strong>of</strong>ile at a specific<br />
probe position implicitly means that they are not adapted <strong>for</strong> any other position. This<br />
issue can be overcome by using position dependant focal law groups.<br />
This advanced tool <strong>of</strong> the UltraVision 3 s<strong>of</strong>tware allows the user to divide a complex<br />
inspection surface into “regions” with constant surface pr<strong>of</strong>ile, as shown on Figure 8.<br />
Optimized focal law groups <strong>for</strong> each region <strong>of</strong> the complex surface can be generated and<br />
stored during the setup process.<br />
The DYNARAY systems can dynamically select focal laws sent to the phased array<br />
probe during the inspection sequence as a function <strong>of</strong> the probe position. Up to 4,096<br />
different focal laws can be handled <strong>for</strong> a given setup. The encoder feedback in<strong>for</strong>ms the<br />
equipment about the position <strong>of</strong> the probe so it can apply in real-time the correct set <strong>of</strong><br />
focal laws <strong>for</strong> the corresponding surface pr<strong>of</strong>ile.<br />
The data acquired <strong>for</strong> each region can then be merged <strong>of</strong>fline and visualised as a<br />
single group, as shown on Figure 9.<br />
Figure 8: Definition <strong>of</strong> the “regions” on the realistic tapered specimen surface<br />
Figure 9: Actual <strong>UT</strong> data acquired with flexible array on realistic tapered specimen using the position<br />
dependant focal law groups tool
Generic observations<br />
• The inspection capability <strong>of</strong> a system based on flexible arrays is basically limited by<br />
the capability to mechanically “fit” the flexible probe to the considered wavy surface.<br />
• The generation <strong>of</strong> optimized focal laws through a complex surface is rather<br />
straight<strong>for</strong>ward, if the surface doesn’t present major discontinuities.<br />
• The capability to generate vertically polarized shear waves is very limited, and<br />
there<strong>for</strong>e not adequate to obtain volume coverage with an azimuthal sweep.<br />
• The use <strong>of</strong> the position dependant focal law groups allows acquiring optimized<br />
inspection data <strong>for</strong> different positions <strong>of</strong> a complex specimen in real-time and in a<br />
single data file.<br />
3D IMAGING OF PHASED ARRAY <strong>UT</strong> DATA<br />
In order to facilitate and expedite the analysis process <strong>for</strong> phased array inspections on<br />
complex components, the Volumetric Merge tool in UltraVision 3 has been enhanced to<br />
allow <strong>for</strong> realistic 3D visualization <strong>of</strong> phased array data in the CAD model <strong>of</strong> the<br />
component.<br />
Figure 10 shows the 3D visualization <strong>of</strong> merged phased array data at 50°SW,<br />
recorded with a rigid 1D linear array and custom wedge, in a tapered nozzle specimen.<br />
Obviously, this type <strong>of</strong> representation allows <strong>for</strong> accurate positioning and sizing <strong>of</strong> flaw<br />
indications, even in complex components, thus drastically improving the examination<br />
per<strong>for</strong>mance.<br />
Figure 10: 3D image <strong>of</strong> merged phased array <strong>UT</strong> data obtained with rigid 1D linear array and custom<br />
wedge, in tapered nozzle specimen
CONCLUSIONS<br />
From the work presented in this paper, the following conclusions can be drawn:<br />
1. <strong>Phased</strong> array technology definitely has the potential to <strong>of</strong>fer adequate solutions <strong>for</strong> the<br />
<strong>UT</strong> examination <strong>of</strong> components with complex and wavy surfaces.<br />
2. Several alternatives are feasible in terms <strong>of</strong> probe design: flexible array probes, and<br />
rigid array probes with a con<strong>for</strong>mable or customized wedge<br />
3. The use <strong>of</strong> position dependant focal laws that compensate <strong>for</strong> the irregularity <strong>of</strong> the<br />
surface in each region, is essential to obtain adequate examination capability on<br />
complex and wavy surfaces.<br />
4. Enhanced <strong>UT</strong> imaging, taking into account the surface geometry, can drastically<br />
improve the interpretation <strong>of</strong> the examination data.<br />
5. State-<strong>of</strong>-the-art s<strong>of</strong>tware supporting these advanced inspection solutions is<br />
commercially available, and further development <strong>of</strong> new features is on-going.<br />
REFERENCES<br />
[1] G. Toullelan, A. Nadim, O. Casula, E. Abittan, “Piping Inspection using a 3D Smart<br />
Flexible <strong>Phased</strong> <strong>Array</strong> Transducer”, 6 th Int. Conf. on NDE in Relation to Structural<br />
Integrity <strong>for</strong> Nuclear and Pressurised Components, Budapest, October 2007.<br />
[2] Imasonic, “Sondes miniatures et flexibles, les nouveaux défis de la technologie<br />
multiéléments", Journées COFREND, Toulouse, May 2008.<br />
[3] R. Long, J. Russel, P. Cawley, “Non-Destructive Inspection <strong>of</strong> Components with<br />
Irregular Surfaces using a Con<strong>for</strong>mable Ultrasonic <strong>Phased</strong> <strong>Array</strong>”, 6 th Int. Conf. on<br />
NDE in Relation to Structural Integrity <strong>for</strong> Nuclear and Pressurised Components,<br />
Budapest, October 2007.<br />
[4] G. Maes, S. Turgeon, D. Reilly, “Advanced <strong>Phased</strong> <strong>Array</strong> <strong>UT</strong> Inspection through<br />
Complex Surfaces”, 7 th Int. Conf. on NDE in Relation to Structural Integrity <strong>for</strong><br />
Nuclear and Pressurised Components, Yokohama, April 2009.<br />
[5] C. Holmes, B. W. Brinkwater, P. D. Wilcox, “Post-processing <strong>of</strong> the full matrix <strong>of</strong><br />
ultrasonic transmit-receive array data <strong>for</strong> non-destructive evaluation”, NDT&E<br />
International, 38, 2005, pp.701-711.