Land Cover Classification of Remotely Sensed Satellite Data using ...
Land Cover Classification of Remotely Sensed Satellite Data using ...
Land Cover Classification of Remotely Sensed Satellite Data using ...

You also want an ePaper? Increase the reach of your titles
YUMPU automatically turns print PDFs into web optimized ePapers that Google loves.
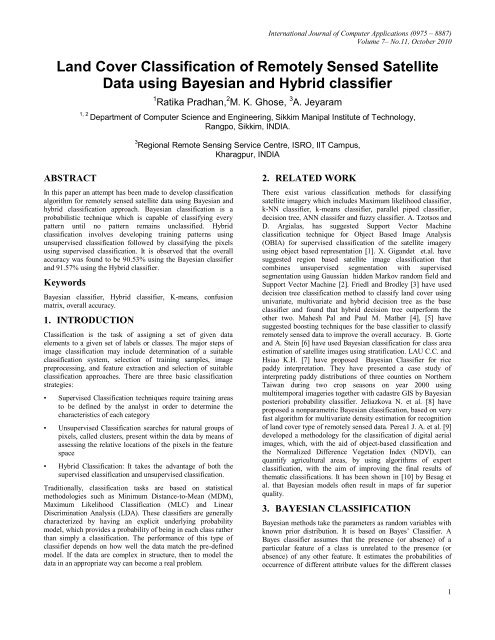
International Journal <strong>of</strong> Computer Applications (0975 – 8887)<br />
Volume 7– No.11, October 2010<br />
<strong>Land</strong> <strong>Cover</strong> <strong>Classification</strong> <strong>of</strong> <strong>Remotely</strong> <strong>Sensed</strong> <strong>Satellite</strong><br />
<strong>Data</strong> <strong>using</strong> Bayesian and Hybrid classifier<br />
1 Ratika Pradhan, 2 M. K. Ghose, 3 A. Jeyaram<br />
1, 2<br />
Department <strong>of</strong> Computer Science and Engineering, Sikkim Manipal Institute <strong>of</strong> Technology,<br />
Rangpo, Sikkim, INDIA.<br />
3 Regional Remote Sensing Service Centre, ISRO, IIT Campus,<br />
Kharagpur, INDIA<br />
ABSTRACT<br />
In this paper an attempt has been made to develop classification<br />
algorithm for remotely sensed satellite data <strong>using</strong> Bayesian and<br />
hybrid classification approach. Bayesian classification is a<br />
probabilistic technique which is capable <strong>of</strong> classifying every<br />
pattern until no pattern remains unclassified. Hybrid<br />
classification involves developing training patterns <strong>using</strong><br />
unsupervised classification followed by classifying the pixels<br />
<strong>using</strong> supervised classification. It is observed that the overall<br />
accuracy was found to be 90.53% <strong>using</strong> the Bayesian classifier<br />
and 91.57% <strong>using</strong> the Hybrid classifier.<br />
Keywords<br />
Bayesian classifier, Hybrid classifier, K-means, confusion<br />
matrix, overall accuracy.<br />
1. INTRODUCTION<br />
<strong>Classification</strong> is the task <strong>of</strong> assigning a set <strong>of</strong> given data<br />
elements to a given set <strong>of</strong> labels or classes. The major steps <strong>of</strong><br />
image classification may include determination <strong>of</strong> a suitable<br />
classification system, selection <strong>of</strong> training samples, image<br />
preprocessing, and feature extraction and selection <strong>of</strong> suitable<br />
classification approaches. There are three basic classification<br />
strategies:<br />
• Supervised <strong>Classification</strong> techniques require training areas<br />
to be defined by the analyst in order to determine the<br />
characteristics <strong>of</strong> each category<br />
• Unsupervised <strong>Classification</strong> searches for natural groups <strong>of</strong><br />
pixels, called clusters, present within the data by means <strong>of</strong><br />
assessing the relative locations <strong>of</strong> the pixels in the feature<br />
space<br />
• Hybrid <strong>Classification</strong>: It takes the advantage <strong>of</strong> both the<br />
supervised classification and unsupervised classification.<br />
Traditionally, classification tasks are based on statistical<br />
methodologies such as Minimum Distance-to-Mean (MDM),<br />
Maximum Likelihood <strong>Classification</strong> (MLC) and Linear<br />
Discrimination Analysis (LDA). These classifiers are generally<br />
characterized by having an explicit underlying probability<br />
model, which provides a probability <strong>of</strong> being in each class rather<br />
than simply a classification. The performance <strong>of</strong> this type <strong>of</strong><br />
classifier depends on how well the data match the pre-defined<br />
model. If the data are complex in structure, then to model the<br />
data in an appropriate way can become a real problem.<br />
2. RELATED WORK<br />
There exist various classification methods for classifying<br />
satellite imagery which includes Maximum likelihood classifier,<br />
k-NN classifier, k-means classifier, parallel piped classifier,<br />
decision tree, ANN classifer and fuzzy classifier. A. Tzotsos and<br />
D. Argialas, has suggested Support Vector Machine<br />
classification technique for Object Based Image Analysis<br />
(OBIA) for supervised classification <strong>of</strong> the satellite imagery<br />
<strong>using</strong> object based representation [1]. X. Gigandet et.al. have<br />
suggested region based satellite image classification that<br />
combines unsupervised segmentation with supervised<br />
segmentation <strong>using</strong> Gaussian hidden Markov random field and<br />
Support Vector Machine [2]. Friedl and Brodley [3] have used<br />
decision tree classification method to classify land cover <strong>using</strong><br />
univariate, multivariate and hybrid decision tree as the base<br />
classifier and found that hybrid decision tree outperform the<br />
other two. Mahesh Pal and Paul M. Mather [4], [5] have<br />
suggested boosting techniques for the base classifier to classify<br />
remotely sensed data to improve the overall accuracy. B. Gorte<br />
and A. Stein [6] have used Bayesian classification for class area<br />
estimation <strong>of</strong> satellite images <strong>using</strong> stratification. LAU C.C. and<br />
Hsiao K.H. [7] have proposed Bayesian Classifier for rice<br />
paddy interpretation. They have presented a case study <strong>of</strong><br />
interpreting paddy distributions <strong>of</strong> three counties on Northern<br />
Taiwan during two crop seasons on year 2000 <strong>using</strong><br />
multitemporal imageries together with cadastre GIS by Bayesian<br />
posteriori probability classifier. Jeliazkova N. et al. [8] have<br />
proposed a nonparametric Bayesian classification, based on very<br />
fast algorithm for multivariate density estimation for recognition<br />
<strong>of</strong> land cover type <strong>of</strong> remotely sensed data. Perea1 J. A. et al. [9]<br />
developed a methodology for the classification <strong>of</strong> digital aerial<br />
images, which, with the aid <strong>of</strong> object-based classification and<br />
the Normalized Difference Vegetation Index (NDVI), can<br />
quantify agricultural areas, by <strong>using</strong> algorithms <strong>of</strong> expert<br />
classification, with the aim <strong>of</strong> improving the final results <strong>of</strong><br />
thematic classifications. It has been shown in [10] by Besag et<br />
al. that Bayesian models <strong>of</strong>ten result in maps <strong>of</strong> far superior<br />
quality.<br />
3. BAYESIAN CLASSIFICATION<br />
Bayesian methods take the parameters as random variables with<br />
known prior distribution. It is based on Bayes’ Classifier. A<br />
Bayes classifier assumes that the presence (or absence) <strong>of</strong> a<br />
particular feature <strong>of</strong> a class is unrelated to the presence (or<br />
absence) <strong>of</strong> any other feature. It estimates the probabilities <strong>of</strong><br />
occurrence <strong>of</strong> different attribute values for the different classes<br />
1
International Journal <strong>of</strong> Computer Applications (0975 – 8887)<br />
Volume 7– No.11, October 2010<br />
in a training set. It then uses these probabilities to classify recall<br />
patterns.<br />
Let<br />
A be an array <strong>of</strong> M ≥1 attributes A 1 ,A 2 ,…..,A M for the<br />
patterns <strong>of</strong> a training set, and<br />
P(A*) is the probability that a training pattern has attribute<br />
array A*, regardless <strong>of</strong> the class to which the pattern<br />
belongs, the attributes having discrete values.<br />
Suppose the training set has patterns from m≥1 classes C 1 , C 2 …<br />
C m . For 1≤k≤m, we define the following probabilities.<br />
P (C k ) is the probability that a training pattern belongs to<br />
class C k . It is also known as the prior probability <strong>of</strong> class<br />
C k.<br />
P (C k | A*) is the probability that a training pattern with<br />
attribute array A* belongs to class C k . this is also known as<br />
the posterior probability <strong>of</strong> C k for a given A*. The<br />
attributes have discrete values.<br />
P (A*|C k ) is the conditional probability that a training<br />
pattern <strong>of</strong> class C k has attribute array A*, the attributes<br />
having discrete values.<br />
p (A*|C k ) is the conditional probability density that a<br />
training pattern <strong>of</strong> class C k has attribute array A*, the<br />
attributes having continuous values.<br />
According to the Bayes’ theorem <strong>of</strong> probability theory<br />
Suppose the number <strong>of</strong> patterns in class Ck is | Ck |, for 1 ≤ k ≤<br />
m. Then under the conventional estimation known as the<br />
maximum - likelihood estimation,<br />
Under the alternative estimation, called the Bayesian estimation,<br />
In the Bayesian estimation, we assume the number <strong>of</strong> patterns <strong>of</strong><br />
each class to be one more than actually present in the training<br />
set. For a typical training set with a lot <strong>of</strong> patterns (that is,<br />
is a large number), both the maximum likelihood and<br />
Bayesian estimates give approximately equal values. Moreover<br />
for both estimates,<br />
, as it should be. One<br />
difference exists between the two estimations: in the maximum<br />
likelihood estimation, P (Ck) > 0. In other words, in the<br />
Bayesian estimation a probability is never equal to zero.<br />
(1)<br />
(2)<br />
(3)<br />
K-means is one <strong>of</strong> the simplest unsupervised learning algorithms<br />
that solve the well known clustering problem. The procedure<br />
follows a simple and easy way to classify a given data set<br />
through a certain number <strong>of</strong> clusters (assume k clusters) fixed a<br />
priori. This main idea is to define k centroids, one for each<br />
cluster. These centroids should be placed in cunning way<br />
because different locations cause different results. So, the better<br />
choice is to place them as far away as possible from each other.<br />
The next step is to take each point belonging to a given data set<br />
and associate it to the nearest centroid. When no point is<br />
pending, the first step is completed and an early grouping is<br />
done. At this point we need to re-calculate k new centroids <strong>of</strong><br />
the clusters resulting from the previous step. After we have these<br />
k new centroids, a new binding has to be done between the same<br />
data set points and the nearest new centroid. A loop has been<br />
generated. As a result <strong>of</strong> this loop we may notice that the k<br />
centroids change their locations step by step until no more<br />
changes are done. In other words, centroids do not move any<br />
more.<br />
Steps Involved in K-means clustering:<br />
Step 1. Place K points into the space represented by the object<br />
that is being clustered. These points represent initial<br />
group centroids.<br />
Step 2. Assign each object to the group that has the closest<br />
centroid.<br />
Step 3. When all the objects have been assigned, recalculate the<br />
positions <strong>of</strong> the k centroids.<br />
Step 4. Repeat steps 2 and 3 until the centroids no longer move.<br />
This produces a separation <strong>of</strong> the objects into groups<br />
from which the metric to be minimized can be calculated<br />
[11].<br />
5. RESULTS AND DISCUSSIONS<br />
To validate the applicability <strong>of</strong> the proposed Bayesian and<br />
Hybrid Classifier, a case study is presented in this section, which<br />
is carried out on IRS-1C/LISS III sample image with 23m<br />
resolution. The FCC (False Color Composite) <strong>of</strong> the input image<br />
(Figure 1) belongs to East Sikkim, India and band used to<br />
prepare FCC includes – Red (R), Green (G), Near Infrared<br />
(NIR). The IRS-IC/LISS III data <strong>of</strong> East Sikkim was acquired<br />
on October, 2006. The input image is shown in Figure 1. Figure<br />
2 shows the result <strong>of</strong> applying Bayesian Classifier and figure 3<br />
shows the result <strong>of</strong> applying Hybrid Classifier. In hybrid<br />
classifer, K-means clustering algorithm is used first to refine the<br />
training patterns. These refined training patterns were given as<br />
input to the Bayesian <strong>Classification</strong> Algorithm and the results<br />
thus obtained are an improvement over the previous method.<br />
4. HYBRID CLASSIFICATION<br />
Hybrid <strong>Classification</strong> includes the advantages <strong>of</strong> both supervised<br />
as well as unsupervised classification. We implemented hybrid<br />
classification to refine the results obtained from Bayesian<br />
<strong>Classification</strong>. For unsupervised classification, K-means<br />
clustering algorithm is used followed by Bayesian Method for<br />
supervised classification.<br />
2
International Journal <strong>of</strong> Computer Applications (0975 – 8887)<br />
Volume 7– No.11, October 2010<br />
Figure 2: Classified image based on Hybrid classifier.<br />
Figure 1: FCC (IRS LISS III Image –2006) <strong>of</strong> study area –<br />
East Sikkim, INDIA, Band used – Red (R), Green (G), Near<br />
Infrared (NIR).<br />
Table 1: Confusion Matrix for Bayesian <strong>Classification</strong>.<br />
REFERENCE DATA<br />
Cloud Forest Ice River<br />
Settle-<br />
ment<br />
Row<br />
Total<br />
Cloud 483 0 0 0 0 483<br />
Forest 14 130 15 7 3 169<br />
Ice 2 1 187 0 3 193<br />
River 0 5 0 113 18 136<br />
Settlement 6 9 0 17 44 76<br />
Column<br />
Total<br />
505 145 202 137 68 1057<br />
Table 2: Error and accuracy for Bayesian <strong>Classification</strong>.<br />
Classes<br />
Commission<br />
Error<br />
(%)<br />
Omission<br />
Error<br />
(%)<br />
Producer’s<br />
Accuracy<br />
(%)<br />
User’s<br />
Accuracy<br />
(%)<br />
Cloud 0 5.66 95.64 100<br />
Figure 2: Classified image based on Bayesian classifier.<br />
Forest 23.08 10.34 89.66 76.92<br />
Ice 3.11 7.42 92.57 96.89<br />
River 16.91 17.52 82.48 83.09<br />
Settlement 42.11 35.29 64.71 57.89<br />
3
International Journal <strong>of</strong> Computer Applications (0975 – 8887)<br />
Volume 7– No.11, October 2010<br />
To assess accuracy <strong>of</strong> the proposed technique, the confusion<br />
matrix along with the errors <strong>of</strong> omission and commission and<br />
producer and user accuracy for Bayesian Classifier is given in<br />
Table 1 and Table 2 respectively. For hybrid classifier the<br />
confusion matrix along with the errors <strong>of</strong> omission and<br />
commission and producer and user accuracy for Bayesian<br />
Classifier is given in Table 3 and Table 4 respectively. The<br />
Overall Accuracy <strong>of</strong> Bayesian Classifier and Hybrid classifier<br />
are 90.53% and 91.59% respectively.<br />
Table 3.6: Confusion Matrix for Hybrid <strong>Classification</strong>.<br />
REFERENCE DATA<br />
C F I R S<br />
Row<br />
Total<br />
Cloud 483 0 0 0 0 483<br />
Forest 16 139 8 2 4 169<br />
Ice 7 0 207 2 2 218<br />
River 0 14 0 113 9 136<br />
Settlement 6 18 1 2 49 76<br />
Column<br />
Total<br />
512 171 216 119 64 1082<br />
Table 3.7: Error and accuracy for Hybrid <strong>Classification</strong>.<br />
Classes<br />
Commission<br />
Error (%)<br />
Omission<br />
Error (%)<br />
Producer’s<br />
Accuracy<br />
(%)<br />
User’s<br />
Accuracy<br />
(%)<br />
Cloud 0 5.66 94.33 100<br />
Forest 17.75 18.71 81.28 82.24<br />
Ice 5.04 4.16 95.83 94.95<br />
River 16.91 5.04 94.95 83.08<br />
Settlement 35.52 23.43 76.56 64.47<br />
6. SUMMARY AND CONCLUSION<br />
In this paper, a Bayesian classifier and hybrid classifier<br />
algorithm for remotely sensed satellite data has been developed.<br />
To test and validate the algorithm, the sample image taken into<br />
consideration is multi-spectral IRS-1C/LISS III <strong>of</strong> East Sikkim,<br />
India. The proposed classifier can also be used for hyperspectral<br />
remote sensing data considering the best bands as input<br />
for preparing spectral class distribution. The sample image is<br />
classified by both Bayesian and Hybrid classifier and then the<br />
overall accuracy were calculated. The overall accuracy for the<br />
sample test image was found to be 90.53% <strong>using</strong> the Bayesian<br />
classifier and 91.59% <strong>using</strong> the Hybrid respectively. The reason<br />
for high accuracy may be to some extent attributed for the<br />
reason that the part <strong>of</strong> the training set is being considered as<br />
ground truths instead <strong>of</strong> actual data. Since the accuracy <strong>of</strong> the<br />
results depends only upon the test set chosen, the efficiency <strong>of</strong><br />
any algorithm shall not be considered on the accuracy measure<br />
alone. The classified images shall also be compared ground truth<br />
information physically. From the comparison, it is found that<br />
both the methods are equally efficient.<br />
7. ACKNOWLEDGMENT<br />
We would like to thank All India Council for Technical<br />
Education (AICTE) for funding the project title “Contour<br />
Mapping and 3D Surface Modeling <strong>of</strong> State Sikkim” fully<br />
sponsored by All India Council <strong>of</strong> Technical Education, Govt. <strong>of</strong><br />
India vide order no- 8023/BOR/RID/RPS-44/2008-09. We also<br />
like to thank my fellow students – Bhanu, Khushboo and Prerna<br />
for their invaluable support.<br />
8. REFERENCES<br />
[1] Tzotsos A. and Argialas D. 2008. Support Vector Machine<br />
<strong>Classification</strong> for Object-Based Image Analysis, LNGC,<br />
pp. 663–667.<br />
[2] Gigandet X. et al. 2005. Region-Based <strong>Satellite</strong> Image<br />
<strong>Classification</strong>: Method and Validation, Proc. <strong>of</strong> IEEE<br />
International Conference on Image Processing, pp. 832-<br />
835.<br />
[3] Friedl, M.A., and Brodley, C.E., 1997. Decision tree<br />
classification <strong>of</strong> land cover from remotely sensed data,<br />
Remote Sensing <strong>of</strong> Environment, Vol. 61, pp 399–409.<br />
[4] Mahesh Pal, and Paul M. Mathers, 2001. Decision Tree<br />
Based <strong>Classification</strong> <strong>of</strong> <strong>Remotely</strong> <strong>Sensed</strong> <strong>Data</strong>, 22nd Asian<br />
Conference on Remote Sensing.<br />
[5] Mahesh Pal, and Paul M. Mathers, 2003. An assessment <strong>of</strong><br />
the effectiveness <strong>of</strong> decision tree methods for land cover<br />
classification, Remote Sensing <strong>of</strong> Environment, Vol. 86, pp<br />
554–565.<br />
[6] Gorte, B. and Stein, A. 2002. Bayesian classification and<br />
class area estimation <strong>of</strong> satellite images <strong>using</strong> stratification,<br />
IEEE Transactions on Geoscience and Remote Sensing, pp.<br />
803-812.<br />
[7] LAU C.C. and Hsiao K.H. (2002). Bayesian <strong>Classification</strong><br />
for rice paddy interpretation, in proc. <strong>of</strong> Asian Conference<br />
on Remote Sensing, p 140.<br />
[8] Jeliazkova N., Ruseva S., and Boyanov K. (2006).<br />
Application <strong>of</strong> nonparametric Bayesian classifier to remote<br />
sensing data.<br />
[9] Perea1 J. A., Meroño1 J. E., and Aguilera1 M. J. (2009).<br />
Algorithms <strong>of</strong> Expert <strong>Classification</strong> applied in Quickbird<br />
satellite images for <strong>Land</strong> use mapping, Chilean journal <strong>of</strong><br />
agricultural research, Vol. 69, No. 3, pp. 400-405.<br />
[10] Besag, J., J. York, and A. Mollie. 1991. Bayesian image<br />
restoration, with two applications in spatial statistics (with<br />
discussion). Annals <strong>of</strong> the Institute <strong>of</strong> Statistical<br />
Mathematics Vol. 43, pp.1- 59.<br />
[11] Earl Gose, Richard Johnsonbaugh and Steve Jost (1996),<br />
Pattern recognition and image analysis, USA.<br />
4