Multiple different laminar velocity profiles in separate veins in the ...
Multiple different laminar velocity profiles in separate veins in the ...
Multiple different laminar velocity profiles in separate veins in the ...

Create successful ePaper yourself
Turn your PDF publications into a flip-book with our unique Google optimized e-Paper software.
Lam<strong>in</strong>ar <strong>velocity</strong> <strong>in</strong> microvascular network of bra<strong>in</strong><br />
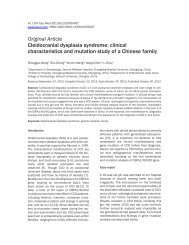
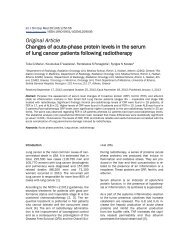
Figure 4. OPS imag<strong>in</strong>g show<strong>in</strong>g <strong>the</strong> venular network <strong>in</strong> <strong>the</strong> microvascular preparation of <strong>the</strong> bra<strong>in</strong>. The phenomenon<br />
with ma<strong>in</strong>ta<strong>in</strong>ed multi <strong>lam<strong>in</strong>ar</strong> flow profile effects was recorded <strong>in</strong> all 20 animal preparations, here show<strong>in</strong>g 15 of<br />
<strong>the</strong>m. Calibration bar is 50 µm; (V) venule; arrows <strong>in</strong>dicate flow directions; Arterioles (A). Visualizations were by <strong>the</strong><br />
CYTOSCAN E-II device with x 10 lens.<br />
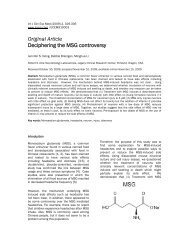
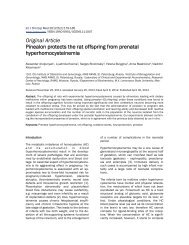
Figure 5. Depend<strong>in</strong>g on <strong>the</strong> number of venules jo<strong>in</strong><strong>in</strong>g<br />
to form a larger vessel (center of image), <strong>the</strong>re is a<br />
correspond<strong>in</strong>g number of flow <strong>profiles</strong>. For each vessel<br />
<strong>the</strong> number of <strong>lam<strong>in</strong>ar</strong> blood flow patterns visible<br />
is depicted (black text). In this preparation more than<br />
8 <strong>separate</strong> <strong>lam<strong>in</strong>ar</strong> flow <strong>profiles</strong> were discernible<br />
when <strong>the</strong> large vessel was formed and that exits <strong>the</strong><br />
image to <strong>the</strong> lower right. Bar <strong>in</strong>dicate 100 µm.<br />
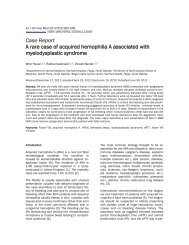
or effects of ventilation (Figure 7). When <strong>different</strong><br />
<strong>lam<strong>in</strong>ar</strong> flow <strong>profiles</strong> were exam<strong>in</strong>ed, it was<br />
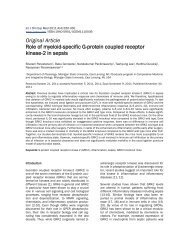
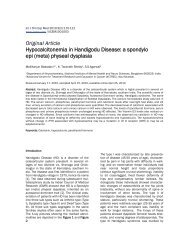
Figure 6. The <strong>lam<strong>in</strong>ar</strong> blood flow <strong>profiles</strong> generated<br />
from <strong>the</strong> venule marked with an arrow (diameter 9.9<br />
µm) as it is jo<strong>in</strong><strong>in</strong>g <strong>the</strong> larger venule (with its 4 <strong>lam<strong>in</strong>ar</strong><br />
flows (Flow direction and arrow)) <strong>the</strong> length of<br />
<strong>the</strong> ma<strong>in</strong>ta<strong>in</strong>ed flow profile is at least 215.8 µm, also<br />
marked with an arrow. A-a <strong>in</strong>dicates arterial – arterial<br />
anastomoses. Bar corresponds to 100 µm.<br />
evident that each of <strong>the</strong>se <strong>profiles</strong> depicted a<br />
<strong>different</strong> blood cell <strong>velocity</strong> (Figure 3). This was<br />
also clearly evident by just exam<strong>in</strong><strong>in</strong>g <strong>the</strong><br />
smaller dimension vessels <strong>in</strong> <strong>the</strong> OPS system.<br />
13 Int J Cl<strong>in</strong> Exp Med 2011;4(1):10-16