Maria Luisa Paracchini, Maria Luisa Paracchini, Maria Luisa ...
Maria Luisa Paracchini, Maria Luisa Paracchini, Maria Luisa ...
Maria Luisa Paracchini, Maria Luisa Paracchini, Maria Luisa ...

You also want an ePaper? Increase the reach of your titles
YUMPU automatically turns print PDFs into web optimized ePapers that Google loves.
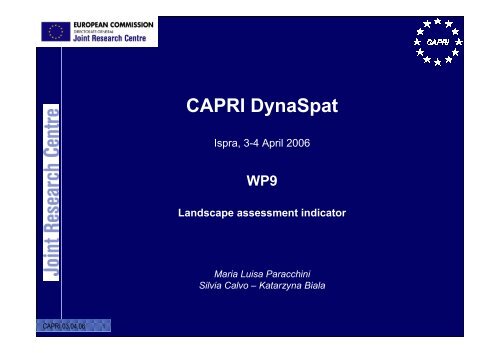
CAPRI DynaSpat<br />
Ispra, 3-4 April 2006<br />
WP9<br />
Landscape assessment indicator<br />
<strong>Maria</strong> <strong>Luisa</strong> <strong>Paracchini</strong><br />
Silvia Calvo – Katarzyna Biala<br />
CAPRI 03.04.06<br />
1
2<br />
CAPRI 03.04.06
Genetic aspects<br />
Genetic diversity in farm species<br />
(from ELISA project – EnvironmentaL Indicators for Sustainable<br />
Agriculture)<br />
Certain categories of plant species used by farmers show larger<br />
genetic diversity.<br />
There are specific combinations of crop species that show higher or<br />
lower genetic diversity.<br />
Knowing where areas characterised by low genetic diversity occurs<br />
gives a gross indirect indication of agricultural areas in which the<br />
farming system is intensive and the use of agro-chemicals is high.<br />
CAPRI 03.04.06<br />
3
Genetic diversity<br />
UAA with higher genetic diversity<br />
/Tot. UAA<br />
%UAA to pasture + forage + grapes +<br />
olives<br />
UAA with lower genetic diversity<br />
/Tot. UAA<br />
%UAA to cereals + horticultural crops<br />
+ fruits<br />
GRAS<br />
LOLIV<br />
LTWIN<br />
OFAR<br />
BARL<br />
CITR<br />
DWHE<br />
LFRUI<br />
LMAIZ<br />
LRAPE<br />
LTEXT<br />
OATS<br />
OCER<br />
OVEG<br />
PARI<br />
POTA<br />
PULS<br />
ROOF<br />
Permanent grass and grazing<br />
Olive groves<br />
Vineyards<br />
Fodder other on arable land<br />
Barley<br />
Citrus fruits<br />
Durum Wheat<br />
Fruit tree and berry plantations<br />
Maize<br />
Rape and turnip rape<br />
Fibre and oleaginous crops<br />
Oats<br />
Other cereals<br />
Other fresh vegetables<br />
Rice<br />
Potatoes<br />
Dry pulses<br />
Other root crops<br />
CAPRI 03.04.06<br />
Not included<br />
4<br />
FLOW<br />
LFALL<br />
NURS<br />
OCRO<br />
OIND<br />
Floriculture<br />
Fallow land<br />
Nurseries<br />
Other crops<br />
Other non permanent<br />
industrial crops<br />
SOYA<br />
SUGB<br />
SUNF<br />
SWHE<br />
TOBA<br />
TOMA<br />
Soya<br />
Sugar beet<br />
Sunflower<br />
Common wheat<br />
Tobacco<br />
Tomatoes
5<br />
CAPRI 03.04.06
6<br />
CAPRI 03.04.06
Crop diversity<br />
Cultivation methods of each crop vary so that a multitude of<br />
crops provides a multitude of habitats for species. A high value<br />
of the index is likely to describe positive impacts on the<br />
environment.<br />
High number of crops in an agricultural landscape guarantee an<br />
equivalent of different cultivation methods. Corresponding to both an<br />
increase of different living conditions for species is provided. Vice versa<br />
for crop rotations limit the number of habitats for wildlife species and<br />
demand higher inputs of mineral fertilisers and pesticides.<br />
(Indicators related to agricultural practices: intermediate results of Eurostat’s PAIS project –<br />
H.-P. Piorr et al. – OECD expert meeting on farm management indicators and the enviroment<br />
– 8/12 March 2004, Palmerston North, New Zealand)<br />
CAPRI 03.04.06<br />
7
Crop diversity can be calculated in different ways:<br />
• Sum of different crops in a landscape unit (in this case a cell 1 km * 1<br />
km)<br />
•Simpson’s Diversity Index<br />
P i<br />
= proportion of the landscape occupied by patch type (class) i, based on total landscape area (A)<br />
excluding any internal background present.<br />
SIDI = 0 when the landscape contains only 1 patch (i.e., no diversity). SIDI approaches 1 as the<br />
number of different patch types (i.e., patch richness, PR) increases and the proportional<br />
distribution of area among patch types becomes more equitable.<br />
• Shannon’s Diversity Index<br />
SHDI = 0 when the landscape contains only 1 patch (i.e., no diversity). SHDI increases as the<br />
number of different patch types (i.e., patch richness, PR) increases and/or the proportional<br />
distribution of area among patch types becomes more equitable.<br />
CAPRI 03.04.06<br />
8
9<br />
CAPRI 03.04.06
10<br />
CAPRI 03.04.06
Indicateur intégré de diversité de culture (SOLAGRO 2005)<br />
The index represents crop variety with a "biodiversity weight"<br />
Each crop scores 1 when the area covered exceeds 10% of the UAA<br />
Pastures/grasslands score 1 point per each tenth of the UAA covered<br />
This is a first attempt to relate the CAPRI-derived indicator to the<br />
original one, which is calculated on the basis of farm statistics (all<br />
farms in France) per commune<br />
CAPRI 03.04.06<br />
11
12<br />
Crop diversity - 1<br />
CAPRI 03.04.06
13<br />
Crop diversity - 2<br />
CAPRI 03.04.06
High Nature Value farmland (HNV) are<br />
those defined as ‘areas in Europe where<br />
agriculture is a major (usually the<br />
dominant) land use and where that<br />
agriculture supports or is associated with<br />
either a high species and habitat diversity<br />
or the presence of species of European<br />
conservation concern or both’<br />
Andersen E. (ed.) (2003). Developing<br />
a high nature value farming area<br />
indicator. Internal report. EEA,<br />
Copenhagen<br />
CAPRI 03.04.06<br />
14
Sum of cereal crops reclassified presence/absence , multiplied by fallow land areas<br />
CAPRI 03.04.06<br />
15