Elsevier Editorial System(tm) for Spectrochimica Acta Part A ...
Elsevier Editorial System(tm) for Spectrochimica Acta Part A ...
Elsevier Editorial System(tm) for Spectrochimica Acta Part A ...

Create successful ePaper yourself
Turn your PDF publications into a flip-book with our unique Google optimized e-Paper software.
<strong>Elsevier</strong> <strong>Editorial</strong> <strong>System</strong>(<strong>tm</strong>) <strong>for</strong> <strong>Spectrochimica</strong> <strong>Acta</strong> <strong>Part</strong> A: Molecular and<br />
Biomolecular Spectroscopy<br />
Manuscript Draft<br />
Manuscript Number: SAA-D-11-01528<br />
Title: Characterization of Solid Polymer Dispersions of Active Pharmaceutical Ingredients by 19F MAS<br />
NMR and Factor Analysis<br />
Article Type: CSI XXXVII Special Issue<br />
Keywords: Solid-state NMR; Factor analysis; 19F MAS NMR; API; Solid dispersions; Magnetic<br />
susceptibility.<br />
Corresponding Author: Dr. Martina Urbanova,<br />
Corresponding Author's Institution: Institute of Macromolecular Chemistry AS CR, v.v.i.<br />
First Author: Martina Urbanova<br />
Order of Authors: Martina Urbanova; Jiri Brus; Ivana Sedenkova; Olivia Policianova; Libor Kobera<br />
Abstract: Current pharmaceutical research encounters with the problem of low solubility of many<br />
active ingredients (APIs). To overcome this limitation the poorly water-soluble drugs are <strong>for</strong>mulated as<br />
solid dispersions in matrices of hydrophilic polymers. In these new dosage <strong>for</strong>mulations, besides the<br />
notoriously discussed polymorphism and a bit mysterious pseudopolyamorphism, precise structural<br />
characterization of APIs is complicated by their interactions with macromolecules of excipients. In this<br />
communication a time-saving method <strong>for</strong> identification of various <strong>for</strong>ms of pharmaceutical substances<br />
in solid polymer dispersions is introduced. The method is demonstrated on a moderately-sized active<br />
pharmaceutical ingredient (Atorvastatin, C33H35FN2O5) exhibiting extensive polymorphism and<br />
pseudopolyamorphism. The API was incorporated in the matrix of polvinylpyrrolidone (PVP) <strong>for</strong>ming<br />
uni<strong>for</strong>mly dispersed nanosized domains. Size of domains, approximately tens of nanometers, was<br />
estimated by measuring T1(1<br />
characterization of the API in PVP is based on the processing of the 19F MAS NMR spectra of various<br />
polymeric <strong>for</strong>mulations by multivariate analysis (singular value decomposition algorithm). It was<br />
found out that molecular arrangement of APIs in the nanosized domains dispersed in polymer matrices<br />
is affected by the interactions with neighboring macromolecules and new non-crystalline <strong>for</strong>ms of the<br />
API are created. It is demonstrated, that 19F MAS NMR spectra reflect the changes in the extent of<br />
interactions with polymer matrix, and by using factor analysis the different non-crystalline<br />
modifications of the API in solid polymeric dispersions can be distinguished and identified. On the<br />
other hand, extreme attention must be paid to correctly assess the impact of electrostatic <strong>for</strong>ces or<br />
differences in magnetic susceptibility of the polymer matrix on the pattern of 19F MAS NMR spectra of<br />
the API. Dramatic changes in 19F MAS NMR spectra of well-defined <strong>for</strong>ms of the API induced by<br />
different filler compounds were observed. The factor analysis of the recorded spectra, however, can<br />
eliminate and separate these effects. Consequently the subtle structural differences in the molecular<br />
arrangement of the API in the nanosized domains dispersed in polymer matrices can be traced. The<br />
proposed strategy thus provides a powerful tool <strong>for</strong> the analysis of new <strong>for</strong>mulations of fluorinated<br />
pharmaceutical substances in polymer matrices.<br />
Suggested Reviewers: Gerhard Althoff<br />
Bruker BioSpin GmbH
gerhard.althoff@bruker-biospin.de<br />
Vladimir Machovic<br />
Institute of Chemical Technology<br />
Vladimir.Machovic@vscht.cz<br />
Tommi Virtanen<br />
Depar<strong>tm</strong>ent of Chemistry, University of Helsinki, Finland<br />
tommi.virtanen@helsinki.fi<br />
Young-Taek Sohn<br />
College of Pharmacy, Duksung Women’s University<br />
ytsohn@duksung.ac.kr
Cover Letter<br />
<strong>Spectrochimica</strong> <strong>Acta</strong> <strong>Part</strong> A: Molecular and Biomolecular Spectroscopy<br />
<strong>Editorial</strong> Office<br />
October 30, 2011<br />
Manuscript: “Characterization of Solid Polymer Dispersions of Active Pharmaceutical<br />
Ingredients by 19 F MAS NMR and Factor Analysis”<br />
Authors: Martina Urbanova, Jiri Brus, Ivana Sedenkova, Olivia Policianova, Libor Kobera<br />
Corresponding author: Martina Urbanova<br />
Address: Institute of Macromolecular Chemistry, Academy of Sciences of the Czech<br />
Republic, Heyrovsky sq. 2, 162 06 Prague 6, Czech Republic.<br />
E-mail: urbanova@imc.cas.cz<br />
Telephone: +420 296 809 380. Fax: +420 296 809 410.<br />
Dear Prof. Alexander A. Kamnev,<br />
please enclosed find our manuscript titled<br />
”Characterization of Solid Polymer Dispersions of Active Pharmaceutical Ingredients by<br />
19 F MAS NMR and Factor Analysis”<br />
by Martina Urbanova, Jiri Brus, Ivana Sedenkova, Olivia Policianova, Libor Kobera<br />
which we wish to submit to the journal <strong>Spectrochimica</strong> <strong>Acta</strong> <strong>Part</strong> A: Molecular and<br />
Biomolecular Spectroscopy. The manuscript is intended <strong>for</strong> the publication as a short<br />
communication <strong>for</strong> CSI XXXVII Special Issue.<br />
Current pharmaceutical research encounters with the problem of low solubility of many active<br />
ingredients (APIs). To overcome this limitation the poorly water-soluble drugs are <strong>for</strong>mulated<br />
as solid dispersions in matrices of hydrophilic polymers. In these new dosage <strong>for</strong>mulations,<br />
besides the notoriously discussed polymorphism and a bit mysterious pseudopolyamorphism,<br />
precise structural characterization of APIs is considerably complicated by the variable extent<br />
of interactions of the active substances with the macromolecules of excipients. In the<br />
manuscript we present a time-saving method <strong>for</strong> identification of various <strong>for</strong>ms of<br />
pharmaceutical substances in solid polymer dispersions. The proposed method is based on the<br />
analysis of 19 F MAS NMR spectra. Nowadays approximately 20-25% of drugs in the<br />
pharmaceutical pipeline contain at least one fluorine atom. Moreover, there is no danger of<br />
19 F NMR signals to be overlapped by the signals of common excipients. That is why we<br />
believe the proposed strategy could find wide application. Furthermore, we are convinced that<br />
this approach can be extended to the analysis of NMR spectra of other high-sensitive nuclei<br />
like 31 P, 23 Na, 11 B etc. While absent in filler compounds these nuclei are common components<br />
of many API.<br />
In short, our manuscript contains five central messages:<br />
a) Molecular arrangement of APIs in nanosized domains dispersed in polymer matrices is<br />
affected by the interactions with neighboring macromolecules. Polymer matrix can<br />
1
induce rearrangement of the molecules of the API in these nanosized domains, and<br />
new non-crystalline <strong>for</strong>ms of the API can be created.<br />
b) The resulting changes in the molecular structure of APIs in these domains are reflected<br />
by the specific spectral features detected in the corresponding 19 F MAS NMR spectra.<br />
c) As these spectral features are relatively weak and the 19 F MAS NMR spectra of the<br />
resulting non-crystalline <strong>for</strong>ms of the API are poorly resolved the analysis of<br />
molecular rearrangement of the API requires sophisticated processing based on factor<br />
analysis.<br />
d) It is demonstrated that the applied factor analysis possesses the same ability to<br />
distinguish various modifications of the API in solid polymeric dispersions as it has<br />
<strong>for</strong> pure APIs without filler compounds.<br />
e) Additionally, factor analysis has the ability to eliminate effects of electrostatic <strong>for</strong>ces<br />
or differences in magnetic susceptibility of the polymer matrix that can induce<br />
changes in the pattern of 19 F MAS NMR spectra.<br />
We believe that the concepts behind these experiments are relevant to all chemists who<br />
work with semicrystalline, amorphous-like and disordered organic solids, and use, or consider<br />
the use of solid-state NMR <strong>for</strong> their characterization. We also believe that our work will be of<br />
interest to a broad readership, as the principles introduced in our work provide the basis <strong>for</strong><br />
the design of a whole new class of NMR experiments <strong>for</strong> solid materials.<br />
Moreover, the work has, in part, already been presented at the CSI XXXVII 2011 conference<br />
in Brazil. On this occasion, it has attracted considerable interest among researchers, in<br />
particular with respect to future applications of solid-state 19 F MAS NMR experiments and<br />
comparative factor analysis. Since then, many colleagues of mine keep asking me <strong>for</strong> a paper<br />
about our novel concept.<br />
There<strong>for</strong>e, we kindly ask you to consider publication of our work as a communication in the<br />
journal <strong>Spectrochimica</strong> <strong>Acta</strong> <strong>Part</strong> A: Molecular and Biomolecular Spectroscopy,<br />
manuscript is intended <strong>for</strong> the CSI XXXVII Special Issue.<br />
Yours sincerely,<br />
Martina Urbanova<br />
For our manuscript, the following researchers could potentially act as reviewers:<br />
Dr. Gerhard Althoff; Bruker BioSpin GmbH, Germany, Silberstreifen, D-76287 Rheinstetten,<br />
Germany, e-mail: gerhard.althoff@bruker-biospin.de<br />
Dr. Vladimir Machovic; Institute of Chemical Technology Prague, Technická 5, 166 28<br />
Prague 6, Czech Republic email: Vladimir.Machovic@vscht.cz<br />
2
Graphical Abstract<br />
1<br />
1
*Highlights<br />
<br />
<br />
<br />
<br />
<br />
New non-crystalline <strong>for</strong>ms of APIs are created in solid dispersions.<br />
Structural changes of APIs are detected in 19 F MAS NMR spectra.<br />
19 F MAS NMR spectra reflect the extent of interactions with polymer matrix<br />
Factor analysis can distinguish different <strong>for</strong>ms of the API.<br />
Factor analysis eliminates susceptibility effects.
*Manuscript<br />
Click here to view linked References<br />
1<br />
Characterization of Solid Polymer Dispersions of Active<br />
2<br />
3<br />
Pharmaceutical Ingredients by 19 F MAS NMR and<br />
Factor Analysis<br />
4<br />
Martina Urbanova †* , Jiri Brus † , Ivana Sedenkova † , Olivia Policianova † , Libor Kobera †<br />
5<br />
6<br />
†<br />
Depar<strong>tm</strong>ent of NMR Spectroscopy, Institute of Macromolecular Chemistry, Heyrovsky sq. 2, 162 06<br />
Prague 6, Czech Republic<br />
7<br />
8<br />
urbanova@imc.cas.cz, brus@imc.cas.cz, sedenko@imc.cas.cz, policianova@imc.cas.cz,<br />
kobera@imc.cas.cz<br />
9<br />
10<br />
TITLE RUNNING HEAD: Characterization of Solid Polymer Dispersions of APIs<br />
11<br />
CORRESPONDING AUTHOR FOOTNOTE:<br />
12<br />
13<br />
* To whom correspondence should be addressed. E-mail: urbanova@imc.cas.cz Telephone: +420 296<br />
809 380. Fax: +420 296 809 410.<br />
14<br />
15<br />
16<br />
17<br />
18<br />
19<br />
20<br />
ABSTRACT: Current pharmaceutical research encounters with the problem of low solubility of many<br />
active ingredients (APIs). To overcome this limitation the poorly water-soluble drugs are <strong>for</strong>mulated as<br />
solid dispersions in matrices of hydrophilic polymers. In these new dosage <strong>for</strong>mulations, besides the<br />
notoriously discussed polymorphism and a bit mysterious pseudopolyamorphism, precise structural<br />
characterization of APIs is complicated by their interactions with macromolecules of excipients. In this<br />
communication a time-saving method <strong>for</strong> identification of various <strong>for</strong>ms of pharmaceutical substances<br />
in solid polymer dispersions is introduced. The method is demonstrated on a moderately-sized active<br />
1
21<br />
22<br />
23<br />
24<br />
25<br />
26<br />
27<br />
28<br />
29<br />
30<br />
31<br />
32<br />
33<br />
34<br />
35<br />
36<br />
37<br />
38<br />
39<br />
pharmaceutical ingredient (Atorvastatin, C 33 H 35 FN 2 O 5 ) exhibiting extensive polymorphism and<br />
pseudopolyamorphism. The API was incorporated in the matrix of polvinylpyrrolidone (PVP) <strong>for</strong>ming<br />
uni<strong>for</strong>mly dispersed nanosized domains. Size of domains, approximately tens of nanometers, was<br />
estimated by measuring T 1 ( 1 H) and T 1 ( 1 H) relaxation times. The proposed strategy of structural<br />
characterization of the API in PVP is based on the processing of the 19 F MAS NMR spectra of various<br />
polymeric <strong>for</strong>mulations by multivariate analysis (singular value decomposition algorithm). It was found<br />
out that molecular arrangement of APIs in the nanosized domains dispersed in polymer matrices is<br />
affected by the interactions with neighboring macromolecules and new non-crystalline <strong>for</strong>ms of the API<br />
are created. It is demonstrated, that 19 F MAS NMR spectra reflect the changes in the extent of<br />
interactions with polymer matrix, and by using factor analysis the different non-crystalline modifications<br />
of the API in solid polymeric dispersions can be distinguished and identified. On the other hand,<br />
extreme attention must be paid to correctly assess the impact of electrostatic <strong>for</strong>ces or differences in<br />
magnetic susceptibility of the polymer matrix on the pattern of 19 F MAS NMR spectra of the API.<br />
Dramatic changes in 19 F MAS NMR spectra of well-defined <strong>for</strong>ms of the API induced by different filler<br />
compounds were observed. The factor analysis of the recorded spectra, however, can eliminate and<br />
separate these effects. Consequently the subtle structural differences in the molecular arrangement of the<br />
API in the nanosized domains dispersed in polymer matrices can be traced. The proposed strategy thus<br />
provides a powerful tool <strong>for</strong> the analysis of new <strong>for</strong>mulations of fluorinated pharmaceutical substances<br />
in polymer matrices.<br />
40<br />
41<br />
KEYWORDS: solid-state NMR, factor analysis, 19 F MAS NMR, API, solid dispersions, magnetic<br />
susceptibility.<br />
42<br />
43<br />
44<br />
45<br />
1. Introduction<br />
No matter what reasons are, either searching <strong>for</strong> structure-property relationships in material science or<br />
production of drugs of consistent quality in pharmaceutical industry, the possibility of solid state<br />
2
46<br />
47<br />
48<br />
49<br />
50<br />
51<br />
52<br />
53<br />
54<br />
55<br />
56<br />
57<br />
58<br />
59<br />
60<br />
61<br />
62<br />
63<br />
64<br />
65<br />
66<br />
67<br />
68<br />
69<br />
70<br />
71<br />
existing in different modifications with unique properties still requires development of new methods <strong>for</strong><br />
their characterization.[1]<br />
In pharmaceutical science, amorphous and semicrystalline <strong>for</strong>ms of active pharmaceutical ingredients<br />
(APIs) attract significant attention due to their enhanced dissolution rates compared with commonly<br />
used crystalline modifications. Un<strong>for</strong>tunately, these disordered solids exhibit low thermodynamic<br />
stability. This fact can result in polymorphic changes that can affect physicochemical properties[2] of<br />
the produced APIs or can lead to complicated patent litigations. Generally thus the enhancement of oral<br />
bioavailability of poorly water-soluble drugs remains one of the most challenging aspects of drug<br />
development.[3,4] The problem is further multiplied by the fact that, depending on the preparation<br />
technique, different amorphous (non-crystalline) <strong>for</strong>ms of pharmaceutical solids can exist.[5-8]<br />
Moreover, in many cases the differently prepared amorphous <strong>for</strong>ms of the API exhibit significantly<br />
different physicochemical properties. A typical example of such behavior is amorphous simvastatin that<br />
as prepared by cryo-milling rapidly crystallizes, whereas the quench-cooled samples show no sign of<br />
phase trans<strong>for</strong>mation.[7] Similarly the amorphous indomethacin prepared by melt quenching shows a<br />
significant dissolution rate enhancement over the crystalline -<strong>for</strong>m, while cryoground amorphous<br />
indomethacin undergoes rapid back crystallization to stable -<strong>for</strong>m.[8] Significant differences in<br />
physico-chemical behavior were observed also <strong>for</strong> atorvastatin that is still under extensive<br />
consideration.[9] Quite recently it has been reported that the intrinsic dissolution rates of different<br />
amorphous <strong>for</strong>ms of this API considerably differ <strong>for</strong>m 0.183 to 0.252 mg.min -1 .cm -2 .[10] There<strong>for</strong>e the<br />
experimental approaches of exact structural characterization of these amorphous pharmaceutical solids<br />
are still a subject of enormous scientific ef<strong>for</strong>t.<br />
Recent development of solid dispersions of APIs as a practically viable method to enhance<br />
bioavailability of the poorly water-soluble drugs overcame many limitations associated with salt<br />
<strong>for</strong>mation, solubilization by cosolvents, micronization and/or mechanical amorphization. The term<br />
“solid dispersion” refers to a group of solid products consisting of at least two different components,<br />
generally a hydrophilic matrix and a hydrophobic drug. The matrix can be either crystalline or<br />
3
72<br />
73<br />
74<br />
75<br />
76<br />
77<br />
78<br />
79<br />
80<br />
81<br />
82<br />
83<br />
84<br />
85<br />
86<br />
87<br />
88<br />
89<br />
90<br />
91<br />
92<br />
93<br />
94<br />
95<br />
96<br />
97<br />
amorphous, and among other compounds various synthetic polymers such as polyvinylpyrrolidone<br />
(PVP) or polyethyleneglycol (PEG) are frequently used. The drug can be dispersed in the polymer<br />
matrix on molecular level, can <strong>for</strong>m nanosized amorphous or crystalline particles or clusters, and/or can<br />
<strong>for</strong>m relatively large domains. These domains can be again either crystalline or amorphous. In some<br />
cases if there are specific interactions between the molecules of APIs and polymer matrix the highly<br />
ordered composites or complexes exhibiting long-range periodic arrangements can be <strong>for</strong>med.[11]<br />
Consequently, despite the recent advances in structural analysis, the characterization of these<br />
multicomponent systems and precise recognition of structural state of the API continues to be a<br />
monumental challenge.<br />
X-ray powder diffraction (XRPD), 13 C cross/polarization (CP) magic-angle spinning (MAS) NMR<br />
and vibration spectroscopy are traditional tools to recognize different solid <strong>for</strong>ms of APIs.[12-15] In<br />
addition, the combinations of Raman or infrared spectroscopy with multivariate analysis have been<br />
successfully used to probe subtle variations of semicrystalline solids.[5] However, in solid dispersions<br />
where concentrations of API are very low, and the strong signals of polymer compounds (excipients)<br />
dominate we are balancing on physical limits of these experimental approaches. There<strong>for</strong>e<br />
characterization of the structural state of APIs and their unambiguous identification in solid polymer<br />
dispersions is a priority that still has remained a challenge.<br />
In this context 19 F MAS NMR spectroscopy is a promising technique the special strategy of its<br />
application is followed herein. Due to a high gyromagnetic ratio and 100% isotopic abundance the<br />
isotope 19 F gives solid-state NMR spectra within extremely short time even <strong>for</strong> diluted systems. Fluorine<br />
atom is also relatively frequent component of many pharmaceutically active molecules, and there is no<br />
danger of 19 F NMR signals to be overlapped by the signals of component of polymer matrices.<br />
Moreover, previously it has been demonstrated by us that 19 F MAS NMR spectroscopy combined with<br />
factor analysis offers the possibility to unambiguously identify various crystalline and disordered<br />
(non/crystalline and amorphous) <strong>for</strong>ms of fluorine-containing APIs in pure <strong>for</strong>mulations.[16] Extensive<br />
testing also confirmed that 19 F MAS NMR spectra reflect changes in amorphous phase of fluorinated<br />
4
98<br />
99<br />
100<br />
101<br />
102<br />
103<br />
104<br />
105<br />
106<br />
107<br />
108<br />
109<br />
110<br />
111<br />
112<br />
compounds in similar extent as provided by the more in<strong>for</strong>mative techniques like 13 C CP/MAS NMR,<br />
FTIR and XRPD.<br />
On the other hand, the characterization of APIs in solid polymer dispersions brings new problems that<br />
have to be thoroughly discussed. At first, in these new dosage <strong>for</strong>mulations, besides the well-known<br />
polymorphism and a bit mysterious “pseudopolyamorphism”, the precise structural characterization of<br />
APIs is complicated by their interactions with the macromolecules of excipients. Second, considerable<br />
attention must be paid to assess the impact of electrostatic <strong>for</strong>ces or differences in magnetic<br />
susceptibility of polymer matrices on 19 F MAS NMR spectra. Bear in mind that 19 F is highly receptive<br />
nucleus. Generally, in tablet <strong>for</strong>mulations the unpredictable electrostatic potentials (charging of the<br />
particles of APIs) or changes in magnetic susceptibility produced by filler compounds can be so strong<br />
that dramatic changes in the pattern of 19 F MAS NMR spectra can be induced. In this communication<br />
we discuss all the above mentioned issues with respect to reliability of characterization of APIs in solid<br />
polymeric dispersions using 19 F MAS NMR spectroscopy. In our best knowledge this is the first attempt<br />
to apply 19 F MAS NMR spectroscopy combined with multivariate analysis to characterize active<br />
pharmaceutical ingredients <strong>for</strong>mulated as solid polymer dispersions.<br />
113<br />
114<br />
115<br />
116<br />
117<br />
118<br />
119<br />
120<br />
121<br />
122<br />
2. Experimental<br />
2.1. Materials. As a model active compound atorvastatin hemicalcium [(C 33 H 35 FN 2 O - 5 ) 2 Ca 2+<br />
amorphous] produced by Biocon Laboratories, Bangalore, India; was used as received. As a model<br />
polymeric excipient polyvinylpyrrolidone K 90; M w =360000 produced by Sigma Aldrich was used.<br />
2.2. Methods: Sample Preparation. Different <strong>for</strong>ms of pure API was prepared according to patent<br />
literature by recrystallization under various conditions from different solvents (acetone, acetonitrile,<br />
water, ethanol, methanol, dimethyl<strong>for</strong>amide, n-heptane).[16] Recrystallization was per<strong>for</strong>med from<br />
solutions with completely dissolved atorvastatin or from saturated solutions with applied mechanical<br />
grinding.<br />
5
123<br />
124<br />
125<br />
126<br />
127<br />
128<br />
129<br />
130<br />
131<br />
132<br />
133<br />
134<br />
135<br />
136<br />
137<br />
138<br />
139<br />
140<br />
141<br />
142<br />
143<br />
144<br />
145<br />
146<br />
147<br />
Solid dispersions were prepared by free evaporation or lyophilization of the prepared solution of<br />
atorvastatin with PVP. These systems were prepared by mixing of solution of atorvastatin and solution<br />
of PVP. Solvents of API and polymer were nontoxic and biodegradable such as water, ethanol and t-<br />
butanol. In all cases the traces of organic solvents were removed from the resulting products by vacuum<br />
evaporation. The absence of solvent was checked by 13 C and 1 H MAS NMR spectroscopy. Total<br />
composition of the prepared solid dispersions was always as following: 85 wt% PVP and 15 wt% API.<br />
2.3. Methods: Solid-state NMR. 19 F MAS NMR spectra were measured using a Bruker Avance 500<br />
WB/US NMR spectrometer in 2.5-mm double-resonance probehead. A rotor synchronized Hahn-echo<br />
pulse sequence was used to measure 19 F MAS NMR spectra at MAS frequency of 31 kHz. The length of<br />
90° ( 19 F) pulse was 2.5 s. The 19 F NMR scale was calibrated with PTFE (-122 ppm).<br />
The 13 C-detected T 1 ( 1 H) a T 1 ( 1 H) relaxation experiments were used to determine homogeneity and<br />
the extent of dispersion of the API in polymer matrix. The range of size of domains that could be probed<br />
by these relaxation experiments is ca. 1-100 nm. The experimental scheme with a variable spin-lock<br />
time in the range 0.1–10 ms after the proton signal excitation followed by constant contact time was<br />
used in T 1ρ ( 1 H) measurements; the proton spin-locking field in frequency units was 80 kHz. T 1 ( 1 H)<br />
values were measured using the combination of cross-polarization and saturation recovery pulse<br />
sequence. Details of the applied experiments can be found in the recently published papers. [17,18]<br />
2.4. Methods: Optical microscopy. The research-grade Leica DM LM microscope with an objective<br />
magnification 50 was used to probe homogeneity of the sample in the range of size of domains > 1 m.<br />
2.5. Methods: Factor analysis (FA). Factor analysis using the singular value decomposition (SVD)<br />
algorithm was per<strong>for</strong>med to extract in<strong>for</strong>mation from the experimental data obtained by 19 FMAS NMR<br />
and to visualize differences between different predominantly amorphous <strong>for</strong>ms of atorvastatin.<br />
Processing of spectral data was per<strong>for</strong>med in Matlab program package. The following spectral range was<br />
subjected to the factor analysis: 19 F NMR: from -80 to -140 ppm. All spectra were base-line corrected<br />
and normalized. Preparation and processing of a moderately sized data set containing ca. 40 spectra took<br />
148<br />
about 10 min.<br />
6
149<br />
150<br />
151<br />
152<br />
3. Result and discussion<br />
153<br />
154<br />
155<br />
156<br />
157<br />
158<br />
159<br />
160<br />
161<br />
162<br />
163<br />
164<br />
165<br />
166<br />
167<br />
168<br />
169<br />
170<br />
171<br />
172<br />
173<br />
3.1. Homogeneity of the systems<br />
Be<strong>for</strong>e the analysis of molecular structure of the API we characterized homogeneity of the prepared<br />
solid polymer dispersions, i.e. size of domains of the API in polymer matrix was estimated. At first we<br />
used optical microscopy, and the obtained quite featureless micrographs (not shown here) indicated that<br />
the prepared solid dispersion were homogeneous in the micrometer scale. To probe homogeneity of the<br />
prepared systems in the nanometer scale we measured 13 C-detected T 1 ( 1 H) and T 1 ( 1 H) spin-lattice<br />
relaxation times. Previously, on a wide range of two-component and multi-component polymer systems,<br />
it has been demonstrated that differences in 1 H relaxation times between individual components usually<br />
indicate heterogeneous character of the systems. This rule follows from the fact that 1 H- 1 H spin<br />
diffusion, that is generally very fast in organic solids, is not able to equilibrate magnetic properties of all<br />
1 H atoms. Typically 1 H magnetization is transferred over a distance of about 1.1-1.2 nm during 1 ms<br />
[19]. In the case of measurements of T 1 ( 1 H) spin-lattice relaxation times the relevant times of 1 H spin<br />
diffusion are in the range of several seconds. Consequently 1 H magnetization can be effectively<br />
transferred over ca. 100-200 nm. There<strong>for</strong>e if the T 1 ( 1 H) spin-lattice relaxation times of both<br />
components are different the two-component system is heterogeneous with the size of domains larger<br />
than ca. 100-200 nm. A similar approach applies also to the measurements of T 1 ( 1 H) spin-lattice<br />
relaxation times. In this case, however, the 1 H- 1 H spin diffusion times are in the range of milliseconds.<br />
There<strong>for</strong>e the 1 H magnetization can be effectively transferred over several tens of nanometers. A multicomponent<br />
system with the uni<strong>for</strong>m T 1 ( 1 H) relaxation time thus can be considered to be homogenous<br />
with the size of domains less then several nanometers. Details of the applied procedure can be found in<br />
174<br />
recently published papers [17,18].<br />
7
175<br />
176<br />
177<br />
178<br />
179<br />
180<br />
181<br />
182<br />
183<br />
184<br />
185<br />
186<br />
187<br />
188<br />
189<br />
190<br />
191<br />
Table 1. T 1 ( 1 H) and T 1 ( 1 H) spin-lattice relaxation times obtained <strong>for</strong> pure API, PVP and selected solid<br />
dispersions representing typical preparation procedures.<br />
<strong>System</strong> solvent procedure T 1 ( 1 H), s T 1 ( 1 H), ms T 1 ( 1 H), s T 1 ( 1 H), ms<br />
API API PVP PVP<br />
Pure API --- --- 1.36 5.8 NA NA<br />
Pure PVP --- --- NA NA 2.5 28.2<br />
API-PVP (1) water free evaporation 1.38 13.5 1.40 22.4<br />
API-PVP (2) ethanol free evaporation 1.42 15.7 1.37 23.2<br />
API-PVP (3) tert-butanol free evaporation 1.48 14.3 1.31 25.1<br />
API-PVP (5) water lyophilization 1.28 17.5 1.46 20.1<br />
API-PVP (6) ethanol lyophilization 1.32 18.9 1.35 22.4<br />
API-PVP (7) tert-butanol lyophilization 1.25 15.3 1.21 23.6<br />
Table 1 summarizes T 1 ( 1 H) and T 1 ( 1 H) spin-lattice relaxation times obtained <strong>for</strong> pure API, PVP and<br />
selected solid dispersions representing typical preparation procedures. From the obtained data it is clear<br />
that T 1 ( 1 H) spin-lattice relaxation times are equilibrated indicating that all the prepared systems are<br />
homogenous in the scale of hundreds nanometers. On the other hand, the differences in T 1 ( 1 H)<br />
relaxation times reflect the existence of domains of the AIP the size of which is ranging between ca. 1-<br />
10 nm. Precise measurement of domain size is under the current investigation. As both components are<br />
not intimately mixed on molecular level the molecules of the API in the domains can preserve original<br />
molecular arrangements typical <strong>for</strong> the pure state (amorphous or crystalline). On the other hand new<br />
molecular packing in these domains induced by the interaction with PVP macromolecules can be also<br />
expected.<br />
192<br />
8
193<br />
194<br />
195<br />
196<br />
197<br />
198<br />
199<br />
200<br />
201<br />
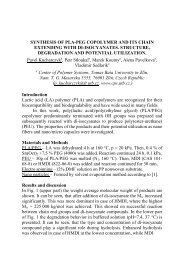
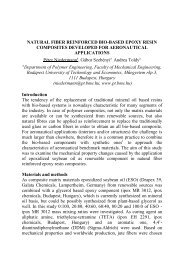
3.2. 19 F MAS NMR spectroscopy<br />
Subsequently 19 F MAS NMR spectra were measured <strong>for</strong> a range of the prepared solid polymer<br />
dispersions and various modifications of pure API including many amorphous <strong>for</strong>ms and three crystal<br />
modifications (I, V, and X; identified previously according to XRPD and patent literature [16]). In the<br />
recorded 19 F MAS NMR spectra the highly-ordered crystalline <strong>for</strong>ms exhibit clear differences from each<br />
other as well as from the amorphous ones (Fig. 1). Quite distinct is the broadening of 19 F MAS NMR<br />
signals of pure amorphous modifications of the API and the shift toward the high frequency region. The<br />
obtained experimental data also reflect slight structural variations of the amorphous products. This is<br />
indicated by the presence of high-frequency shoulders (left-handed humps).<br />
Solid<br />
dispersions<br />
Pure API<br />
Form I<br />
Pure API<br />
amorphous<br />
Pure API<br />
Form X<br />
202<br />
203<br />
204<br />
205<br />
206<br />
-80 -90 -100 -110 -120 -130 -140<br />
chemical shift, ppm<br />
Figure 1. Overlay of 19 F MAS NMR spectra of selected <strong>for</strong>mulations of atorvastatin (C 33 H 35 FN 2 O 5 ).<br />
The black lines represent spectra of semicrystalline and amorphous <strong>for</strong>ms the API in pure state; the red<br />
lines represent spectra of solid dispersions of the API; the green lines correspond with the spectra of<br />
pure crystalline Form I; and the blue lines spectra of pure crystalline Form X of the API.<br />
207<br />
208<br />
209<br />
In contrast, the 19 F MAS NMR signals of solid polymer dispersions are systematically shifted back<br />
toward the low-frequency region and broadened on both left- and right-handed sides. As demonstrated<br />
9
210<br />
211<br />
212<br />
213<br />
214<br />
215<br />
216<br />
217<br />
in our previous research the <strong>for</strong>mation of high-frequency shoulders can be attributed to the presence of<br />
certain motifs with medium-range molecular order and/or nano-sized nearly crystalline molecular<br />
fragments/domains [16]. The low-frequency shoulders that are observed only in the spectra of the solid<br />
dispersions can indicate <strong>for</strong>mation of new structural fragments the arrangement of which is induced by<br />
the polymer matrix. An alternative explanation can operate with the presence of traces of the most<br />
frequent crystalline <strong>for</strong>ms I and/or X because the resonance frequency of shoulders is very close to their<br />
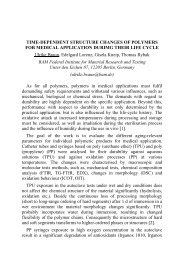
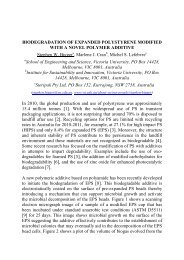
typical 19 F MAS NMR resonance frequencies. However, the presence of these crystalline fractions was<br />
not confirmed by 13 C CP/MAS NMR spectra (Figure 2). No clear match was found.<br />
13 C CP/MAS NMR<br />
19 F MAS NMR<br />
Form JD<br />
(solid dispersion)<br />
Form I<br />
Form X<br />
Form A<br />
(pure API)<br />
218<br />
150 145 140 135 130 125 120 115 110 105 100<br />
chemical shift, ppm<br />
-95 -100 -105 -110 -115 -120 -125 -130<br />
chemical shift, ppm<br />
219<br />
220<br />
Figure 2. 13 C CP/MAS and 19 F MAS NMR spectra of typical solid polymer dispersion of the API<br />
exhibiting considerable low-frequency shoulder, pure Form I, pure Form X, and amorphous Form A.<br />
221<br />
222<br />
223<br />
224<br />
225<br />
226<br />
227<br />
228<br />
On the other hand, the observed systematic low-frequency shift of 19 F MAS NMR signals of solid<br />
dispersions is a bit surprising and its thorough interpretation requires extensive experimentation that is<br />
beyond the scope of this contribution. According to our preliminary test this phenomenon can be<br />
explained either by the charging of API particles or by the change in the isotropic bulk magnetic<br />
susceptibility of the sample. Polymer segments closely associated with the API induce a different local<br />
field and contribute to an off-resonance term of the free induction decay. Consequently the NMR signals<br />
can be shifted from the expected regions. <strong>Part</strong>icularly, as 19 F is a highly receptive nucleus, significant<br />
229<br />
changes in the patterns of 19 F MAS NMR spectra can be expected.<br />
10
API in<br />
tablets<br />
Pure<br />
API<br />
API in<br />
tablets<br />
1 2 3 4 5<br />
Form X<br />
230<br />
231<br />
232<br />
233<br />
-105 -110 -115 -120 -125<br />
chemical shift, ppm<br />
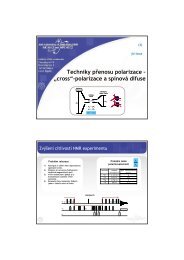
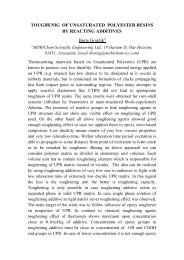
Figure 3. 19 F MAS NMR spectra of crystalline Form X of atorvastatin (C 33 H 35 FN 2 O 5 ) with different<br />
excipients: 90 wt. % of dry corn starch 1); 90 wt. % of cellulose 2); 90 wt. % of wet corn starch 3); pure<br />
Form X 4); 90 wt. % of sucrose 5).<br />
234<br />
235<br />
236<br />
237<br />
238<br />
239<br />
240<br />
241<br />
242<br />
243<br />
244<br />
245<br />
246<br />
In order to probe the observed phenomenon in detail we prepared a set of physical mixtures of the<br />
Form X of atorvastatin and various excipients. We used wet corn starch, dry corn starch, cellulose, and<br />
sucrose. Total composition of the prepared physical mixtures was 90 wt% of excipient and 10 wt% of<br />
the API. Figure 3 then demonstrates significant changes in the position and splitting of asymmetric<br />
doublets that are the typical feature of the Form X of atorvastatin. As no significant changes in 13 C<br />
CP/MAS NMR spectra and XRPD patterns were detected no phase transitions occurred during the<br />
mixing of the API and excipients. Crystal Form X is still present in the prepared samples. This indicates<br />
that the observed changes in 19 F MAS NMR spectra (Figure 3) reflect some kind of physical interaction<br />
between the particles of API and filler compounds. The observed changes in 19F MAS NMR spectra are<br />
rather complex, and their extent depends on the type of excipients. While the macromolecular excipients<br />
such as dry corn starch or carboxymethylcellulose induce high-frequency shift and the decrease in<br />
splitting of the doublet, relatively low-molecular weight sucrose causes the low-frequency shift and the<br />
11
247<br />
248<br />
249<br />
250<br />
251<br />
252<br />
253<br />
254<br />
255<br />
256<br />
257<br />
increase in the doublet splitting (Figure 3). In this case, considering that the dry corn starch has much<br />
stronger effect than wet corn starch, we suggest the effect of electrostatic <strong>for</strong>ces or charging of API<br />
particles. The dielectric properties of the sample can be significantly changed so the resonance<br />
frequency can be slightly shifted. In the case of polymer dispersions prepared from neutral solutions the<br />
charging of API particles, however, cannot be expected. Rather we suppose that the observed systematic<br />
shift of 19 F MAS NMR signals of solid dispersions can be attributed to the susceptibility effect. This<br />
finding indicates that the observed susceptibility effects can additionally complicate reliable analysis of<br />
19 F MAS NMR spectra. Bear in mind that differences between the amorphous modifications of the API<br />
are very subtle even in pure state and visual comparison of these spectra is not enough. As more than 50<br />
almost-amorphous modifications of atorvastatin have been described the correct interpretation of the<br />
observed spectral variation requires a special statistical processing such as factor analysis.<br />
258<br />
259<br />
260<br />
261<br />
262<br />
3.3. Factor analysis<br />
In general, factor analysis (FA) provides a versatile tool to explore complex changes in large sets of<br />
experimental data. Specifically, the experimental spectra Y i are converted into the set of orthonormal<br />
subspectra S j (Eq. 1) using Singular Value Decomposition (SVD) algorithm.<br />
263<br />
Y<br />
i<br />
<br />
n<br />
<br />
j1<br />
w V<br />
j<br />
ij<br />
S<br />
j<br />
(1)<br />
264<br />
265<br />
266<br />
267<br />
268<br />
269<br />
270<br />
271<br />
The calculated subspectra S j are linear combinations of the experimental data and vice versa the<br />
experimental data can be given as the linear combination of the subspectra. Each subspectrum S j<br />
represents a specific spectral feature that is typical <strong>for</strong> a given type of analyzed samples. The statistical<br />
importance and hence the order of each subspectrum S j is expressed by the corresponding singular value,<br />
w j . The ability of a particular subspectrum S j to describe the experimental spectrum Y i is then expressed<br />
by the normalized coefficient V ij . Consequently the coefficients V ij (i.e. scores) represent quantitative<br />
parameters reflecting spectral differences between the analyzed samples. In this way any modification of<br />
a particular API can be unambiguously identified via the set of V ij coefficients.<br />
12
Singular values<br />
75<br />
S 1<br />
Singular values<br />
19<br />
F MAS NMR<br />
70<br />
20<br />
S 2<br />
15<br />
10<br />
5<br />
S 3 S4<br />
S5<br />
S6<br />
0<br />
272<br />
0 2 4 6 8 10 12 14 16 18 20 22 24 26 28 30 32<br />
No. of subspectra<br />
273<br />
274<br />
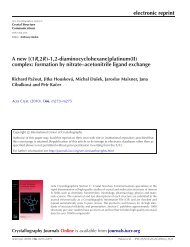
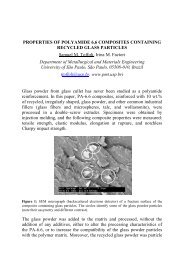
Figure 4. Singular values w j calculated from the set of 19 F MAS NMR spectra. The highest singular<br />
values (red triangles) indicate the most significant subspectra (S 1 -S 6 ).<br />
275<br />
276<br />
277<br />
278<br />
279<br />
280<br />
281<br />
282<br />
283<br />
284<br />
285<br />
286<br />
287<br />
In our particular case singular parameters w 1 to w 6 reach reasonable values (red triangles in Figure 4).<br />
This indicates that the corresponding subspectra S 1 to S 6 (Figure 5) entirely describe the analyzed set of<br />
samples. The first-rank subspectrum S 1 corresponds to the superposition of signals dominating the set of<br />
19 F MAS NMR spectra and resembles the typical signal of amorphous <strong>for</strong>ms of atorvastatin. The<br />
second-order subspectrum S 2 then demonstrates the most significant spectral deviations found in the<br />
analyzed data set. In our case this is the difference in resonance frequency of 19 F MAS NMR signals in<br />
pure <strong>for</strong>ms of atorvastatin and its solid dispersions. Characteristic markers of crystalline <strong>for</strong>ms I and X<br />
are displayed in the third- and fourth-rank subspectra S 3 and S 4 . The fourth-rank subspectrum also partly<br />
reflects certain changes in 19 F MAS NMR chemical shifts between the pure APIs and APIs in polymer<br />
solid dispersions. The spectral differences between amorphous modifications are particularly highlighted<br />
in the fifth-rank and sixth-rank subspectra S 5 and S 6 . In total, the above-mentioned subspectra S 1 -S 6<br />
explain about 95 % of the spectral variation observed in the set of the recorded 19 F MAS NMR spectra.<br />
13
0.08<br />
0.06<br />
S1<br />
0.10<br />
0.08<br />
0.06<br />
S2<br />
0.04<br />
0.04<br />
0.02<br />
0.00<br />
0.02<br />
-0.02<br />
-0.04<br />
0.00<br />
-80 -90 -100 -110 -120 -130 -140<br />
chemical shift, ppm<br />
0.20<br />
S3<br />
0.15<br />
-0.06<br />
-80 -90 -100 -110 -120 -130 -140<br />
chemical shift, ppm<br />
0.08<br />
0.06<br />
0.04<br />
0.02<br />
S4<br />
0.10<br />
0.00<br />
-0.02<br />
0.05<br />
-0.04<br />
-0.06<br />
0.00<br />
-0.08<br />
288<br />
-0.05<br />
-80 -90 -100 -110 -120 -130 -140<br />
chemical shift, ppm<br />
0.12<br />
0.10<br />
0.08<br />
0.06<br />
0.04<br />
0.02<br />
0.00<br />
-0.02<br />
-0.04<br />
-0.06<br />
S5<br />
-80 -90 -100 -110 -120 -130 -140<br />
chemical shift, ppm<br />
-0.10<br />
0.08<br />
0.06<br />
0.04<br />
0.02<br />
0.00<br />
-0.02<br />
-0.04<br />
-0.06<br />
-0.08<br />
-80 -90 -100 -110 -120 -130 -140<br />
chemical shift, ppm<br />
S6<br />
-0.10<br />
-80 -90 -100 -110 -120 -130 -140<br />
chemical shift, ppm<br />
289<br />
290<br />
Figure 5. Subspectra S 1 – S 6 calculated from the set of 19 F MAS NMR spectra of various modifications<br />
of the API and API in solid dispersions.<br />
291<br />
292<br />
293<br />
294<br />
295<br />
296<br />
297<br />
298<br />
299<br />
300<br />
301<br />
302<br />
303<br />
To explicitly quantify this spectral variation the normalized coefficients V ij can be used. In addition, as<br />
these factors are attributed to each sample, these coefficients unambiguously identify any modification<br />
of the API. As follows from the above-mentioned interpretations of S j subspectra, primary identification<br />
of individual samples can be derived <strong>for</strong>m the correlation plot of V i1 and V i2 coefficients in which four<br />
well-separated clusters are clearly apparent: 1) crystalline Form I; 2) crystalline Form X; 3)<br />
noncrystalline <strong>for</strong>ms of the API in pure state; and 4) solid dispersions of noncrystalline <strong>for</strong>ms of the API<br />
(Figure 6). This finding also indicates that the effects of variable susceptibility of the analyzed samples<br />
are entirely described by the coefficient V i2 . In other words this means that with high probability there<br />
are other coefficients clearly describing structural differences between different noncrystalline <strong>for</strong>ms of<br />
the API regardless it is in pure state or in solid dispersion. For instance, structural differences between<br />
the crystalline <strong>for</strong>ms of atorvastatin can be explicitly expressed by the factors V i3 , while the subtle<br />
differences between the non-crystalline (amorphous) <strong>for</strong>ms in pure state as well as in solid dispersions<br />
14
304<br />
305<br />
306<br />
307<br />
308<br />
309<br />
310<br />
311<br />
312<br />
313<br />
are preferably described by V i5 . In a graphical representation (one of the most suitable representation<br />
seems to be 2D correlation plot of V i1 and V i5 coefficients, Fig. 6; or 3D correlation plot of V i1 , V i3 and<br />
V i5 coefficients, Figure 7) the crystalline Forms I and X are clearly separated in horizontal dimension,<br />
while the amorphous <strong>for</strong>ms are vertically sorted. The observed systematic array of V i5 coefficients<br />
clearly reflects differences between the amorphous non-crystalline <strong>for</strong>ms of atorvastatin. As the array of<br />
V i5 coefficients is a continuous function without any abrupt change (jump), the structurally insignificant<br />
susceptibility effects are removed out. Coefficients V i5 as well as V i6 (the corresponding correlation plots<br />
are not shown here) thus seem to be independent on global changes in susceptibility of the analyzed<br />
systems. Moreover, the considerably wide range of V i5 values covering the interval <strong>for</strong>m -0.3 to 0.3<br />
confirms the high structural receptivity of this parameter.<br />
19<br />
F V2<br />
0.3<br />
0.2<br />
0.1<br />
0.0<br />
-0.1<br />
-0.2<br />
JD<br />
KD<br />
AD<br />
FD<br />
CD BD<br />
DD<br />
ED<br />
HD GD ID<br />
C<br />
E G F<br />
H L<br />
D<br />
A<br />
KM<br />
I<br />
B<br />
N<br />
J<br />
O P<br />
solid polymeric<br />
dispersion<br />
disordered <strong>for</strong>ms of<br />
pure API<br />
Form I<br />
-0.20 -0.15 -0.10 -0.05 0.00<br />
FI`<br />
FI<br />
Form X<br />
FX'<br />
19<br />
F V5<br />
0.4<br />
0.3<br />
0.2<br />
0.1<br />
0.0<br />
-0.1<br />
-0.2<br />
-0.3<br />
-0.4<br />
JD KD<br />
C<br />
E<br />
F<br />
GD<br />
L M<br />
AK<br />
BI<br />
H<br />
GD ED<br />
CD BD<br />
FDAD<br />
DD<br />
HD<br />
ID N<br />
O<br />
P<br />
J<br />
Form I<br />
-0.20 -0.15 -0.10 -0.05 0.00<br />
FI<br />
FI'<br />
Form X<br />
FX'<br />
314<br />
19 F V 1<br />
19 F V 1<br />
315<br />
316<br />
317<br />
Figure 6. Correlation plots of V i1 and V i2 coefficients (left), and V i1 and V i5 coefficients (right). The<br />
parameters reflecting solid dispersions of atorvastatin are marked as red triangles, while the factors<br />
calculated <strong>for</strong> pure <strong>for</strong>ms of the API are marked as black triangles.<br />
318<br />
319<br />
320<br />
321<br />
322<br />
323<br />
In general, the observed systematic variations of the scores V i5 obtained by multivariate analysis of<br />
19 F MAS NMR spectra of non-crystalline products of the API can result from many reasons including<br />
presence of impurities (traces of traditional crystalline <strong>for</strong>ms of the API), systematic changes in<br />
molecular con<strong>for</strong>mation, variation in molecular short-range order, presence of “embryonic”<br />
nanocrystallites etc. In this context, in our previous research [16] we extensively examined the results of<br />
15
V5<br />
324<br />
325<br />
326<br />
327<br />
328<br />
329<br />
330<br />
331<br />
332<br />
333<br />
334<br />
335<br />
336<br />
337<br />
19 F MAS NMR spectroscopy and compared them with other experimental methods such as 13 C CP/MAS<br />
NMR, FTIR and XRPD. Among others, we found out that asymmetric broadening of 19 F MAS NMR<br />
spectra (<strong>for</strong>mation of the low intensive high-frequency shoulders) is accompanied by the sharpening of<br />
originally diffusive broad X-ray reflections. This indicated that structural changes occurring in the<br />
amorphous phase of the API is associated with molecular rearrangement leading to the <strong>for</strong>mation of<br />
certain structural motifs with medium- or long-range periodic order.<br />
In our current work the recorded 19 F MAS NMR spectra of both pure API and the prepared solid<br />
dispersions assorted in the descending order according to V i5 scores exhibit similar inhomogeneous<br />
broadening. In case of the prepared solid dispersions, however, besides the left-hand shoulders, the<br />
right-hand ones appear as well (Figure 7). In analogy with our previous findings we assign this<br />
broadening to a systematic molecular rearrangement and <strong>for</strong>mation of partially-ordered nanosized<br />
domains. The low-frequency shoulders indicate new molecular assemblies the <strong>for</strong>mation of which is<br />
probably induced by the matrix of PVP. Detail structural investigation of these structures is currently<br />
under investigation.<br />
338<br />
D<br />
G<br />
E<br />
L<br />
A<br />
H<br />
AD<br />
FD<br />
DD<br />
HD<br />
ID<br />
N<br />
P<br />
J<br />
JK<br />
JD<br />
O<br />
-80 -90 -100 -110 -120 -130 -140<br />
chemical shift, ppm<br />
0.4<br />
0.3<br />
0.2<br />
0.1<br />
0.0<br />
-0.1<br />
-0.2<br />
-0.3<br />
Form I<br />
E G D<br />
L<br />
A<br />
H<br />
AD<br />
FD<br />
ID HD DD<br />
N<br />
P<br />
J<br />
JD JK<br />
O<br />
-0.20<br />
-0.15<br />
-0.10<br />
V1<br />
-0.05<br />
0.00<br />
-0.2<br />
Form X<br />
0.6<br />
0.4<br />
0.2<br />
0.0<br />
V3<br />
339<br />
340<br />
341<br />
342<br />
343<br />
Figure 7. 3D correlation plot of V i1 , V i3 and V i5 coefficients (left), and the corresponding 19 F MAS NMR<br />
spectra of non-crystalline <strong>for</strong>ms of the API (right). The 19 F MAS NMR spectra are sorted in ascending<br />
order by V i5 coefficients. The spectra corresponding to pure API are in black, the spectra reflecting solid<br />
dispersions are in red.<br />
16
344<br />
345<br />
346<br />
347<br />
348<br />
349<br />
350<br />
351<br />
352<br />
353<br />
354<br />
355<br />
356<br />
357<br />
358<br />
359<br />
360<br />
361<br />
362<br />
363<br />
In general there are several explanations of structural variability of amorphous phase of organic<br />
compounds.[20,21] One of them operates with the existence of rigid amorphous fraction (RAF) that is<br />
believed to be an intermediate between the crystalline and amorphous phase.[22,23] Another concept<br />
introduces „crystalline mezophase“, which combines properties of a crystalline phase (long-range order)<br />
with properties of an amorphous phase (e.g. glass transition). Alternatively, in some cases the term<br />
“pseudopolyamorphism” is used to describe this phenomenon although true polyamorphs exhibiting a<br />
first-order transition between them have never been seen in any organic substance.[24] Moreover, the<br />
amorphous phase can be contaminated by various nanosized crystal nuclei and traces of crystalline<br />
domains that can differ in their number, size, shape, distribution etc. All the above-mentioned<br />
phenomena, however, have only slight impact on the overall mean molecular structure of the amorphous<br />
phase. For instance, the crucial processes like released molecular dynamics usually occur only at<br />
interfacial regions. There<strong>for</strong>e the differences between the different amorphous <strong>for</strong>ms of a given<br />
compound can be hardly recognized using conventional physical and spectroscopic techniques. Over all<br />
these problems 19 F MAS NMR spectroscopy combined with factor analysis has sufficient potentiality to<br />
identify different amorphous (non-crystalline) <strong>for</strong>ms of the API in solid polymer dispersion with a high<br />
degree of reliability. Although 19 F MAS NMR spectroscopy cannot provide complete and detail<br />
description of structural changes occurring in amorphous phase of the API <strong>for</strong>mulated in solid polymer<br />
dispersion the combination with factor analysis provides the way how to rapidly control quality of the<br />
produced products.<br />
364<br />
365<br />
366<br />
367<br />
368<br />
369<br />
4. Conclusion<br />
Owing to the success of fluorinated compounds in medicinal chemistry, it may be predicted that the<br />
number of fluorine containing drugs will continue to increase. Similarly we can expect growing interest<br />
in the <strong>for</strong>mulation of APIs in solid dispersions <strong>for</strong> which traditional high-resolution spectral data can be<br />
hardly recorded because the amounts of the active compounds is very low usually less than 5%. In the<br />
17
370<br />
371<br />
372<br />
373<br />
374<br />
375<br />
376<br />
377<br />
378<br />
379<br />
presented communication it is demonstrated that 19 F MAS NMR spectroscopy combined with factor<br />
analysis (SVD algorithm) offers a fast and reliable tool to distinguish various amorphous <strong>for</strong>ms of the<br />
fluorine-containing API in solid polymer dispersions. Specifically, it is shown that the relatively poorlyresolved<br />
19 F MAS NMR spectra can be used to detect subtle structural changes in molecular<br />
arrangement of nanosized domains of the API induced by the polymer matrix. On the other hand, 19 F<br />
MAS NMR spectra are rather sensitive on the global changes in susceptibility and/or charging of the<br />
analyzed samples. There<strong>for</strong>e careful attention must be paid to the interpretation of changes in the<br />
spectral pattern. Fortunately, the applied factor analysis of the recorded spectra eliminates these effects.<br />
Ultimately, the proposed strategy thus provides a powerful tool <strong>for</strong> the fast analysis of new <strong>for</strong>mulations<br />
of fluorinated pharmaceutical substances in polymer matrices.<br />
380<br />
381<br />
382<br />
383<br />
Acknowledgement: Funding from Czech Science Foundation (Grant No. P106/11/P426) and<br />
Ministry of Education, Youth and Sports of the Czech Republic (research program 2B08021) are<br />
acknowledged<br />
384<br />
385<br />
References<br />
386<br />
387<br />
388<br />
389<br />
390<br />
391<br />
392<br />
393<br />
[1] A. Zakrzewski, M. Zakrzewski, Solid State Characterization of Pharmaceuticals, Pergamon, 2006.<br />
[2] J.Bauer, S. Spanton, R. Henry, J. Quick, W. Dziki, W. Porter, J. Morris, J. Pharm. Res. 18 (2001)<br />
859-866.<br />
[3] A. Paradkar, A.A. Ambike, B.K. Jadhav, K.R. Mahadik, Int J Pharm. 271 (2004) 281-286.<br />
[4] D. E. Alonzo, Y.I. Gao, D. Zhou, H. Mo, G. G. Z. Zhang, L. S. Taylor, J. of Pharm. Sci. 100 (2011)<br />
3316-3331.<br />
[5] A. Heinz, C.J. Strachan, F.Atassi, K.C.Gordon, T. Rades Cryst. Growth Des. 8 (2008) 119-127.<br />
[6] L. Yu, Adv. Drug Deliv. Rev. 48 (2001) 27–42.<br />
18
394<br />
395<br />
396<br />
397<br />
398<br />
399<br />
400<br />
[7] K.A.Graeser, C.J.Strachan, J.E.Patterson, K.C. Gordon, T. Rades, . Cryst. Growth Des. 8 (2008).<br />
128-135.<br />
[8] Greco, K., Bogner, R., Mol. Pharmaceutics 7 (2010) 1406–1418.<br />
[9] S-G.An, Y-T. Sohn,. Arch Pharm Res. 32 (2009).933-936.<br />
[10] G. Shete, V. Puri, V., L. Kumar, A.K. Bansal, Pharm Sci. Tech. 11 (2010) 598-609.<br />
[11] P. Matejicek, J. Brus, A. Jigunov, J. Plestil, M. Uchman, K. Prochazka, M. Gradzileski,<br />
Macromolecules 44 (2011) 3847-3855.<br />
401<br />
402<br />
403<br />
404<br />
405<br />
406<br />
407<br />
408<br />
409<br />
410<br />
411<br />
412<br />
413<br />
414<br />
415<br />
416<br />
417<br />
[12] Harris, R. K. Analyst 131 (2006) 351-373.<br />
[13] J. Brus, A. Jegorov, J. Phys. Chem. A. 108 (2004) 3955-3964.<br />
[14] J. M. Griffin, D.R. Martin, S.P. Brown, Angew. Chem. Int. Ed. 46 (2007) 8036–8038<br />
[15] S.M. Reutzel-Edens, J.K Bush,. P.A. Magee, G.A Stephenson, S.R.Byrn, Crys. Growth Des. 3<br />
(2003) 897-907.<br />
[16] J. Brus., M.Urbanova, I.Sedenkova, H.Brusova, Int J Pharm. 409 (2011) 62-74.<br />
[17] J. Spevacek, J. Brus, T. Divers, Y. Grohens, Eur. Polym. J. 43 (2007) 1866-1875.<br />
[18] J. Spevacek, J. Brus, Macromol. Symp. 265 (2008) 69-76.<br />
[19] I. de Boer, L. Bosman, J. Raap, H. Oschkinat, Huub J.M. de Groot, J.Magn. Res. 157 (2002) 286-<br />
291.<br />
[20] I. Saika-Voivod, P.H. Poole, F. Sciortino, Nature 412 (2001), 514-517.<br />
[21] D.Q.M. Craig, P.G. Royall, V.L. Kett, M.L. Hopton, Int. J. Pharm. 179 (1999) 179–207.<br />
[22] M.L Di Lorenzo, M.C. Righetti, Polymer 49 (2008) 1323-1331.<br />
[23] H. Chen, P. Cebe,. Journal of Thermal Analysis and Kalorimetry 89 (2007) 417–425.<br />
[24] P.H. Poole, T. Grande, C.A. Angell, P.F. McMillan, Science 275 (1997) 322–323.<br />
418<br />
19
419<br />
Graphical Abstract<br />
420<br />
421<br />
Characterization of Solid Polymer Dispersions of Active Pharmaceutical Ingredients by 19F MAS<br />
NMR and Factor Analysis<br />
422<br />
Martina Urbanova †* , Jiri Brus † , Ivana Sedenkova † , Olivia Policianova † , Libor Kobera †<br />
423<br />
424<br />
† Depar<strong>tm</strong>ent of NMR Spectroscopy, Institute of Macromolecular Chemistry, Heyrovsky sq. 2, 162 06<br />
Prague 6, Czech Republic<br />
425<br />
426<br />
427<br />
Factor analysis of 19 F MAS NMR spectra demonstrates fast and reliable method of characterization of<br />
amorphous modifications of solid pharmaceuticals in solid polymer dispersions.<br />
20
Figure1<br />
Solid<br />
dispersions<br />
Pure API<br />
Form I<br />
Pure API<br />
amorphous<br />
Pure API<br />
Form X<br />
-80 -90 -100 -110 -120 -130 -140<br />
chemical shift, ppm
Figure2<br />
13 C CP/MAS NMR<br />
19 F MAS NMR<br />
Form JD<br />
(solid dispersion)<br />
Form I<br />
Form X<br />
Form A<br />
(pure API)<br />
150 145 140 135 130 125 120 115 110 105 100<br />
chemical shift, ppm<br />
-95 -100 -105 -110 -115 -120 -125 -130<br />
chemical shift, ppm
Figure3<br />
API in<br />
tablets<br />
Pure<br />
API<br />
API in<br />
tablets<br />
1 2 3 4 5<br />
Form X<br />
-105 -110 -115 -120 -125<br />
chemical shift, ppm
Figure4<br />
Singular values<br />
75<br />
S 1<br />
Singular values<br />
19<br />
F MAS NMR<br />
70<br />
20<br />
S 2<br />
15<br />
10<br />
5<br />
S 3 S4<br />
S5<br />
S6<br />
0<br />
0 2 4 6 8 10 12 14 16 18 20 22 24 26 28 30 32<br />
No. of subspectra
Figure5<br />
0.08<br />
0.06<br />
S1<br />
0.10<br />
0.08<br />
0.06<br />
S2<br />
0.04<br />
0.04<br />
0.02<br />
0.00<br />
0.02<br />
-0.02<br />
-0.04<br />
0.00<br />
-80 -90 -100 -110 -120 -130 -140<br />
chemical shift, ppm<br />
0.20<br />
S3<br />
0.15<br />
-0.06<br />
-80 -90 -100 -110 -120 -130 -140<br />
chemical shift, ppm<br />
0.08<br />
0.06<br />
0.04<br />
0.02<br />
S4<br />
0.10<br />
0.00<br />
-0.02<br />
0.05<br />
-0.04<br />
-0.06<br />
0.00<br />
-0.08<br />
-0.10<br />
-0.05<br />
-80 -90 -100 -110 -120 -130 -140<br />
chemical shift, ppm<br />
0.12<br />
0.10<br />
0.08<br />
0.06<br />
0.04<br />
0.02<br />
0.00<br />
-0.02<br />
-0.04<br />
-0.06<br />
S5<br />
-80 -90 -100 -110 -120 -130 -140<br />
chemical shift, ppm<br />
0.08<br />
0.06<br />
0.04<br />
0.02<br />
0.00<br />
-0.02<br />
-0.04<br />
-0.06<br />
-0.08<br />
-80 -90 -100 -110 -120 -130 -140<br />
chemical shift, ppm<br />
S6<br />
-0.10<br />
-80 -90 -100 -110 -120 -130 -140<br />
chemical shift, ppm
Figure6<br />
19 F V 1<br />
19 F V 1<br />
19<br />
F V2<br />
0.3<br />
0.2<br />
0.1<br />
0.0<br />
-0.1<br />
-0.2<br />
JD<br />
KD<br />
AD<br />
FD<br />
CD BD<br />
DD<br />
ED<br />
HD GD ID<br />
C<br />
E G F<br />
H L<br />
D<br />
A<br />
KM<br />
I<br />
B<br />
N<br />
J<br />
O P<br />
solid polymeric<br />
dispersion<br />
disordered <strong>for</strong>ms of<br />
pure API<br />
Form I<br />
-0.20 -0.15 -0.10 -0.05 0.00<br />
FI`<br />
FI<br />
Form X<br />
FX'<br />
19<br />
F V5<br />
0.4<br />
0.3<br />
0.2<br />
0.1<br />
0.0<br />
-0.1<br />
-0.2<br />
-0.3<br />
-0.4<br />
JD KD<br />
C<br />
E<br />
F<br />
GD<br />
L M<br />
AK<br />
BI<br />
H<br />
GD ED<br />
CD BD<br />
FDAD<br />
DD<br />
HD<br />
ID N<br />
O<br />
P<br />
J<br />
Form I<br />
-0.20 -0.15 -0.10 -0.05 0.00<br />
FI<br />
FI'<br />
Form X<br />
FX'
Figure7<br />
V5<br />
D<br />
G<br />
E<br />
L<br />
A<br />
H<br />
AD<br />
FD<br />
DD<br />
HD<br />
ID<br />
N<br />
P<br />
J<br />
JK<br />
JD<br />
O<br />
-80 -90 -100 -110 -120 -130 -140<br />
chemical shift, ppm<br />
0.4<br />
0.3<br />
0.2<br />
0.1<br />
0.0<br />
-0.1<br />
-0.2<br />
-0.3<br />
Form I<br />
E G D<br />
L<br />
A<br />
H<br />
AD FD<br />
ID HD<br />
DD<br />
N<br />
P<br />
J<br />
JD JK<br />
O<br />
-0.20<br />
-0.15<br />
-0.10<br />
V1<br />
-0.05<br />
0.00<br />
-0.2<br />
Form X<br />
0.6<br />
0.4<br />
0.2<br />
0.0<br />
V3
Table1<br />
<strong>System</strong> solvent procedure T 1 ( 1 H), s<br />
T 1 ( 1 H), ms<br />
T 1 ( 1 H), s<br />
T 1 ( 1 H), ms<br />
API<br />
API<br />
PVP<br />
PVP<br />
Pure API --- --- 1.36 5.8 NA NA<br />
Pure PVP --- --- NA NA 2.5 28.2<br />
API-PVP (1) water free 1.38 13.5 1.40 22.4<br />
evaporation<br />
API-PVP (2) ethanol free 1.42 15.7 1.37 23.2<br />
evaporation<br />
API-PVP (3) tert-butanol free 1.48 14.3 1.31 25.1<br />
evaporation<br />
API-PVP (5) water lyophilization 1.28 17.5 1.46 20.1<br />
API-PVP (6) ethanol lyophilization 1.32 18.9 1.35 22.4<br />
API-PVP (7) tert-butanol lyophilization 1.25 15.3 1.21 23.6