UNITED STATES SECURITIES AND EXCHANGE ... - Imperial Oil
UNITED STATES SECURITIES AND EXCHANGE ... - Imperial Oil
UNITED STATES SECURITIES AND EXCHANGE ... - Imperial Oil
Create successful ePaper yourself
Turn your PDF publications into a flip-book with our unique Google optimized e-Paper software.
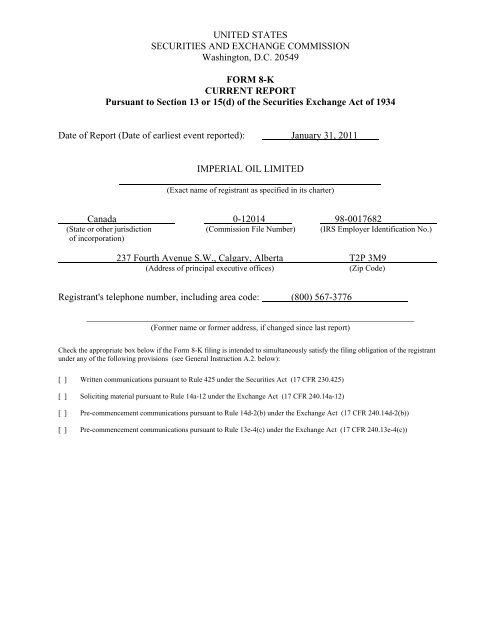
<strong>UNITED</strong> <strong>STATES</strong><br />
<strong>SECURITIES</strong> <strong>AND</strong> <strong>EXCHANGE</strong> COMMISSION<br />
Washington, D.C. 20549<br />
FORM 8-K<br />
CURRENT REPORT<br />
Pursuant to Section 13 or 15(d) of the Securities Exchange Act of 1934<br />
Date of Report (Date of earliest event reported): January 31, 2011<br />
IMPERIAL OIL LIMITED<br />
(Exact name of registrant as specified in its charter)<br />
Canada 0-12014 98-0017682<br />
(State or other jurisdiction (Commission File Number) (IRS Employer Identification No.)<br />
of incorporation)<br />
237 Fourth Avenue S.W., Calgary, Alberta T2P 3M9<br />
(Address of principal executive offices)<br />
(Zip Code)<br />
Registrant's telephone number, including area code: (800) 567-3776<br />
_________________________________________________________________________________<br />
(Former name or former address, if changed since last report)<br />
Check the appropriate box below if the Form 8-K filing is intended to simultaneously satisfy the filing obligation of the registrant<br />
under any of the following provisions (see General Instruction A.2. below):<br />
[ ] Written communications pursuant to Rule 425 under the Securities Act (17 CFR 230.425)<br />
[ ] Soliciting material pursuant to Rule 14a-12 under the Exchange Act (17 CFR 240.14a-12)<br />
[ ] Pre-commencement communications pursuant to Rule 14d-2(b) under the Exchange Act (17 CFR 240.14d-2(b))<br />
[ ] Pre-commencement communications pursuant to Rule 13e-4(c) under the Exchange Act (17 CFR 240.13e-4(c))
Item 2.02<br />
Results of Operations and Financial Condition.<br />
On January 31, 2011, <strong>Imperial</strong> <strong>Oil</strong> Limited (the "Company") by means of a press release<br />
disclosed information relating to the Company's financial condition and results of operations for<br />
the fiscal quarter ended December 31, 2010. A copy of the press release is attached as Exhibit<br />
99.1 to this report.<br />
Item 9.01<br />
(d)<br />
Financial Statements and Exhibits.<br />
Exhibits.<br />
The following exhibit is furnished as part of this report on Form 8-K:<br />
99.1 News release of the Company on January 31, 2011 disclosing information<br />
relating to the Company's estimated fourth-quarter financial and operating<br />
results for the fiscal quarter ended December 31, 2010.<br />
SIGNATURES<br />
Pursuant to the requirements of the Securities Exchange Act of 1934, the registrant has duly<br />
caused this report to be signed on its behalf by the undersigned hereunto duly authorized.<br />
IMPERIAL OIL LIMITED<br />
Date: January 31, 2011<br />
By: /s/ Brian Livingston<br />
_____________________________________<br />
Name: Brian Livingston<br />
Title: Vice-President, General Counsel and<br />
Corporate Secretary<br />
By: /s/ Brent Latimer<br />
_____________________________________<br />
Name: Brent Latimer<br />
Title: Assistant Secretary
Exhibit 99.1<br />
Q4 news release<br />
FOR THE TWELVE MONTHS ENDED DECEMBER 31, 2010<br />
Calgary, January 31, 2011<br />
<strong>Imperial</strong> <strong>Oil</strong> announces estimated fourth-quarter financial and operating results<br />
Fourth quarter<br />
Twelve months<br />
(millions of dollars, unless noted) 2010 2009 % 2010 2009 %<br />
Net income (U.S. GAAP) 799 534 50 2,210 1,579 40<br />
Net income per common share<br />
- assuming dilution (dollars) 0.94 0.62 50 2.59 1.84 40<br />
Capital and exploration expenditures 1,065 834 28 4,045 2,438 66<br />
Bruce March, chairman, president and chief executive officer of <strong>Imperial</strong> <strong>Oil</strong>, commented:<br />
“<strong>Imperial</strong> <strong>Oil</strong>’s focus on operational excellence delivered strong results with fourth quarter earnings of<br />
$799 million or $0.94 per share, up from $534 million in the fourth quarter of 2009. The 50 percent<br />
earnings increase resulted primarily from improved downstream margins, higher crude oil commodity<br />
prices and improved refinery operations. These factors were partially offset by unfavourable foreign<br />
exchange effects of the stronger Canadian dollar. Strong operating performance in all business segments<br />
allowed us to capture the higher crude oil realizations in the Upstream and improved margins in<br />
petroleum product markets.<br />
Earnings for the full year 2010 were $2,210 million or $2.59 per share, up from $1,579 million in the full<br />
year 2009, an increase of 40 percent.<br />
Our consistent long-term business approach and disciplined investment strategy will continue to position<br />
<strong>Imperial</strong> to grow without compromising base business performance. Capital and exploration expenditures<br />
for 2010 were $4 billion, up 66 percent from last year and included continued investment in the Kearl oil<br />
sands project. Capital expenditures in the fourth quarter were funded almost entirely through internally<br />
generated funds.”<br />
<strong>Imperial</strong> <strong>Oil</strong> is one of Canada’s largest corporations and a leading member of the country’s<br />
petroleum industry. The company is a major producer of crude oil and natural gas, Canada’s<br />
largest petroleum refiner, a key petrochemical producer and a leading marketer with a coast-tocoast<br />
supply network that includes about 1,850 retail service stations.<br />
1
Fourth quarter items of interest<br />
• Net income was $799 million, compared with $534 million for the fourth quarter of 2009, an increase<br />
of 50% or $265 million.<br />
• Net income per common share was $0.94, an increase of 50% from the fourth quarter of 2009.<br />
• Cash generated from operating activities was $1,004 million, compared with $927 million in the same<br />
period last year when changes in working capital also contributed cash flow.<br />
• Capital and exploration expenditures were $1,065 million, up 28% from the fourth quarter of 2009, as<br />
a result of progressing the Kearl oil sands and other growth projects.<br />
• Gross oil-equivalent barrels of production averaged 302,000 barrels a day, compared with 297,000<br />
barrels a day in the same period last year. Higher production volumes in the fourth quarter were<br />
primarily due to increased Cold Lake bitumen production, a result of improved facility reliability and<br />
the cyclic nature of production at Cold Lake.<br />
• Safety performance – <strong>Imperial</strong> achieved another best-ever safety performance year for employees<br />
and near-best year for contractors in its relentless pursuit of a workplace where nobody gets hurt. The<br />
company’s Operations Integrity Management System (OIMS) provides a rigorous and systematic<br />
approach to managing safety, health, environmental and security risks throughout all aspects of its<br />
business.<br />
• <strong>Oil</strong> sands tailings research – <strong>Imperial</strong> will work with Canadian Natural Resources, Shell<br />
Canada, Suncor Energy, Syncrude Canada, Teck Resources and Total E&P Canada to advance<br />
tailings management. The companies agreed to share existing technologies and research and to<br />
cooperate on a coordinated research and development plan going forward to improve the pace of<br />
oil sands reclamation.<br />
• Kearl oil sands project update – the initial development at Kearl is more than 50 percent complete<br />
and is progressing on schedule with expected start up in late 2012. The production rate for the initial<br />
development will start at about 110 thousand barrels a day.<br />
• Mackenzie natural gas project update – the National Energy Board announced its approval of<br />
plans to build and operate the project, subject to federal cabinet approval and 264 conditions in<br />
areas such as engineering, safety and environmental protection.<br />
• Horn River update – <strong>Imperial</strong> has begun its 2011 winter program which includes drilling exploration<br />
wells and beginning a horizontal multi-well pad pilot development to evaluate longer term well<br />
productivity. <strong>Imperial</strong> also added additional acreage, bringing its joint venture holdings to 346,000 net<br />
acres – one of industry’s largest acreage positions in the area.<br />
• Strong volumes in Fuels Marketing – total Retail fuel sales volume in 2010 was the highest in the<br />
history of the business, surpassing the prior record set in 2009. Growth was observed in both<br />
company-owned same store sales and through our branded wholesale network. In addition, the<br />
Aviation business also achieved a sales record in 2010.<br />
• Capital and exploration expenditures – cash generated by <strong>Imperial</strong>’s businesses helped fund $4<br />
billion in 2010 capital and exploration expenditures, including continued investment in the Kearl oil<br />
sands project. Planned capital and exploration expenditures in 2011 are between $4.0 and $4.5<br />
billion and the company is looking to invest about $35 to $40 billion in growth projects over the next<br />
decade.<br />
• Contributed to Canadian communities – <strong>Imperial</strong> contributed $15 million to Canadian communities<br />
in 2010, including the launch of <strong>Imperial</strong>’s signature program, Indigenous Women in Community<br />
Leadership. The program supports First Nations, Métis and Inuit women leaders in Canada in their<br />
pursuit of community development and economic independence.<br />
2
Fourth quarter 2010 vs. fourth quarter 2009<br />
The company's net income for the fourth quarter of 2010 was $799 million or $0.94 a share on a diluted<br />
basis, compared with $534 million or $0.62 a share for the same period last year.<br />
Earnings in the fourth quarter were higher than the same quarter in 2009 with improvements across all<br />
operating segments. The higher fourth quarter earnings were primarily attributable to stronger<br />
downstream margins of about $160 million, higher upstream crude oil commodity prices of about $80<br />
million and improved refinery operations of about $65 million. These factors were partially offset by the<br />
unfavourable foreign exchange effects of the stronger Canadian dollar of about $85 million.<br />
Upstream net income in the fourth quarter was $526 million, $35 million higher than the same period of<br />
2009. Earnings benefited from higher crude oil commodity prices of about $80 million, including the $35<br />
million negative impact from third-party pipeline reliability issues, and increased Cold Lake bitumen<br />
production of about $60 million. These factors were partially offset by the unfavourable foreign exchange<br />
effects of the stronger Canadian dollar of about $55 million, lower volumes at Syncrude of about $20<br />
million as a result of planned maintenance activities, and higher royalties due to higher commodity prices<br />
of about $15 million.<br />
The average price of Brent crude oil was U.S. $86.49 a barrel in the fourth quarter, up about 16 percent<br />
versus the corresponding period last year. The company's average realizations on sales of Canadian<br />
conventional crude oil and synthetic crude oil from Syncrude production also increased. However, the<br />
company's average bitumen realizations were slightly lower in the fourth quarter of 2010 versus 2009,<br />
reflecting a widened price spread between the lighter crude oils and Cold Lake bitumen, partly a result of<br />
third-party pipeline outages.<br />
Gross production of Cold Lake bitumen averaged 147 thousand barrels a day during the fourth quarter,<br />
up from 134 thousand barrels in the same quarter last year. Higher volumes were due to improved facility<br />
reliability as well as the cyclic nature of production at Cold Lake.<br />
The company's share of Syncrude's gross production in the fourth quarter was 79 thousand barrels a day,<br />
versus 82 thousand barrels in the fourth quarter of 2009. Slightly lower volumes were the result of<br />
planned maintenance activities, which began in September 2010 and were successfully completed in the<br />
fourth quarter of 2010.<br />
Gross production of conventional crude oil averaged 24 thousand barrels a day in the fourth quarter,<br />
unchanged from the same period last year.<br />
Gross production of natural gas during the fourth quarter of 2010 was 275 million cubic feet a day, down<br />
slightly from 298 million cubic feet in the same period last year. The lower production volume was<br />
primarily a result of natural reservoir decline.<br />
Downstream net income was $266 million in the fourth quarter of 2010, $214 million higher than the same<br />
period a year ago. Earnings benefited from stronger overall margins of about $160 million, improved<br />
refinery operations of about $65 million along with improved sales volumes of about $15 million. These<br />
factors were partially offset by the unfavourable effects of the stronger Canadian dollar of about $30<br />
million.<br />
Chemical net income was $25 million in the fourth quarter, $9 million higher than the same quarter last<br />
year. Improved industry margins for polyethylene and intermediate products were the main contributors to<br />
the increase.<br />
Net income effects from Corporate and other were negative $18 million in the fourth quarter, compared<br />
with negative $25 million in the same period of 2009.<br />
3
Fourth quarter 2010 vs. fourth quarter 2009 (continued)<br />
Cash flow generated from operating activities was $1,004 million during the fourth quarter of 2010,<br />
compared with $927 million in the same period of 2009. Higher cash flow was primarily driven by<br />
increased earnings partially offset by working capital effects.<br />
Investing activities used net cash of $992 million in the fourth quarter compared to $785 million in the<br />
corresponding period in 2009. Additions to property, plant and equipment were $1,045 million in the fourth<br />
quarter, compared with $807 million during the same quarter in 2009. For the Upstream segment,<br />
expenditures were primarily directed towards the advancement of the Kearl oil sands project. Other<br />
investments included development drilling at Cold Lake, exploration drilling at Horn River as well as<br />
environmental projects at Syncrude.<br />
In the fourth quarter, the company increased its debt level by $300 million by drawing on existing facilities.<br />
The company's balance of cash was $267 million at December 31, 2010, compared with $513 million at<br />
the end of 2009.<br />
4
Full year highlights<br />
• 2010 net income was $2,210 million, up from $1,579 million in 2009.<br />
• 2010 net income per common share increased to $2.59 compared to $1.84 in 2009.<br />
• Cash generated from operations was $3,207 million, more than double the $1,591 million generated<br />
in 2009.<br />
• Capital and exploration expenditures were $4,045 million, up 66 percent, supporting the Kearl oil<br />
sands and other growth projects.<br />
• Gross oil-equivalent barrels of production averaged 294 thousands of barrels a day, slightly higher<br />
than 293 thousands of barrels a day in 2009.<br />
• Per-share dividends declared in 2010 totaled $0.43, up from $0.40 in 2009.<br />
Full year 2010 vs. full year 2009<br />
Net income in 2010 was $2,210 million or $2.59 a share on a diluted basis, versus $1,579 million or $1.84<br />
a share for the full year 2009.<br />
For the full year 2010, earnings increased primarily due to the impacts of higher upstream commodity<br />
prices of about $880 million, improved refinery operations and lower refinery maintenance activities<br />
totaling about $145 million, increased Cold Lake bitumen production of about $90 million, improved<br />
Syncrude volumes of about $70 million, and higher Downstream sales volumes and margins of about $35<br />
million and $30 million respectively. These factors were partially offset by the unfavourable effects of the<br />
stronger Canadian dollar of about $410 million and higher royalty costs due to higher commodity prices of<br />
about $255 million. Gains from sale of non-operating assets in 2010 were about $40 million higher than<br />
the previous year.<br />
Upstream net income for the year was $1,764 million, up $440 million from 2009. Higher crude oil and<br />
natural gas commodity prices in 2010 increased revenues, contributing to higher earnings of about $880<br />
million. Earnings were also positively impacted by higher Cold Lake bitumen production of about $90<br />
million and higher Syncrude volumes, reflecting improved reliability, of about $70 million. These factors<br />
were partially offset by the impact of the stronger Canadian dollar of about $320 million and higher royalty<br />
costs due to higher commodity prices of about $255 million. Third-party pipeline reliability issues in the<br />
second half of 2010 negatively impacted the supply and transportation of western crude oil. The company<br />
estimates the negative impact on earnings of about $80 million mostly from lower realizations in the third<br />
quarter and October of 2010, the effect of which has been reflected in the commodity price factor above.<br />
The average price of Brent crude was U.S. $79.50 a barrel in 2010, up about 29 percent from the<br />
previous year. The company's average realizations on sales of Canadian conventional crude oil and<br />
synthetic crude oil from Syncrude production also increased. The company's average bitumen<br />
realizations were slightly higher in 2010, but by less than the relative increase in light crude oil prices,<br />
reflecting a widened price spread between the lighter crude oils and Cold Lake bitumen, attributable to<br />
third-party pipeline outages.<br />
Gross production of Cold Lake bitumen increased to 144 thousand barrels a day in 2010 from 141<br />
thousand barrels in 2009. Higher volumes in 2010 were due to improved facility reliability as well as the<br />
cyclic nature of production at Cold Lake.<br />
5
Full year 2010 vs. full year 2009 (continued)<br />
The company's share of gross production from Syncrude averaged 73 thousand barrels a day this year,<br />
up from 70 thousand barrels in 2009. Increased production was due to improved operational reliability.<br />
2010 gross production of conventional crude oil averaged 23 thousand barrels a day, compared with 25<br />
thousand barrels in 2009. Planned maintenance activities at the Norman Wells field and natural reservoir<br />
decline were the main contributors to the lower production.<br />
Gross production of natural gas in 2010 was 280 million cubic feet a day, down from 295 million cubic feet<br />
in 2009. The lower production volume was primarily a result of natural reservoir decline and maintenance<br />
activities.<br />
2010 Downstream net income was $442 million, an increase of $164 million over 2009. Higher earnings<br />
were primarily due to favourable impacts of about $145 million associated with improved refinery<br />
operations and lower refinery maintenance activities, improved sales volumes of about $35 million and an<br />
additional contribution from sale of non-operating assets of about $35 million. Stronger overall margins<br />
also contributed about $30 million to the earnings increase, despite a negative impact from alternate<br />
sourcing of crude oil as a result of third-party pipeline outages. These factors were partially offset by the<br />
unfavourable effects of the stronger Canadian dollar of about $90 million.<br />
Twelve-month Chemical net income was $69 million, up $23 million from 2009. Improved industry<br />
margins were partially offset by lower sales volumes for polyethylene products and higher costs due to<br />
planned maintenance activities.<br />
2010 net income effects from Corporate and other were negative $65 million, in line with the negative $69<br />
million reported last year.<br />
Key financial and operating data follow.<br />
Forward-Looking Statements<br />
Statements in this report relating to future plans, projections, events or conditions are forward-looking<br />
statements. Actual future results, including project plans, costs, timing and capacities; financing sources;<br />
the resolution of contingencies and uncertain tax positions; the effect of changes in prices and other<br />
market conditions; and environmental and capital expenditures could differ materially depending on a<br />
number of factors, such as the outcome of commercial negotiations; changes in the supply of and<br />
demand for crude oil, natural gas, and petroleum and petrochemical products; political or regulatory<br />
events; and other factors discussed in Item 1A of the company's 2009 Form 10K.<br />
6
Attachment I<br />
IMPERIAL OIL LIMITED<br />
FOURTH QUARTER 2010<br />
Fourth Quarter Twelve Months<br />
millions of Canadian dollars, unless noted 2010 2009 2010 2009<br />
Net income (U.S. GAAP)<br />
Total revenues and other income 6,936 5,864 25,092 21,398<br />
Total expenses 5,883 5,119 22,138 19,198<br />
Income before income taxes 1,053 745 2,954 2,200<br />
Income taxes 254 211 744 621<br />
Net income 799 534 2,210 1,579<br />
Net income per common share (dollars) 0.95 0.63 2.61 1.86<br />
Net income per common share - assuming dilution (dollars) 0.94 0.62 2.59 1.84<br />
Gain/(loss) on asset sales, after tax 30 12 80 38<br />
Total assets at December 31 20,580 17,473<br />
Total debt at December 31 756 140<br />
Interest coverage ratio - earnings basis<br />
(times covered) 370.3 276.0<br />
Other long-term obligations at December 31 2,753 2,839<br />
Shareholders' equity at December 31 11,177 9,439<br />
Capital employed at December 31 11,966 9,615<br />
Return on average capital employed (a)<br />
(percent) 20.5 16.8<br />
Dividends on common stock<br />
Total 93 85 364 340<br />
Per common share (dollars) 0.11 0.10 0.43 0.40<br />
Millions of common shares outstanding<br />
At December 31 847.6 847.6<br />
Average - assuming dilution 853.6 854.0 854.2 856.7<br />
(a)<br />
Return on capital employed is the net income excluding after-tax cost of financing, divided by the average of beginning and<br />
ending capital employed.<br />
7
Attachment II<br />
IMPERIAL OIL LIMITED<br />
FOURTH QUARTER 2010<br />
Fourth Quarter Twelve Months<br />
millions of Canadian dollars 2010 2009 2010 2009<br />
Total cash and cash equivalents at period end 267 513 267 513<br />
Net income 799 534 2,210 1,579<br />
Adjustment for non-cash items:<br />
Depreciation and depletion 186 197 747 781<br />
(Gain)/loss on asset sales (37) (13) (95) (45)<br />
Deferred income taxes and other 97 (12) 152 (61)<br />
Changes in operating assets and liabilities (41) 221 193 (a) (663)<br />
Cash from (used in) operating activities 1,004 927 3,207 1,591<br />
Cash from (used in) investing activities (992) (785) (3,709) (2,216)<br />
Proceeds from asset sales 49 22 144 67<br />
Cash from (used in) financing activities 204 (87) 256 (836)<br />
(a) 2010 cash flow from operating activities was positively impacted by the higher payable balances due to timing of expenditures<br />
and other working capital effects.<br />
8
Attachment III<br />
IMPERIAL OIL LIMITED<br />
FOURTH QUARTER 2010<br />
Fourth Quarter<br />
Twelve Months<br />
millions of Canadian dollars 2010 2009 2010 2009<br />
Net income (U.S. GAAP)<br />
Upstream 526 491 1,764 1,324<br />
Downstream 266 52 442 278<br />
Chemical 25 16 69 46<br />
Corporate and other (18) (25) (65) (69)<br />
Net income 799 534 2,210 1,579<br />
Total revenues<br />
Upstream 2,159 2,025 8,144 6,919<br />
Downstream 6,027 5,019 21,619 18,381<br />
Chemical 358 336 1,386 1,236<br />
Eliminations/Other (1,608) (1,516) (6,057) (5,138)<br />
Revenues 6,936 5,864 25,092 21,398<br />
Purchases of crude oil and products<br />
Upstream 707 624 2,692 2,024<br />
Downstream 4,698 4,002 17,169 14,164<br />
Chemical 255 248 1,009 898<br />
Eliminations (1,608) (1,517) (6,059) (5,152)<br />
Purchases of crude oil and products 4,052 3,357 14,811 11,934<br />
Production and manufacturing expenses<br />
Upstream 608 560 2,375 2,385<br />
Downstream 334 323 1,413 1,372<br />
Chemical 52 52 209 194<br />
Eliminations (1) - (1) -<br />
Production and manufacturing expenses 993 935 3,996 3,951<br />
Capital and exploration expenditures<br />
Upstream 1,006 745 3,844 2,167<br />
Downstream 55 84 184 251<br />
Chemical 1 3 10 15<br />
Corporate and other 3 2 7 5<br />
Capital and exploration expenditures 1,065 834 4,045 2,438<br />
Exploration expenses charged to income included above 20 27 191 153<br />
9
Attachment IV<br />
IMPERIAL OIL LIMITED<br />
FOURTH QUARTER 2010<br />
Operating statistics<br />
Fourth Quarter Twelve Months<br />
2010 2009 2010 2009<br />
Gross crude oil and Natural Gas Liquids (NGL) production<br />
(thousands of barrels a day)<br />
Cold Lake 147 134 144 141<br />
Syncrude 79 82 73 70<br />
Conventional 24 24 23 25<br />
Total crude oil production 250 240 240 236<br />
NGLs available for sale 6 7 7 8<br />
Total crude oil and NGL production 256 247 247 244<br />
Gross natural gas production (millions of cubic feet a day) 275 298 280 295<br />
Gross oil-equivalent production (a)<br />
(thousands of oil-equivalent barrels a day) 302 297 294 293<br />
Net crude oil and NGL production (thousands of barrels a day)<br />
Cold Lake 116 107 115 120<br />
Syncrude 73 73 67 65<br />
Conventional 18 18 17 20<br />
Total crude oil production 207 198 199 205<br />
NGLs available for sale 4 6 5 6<br />
Total crude oil and NGL production 211 204 204 211<br />
Net natural gas production (millions of cubic feet a day) 252 264 254 274<br />
Net oil-equivalent production (a)<br />
(thousands of oil-equivalent barrels a day) 253 248 246 257<br />
Cold Lake blend sales (thousands of barrels a day) 190 174 188 184<br />
NGL Sales (thousands of barrels a day) 7 12 10 10<br />
Natural gas sales (millions of cubic feet a day) 270 277 264 272<br />
Average realizations (Canadian dollars)<br />
Conventional crude oil realizations (a barrel) 74.14 69.92 71.64 60.32<br />
NGL realizations (a barrel) 58.94 48.15 50.09 41.19<br />
Natural gas realizations (a thousand cubic feet) 3.60 4.23 4.04 4.11<br />
Synthetic oil realizations (a barrel) 84.31 78.64 80.63 69.69<br />
Bitumen realizations (a barrel) 58.91 59.77 58.36 51.81<br />
Refinery throughput (thousands of barrels a day) 467 412 444 413<br />
Refinery capacity utilization (percent) 93 82 88 82<br />
Petroleum product sales (thousands of barrels a day)<br />
Gasolines 226 200 218 200<br />
Heating, diesel and jet fuels 177 142 153 143<br />
Heavy fuel oils 29 31 28 27<br />
Lube oils and other products 41 42 43 39<br />
Net petroleum products sales 473 415 442 409<br />
Petrochemical Sales (thousands of tonnes a day) 2.7 2.9 2.7 2.8<br />
(a) Gas converted to oil-equivalent at 6 million cubic feet = 1 thousand barrels<br />
10
Attachment V<br />
IMPERIAL OIL LIMITED<br />
FOURTH QUARTER 2010<br />
Net income (U.S. GAAP)<br />
(millions of Canadian dollars)<br />
Net income<br />
per common share<br />
(dollars)<br />
2006<br />
First Quarter 591 0.60<br />
Second Quarter 837 0.85<br />
Third Quarter 822 0.84<br />
Fourth Quarter 794 0.83<br />
Year 3,044 3.12<br />
2007<br />
First Quarter 774 0.82<br />
Second Quarter 712 0.76<br />
Third Quarter 816 0.88<br />
Fourth Quarter 886 0.97<br />
Year 3,188 3.43<br />
2008<br />
First Quarter 681 0.76<br />
Second Quarter 1,148 1.29<br />
Third Quarter 1,389 1.57<br />
Fourth Quarter 660 0.77<br />
Year 3,878 4.39<br />
2009<br />
First Quarter 289 0.34<br />
Second Quarter 209 0.25<br />
Third Quarter 547 0.64<br />
Fourth Quarter 534 0.63<br />
Year 1,579 1.86<br />
2010<br />
First Quarter 476 0.56<br />
Second Quarter 517 0.61<br />
Third Quarter 418 0.49<br />
Fourth Quarter 799 0.95<br />
Year 2,210 2.61<br />
11
Attachment VI<br />
IMPERIAL OIL LIMITED<br />
FOURTH QUARTER 2010<br />
Factors affecting net income (millions of Canadian dollars)<br />
Upstream Earnings Q410 vs Q409<br />
600<br />
80 25 (55)<br />
(15)<br />
Q410<br />
450<br />
Q410 Q409 vs Q409<br />
300<br />
150<br />
491 526<br />
526 491 35<br />
0<br />
Q409 Price Volume Forex Royalty Q410<br />
Downstream Earnings Q410 vs Q409<br />
300<br />
250<br />
200<br />
160<br />
65<br />
15<br />
(26)<br />
Q410<br />
Q410 Q409 vs Q409<br />
266 52 214<br />
150<br />
100<br />
50<br />
0<br />
52<br />
Q409 Margins Costs Volume Forex /<br />
Other<br />
266<br />
Q410<br />
Chemical Earnings Q410 vs Q409<br />
40<br />
30<br />
15<br />
(6)<br />
Q410<br />
Q410 Q409 vs Q409<br />
25 16 9<br />
20<br />
10<br />
16<br />
25<br />
0<br />
Q409 Margins Other Q410<br />
12


