UNITED STATES SECURITIES AND EXCHANGE ... - Imperial Oil
UNITED STATES SECURITIES AND EXCHANGE ... - Imperial Oil
UNITED STATES SECURITIES AND EXCHANGE ... - Imperial Oil

Create successful ePaper yourself
Turn your PDF publications into a flip-book with our unique Google optimized e-Paper software.
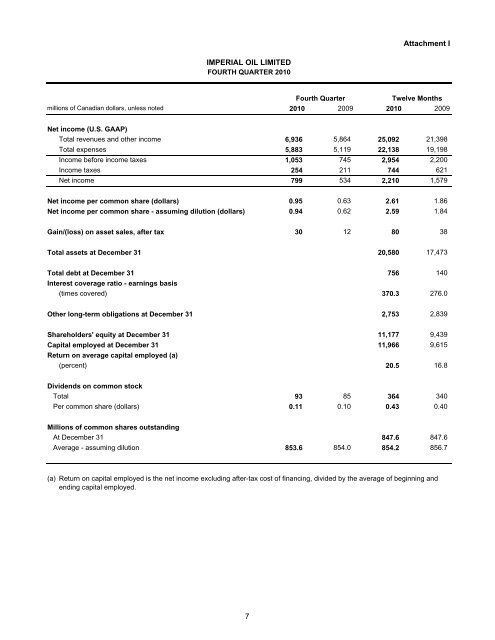
Attachment I<br />
IMPERIAL OIL LIMITED<br />
FOURTH QUARTER 2010<br />
Fourth Quarter Twelve Months<br />
millions of Canadian dollars, unless noted 2010 2009 2010 2009<br />
Net income (U.S. GAAP)<br />
Total revenues and other income 6,936 5,864 25,092 21,398<br />
Total expenses 5,883 5,119 22,138 19,198<br />
Income before income taxes 1,053 745 2,954 2,200<br />
Income taxes 254 211 744 621<br />
Net income 799 534 2,210 1,579<br />
Net income per common share (dollars) 0.95 0.63 2.61 1.86<br />
Net income per common share - assuming dilution (dollars) 0.94 0.62 2.59 1.84<br />
Gain/(loss) on asset sales, after tax 30 12 80 38<br />
Total assets at December 31 20,580 17,473<br />
Total debt at December 31 756 140<br />
Interest coverage ratio - earnings basis<br />
(times covered) 370.3 276.0<br />
Other long-term obligations at December 31 2,753 2,839<br />
Shareholders' equity at December 31 11,177 9,439<br />
Capital employed at December 31 11,966 9,615<br />
Return on average capital employed (a)<br />
(percent) 20.5 16.8<br />
Dividends on common stock<br />
Total 93 85 364 340<br />
Per common share (dollars) 0.11 0.10 0.43 0.40<br />
Millions of common shares outstanding<br />
At December 31 847.6 847.6<br />
Average - assuming dilution 853.6 854.0 854.2 856.7<br />
(a)<br />
Return on capital employed is the net income excluding after-tax cost of financing, divided by the average of beginning and<br />
ending capital employed.<br />
7