Annual Report 2012 - Indesit
Annual Report 2012 - Indesit
Annual Report 2012 - Indesit

You also want an ePaper? Increase the reach of your titles
YUMPU automatically turns print PDFs into web optimized ePapers that Google loves.
<strong>Annual</strong> <strong>Report</strong> <strong>2012</strong>
Contents<br />
3 Financial highlights<br />
4 <strong>Report</strong> on operations 4 Market trends<br />
Currency movements<br />
5 Consolidated results<br />
Revenue<br />
Product cost<br />
6 Other operating costs<br />
Operating profitability<br />
7 Results by geographical segment<br />
8 Western Europe<br />
9 Eastern Europe<br />
10 International<br />
11 Non-recurring items<br />
Net profit<br />
12 Cash flows<br />
13 Consolidated statement of financial position<br />
15 Investments<br />
16 Research and development activities<br />
17 Financial position of the Parent <strong>Indesit</strong> Company S.p.A.<br />
Key financial indicators of the Parent<br />
18 Cash flows<br />
19 Summary of the financial position of the Parent<br />
Reconciliation between equity and profit for the year of the Parent<br />
20 Corporate governance and ownership structure<br />
21 Intercompany and related party transactions, and significant, non-recurring, atypical<br />
or unusual transactions<br />
22 Information on Company bodies<br />
23 Stock option plans<br />
Treasury shares and shares of the Parent<br />
Information about significant non-EU companies<br />
24 Information about employees<br />
Composition of the work force<br />
Training, organisation and remuneration policies<br />
Safety at work<br />
25 Privacy<br />
Performance of subsidiaries<br />
Management and coordination activities<br />
Principal risks and uncertainties faced by the Group and the Parent<br />
26 Strategic and operational risks<br />
27 Financial risks<br />
28 Legal and compliance risks<br />
29 Significant events during the year and subsequent to year end<br />
32 Outlook<br />
Significant risks and uncertainties in 2013<br />
33 Proposed allocation of profit for the year<br />
34 Consolidated financial<br />
statements<br />
at 31 Decembre <strong>2012</strong><br />
36 Consolidated financial statements<br />
40 Notes<br />
111 Attachments<br />
120 Separate financial<br />
statements<br />
at 31 Decembre <strong>2012</strong><br />
122 Separate financial statements<br />
127 Notes<br />
189 Attachments<br />
1
<strong>Indesit</strong> Company S.p.A.<br />
Registered Offices: Viale A. Merloni 47 - 60044 Fabriano<br />
Secondary Offices: Via della Scrofa 64 - 00186 Rome<br />
Share Capital: Euro 102,759,269.40 fully paid-up<br />
Tax Code/VAT no. 00693740425<br />
Ancona Companies Register no. 9677<br />
Approach taken<br />
The Group reporting to <strong>Indesit</strong> Company S.p.A. is hereafter referred to as <strong>Indesit</strong> Company or<br />
<strong>Indesit</strong> or simply the Group. When the commentary relates to the Parent or individual subsidiaries,<br />
their registered names are stated in full. This report on operations contains information about<br />
both the <strong>Indesit</strong> Group as a whole and the Parent, <strong>Indesit</strong> Company S.p.A.<br />
All the amounts presented in this report on operations and in the consolidated and separate<br />
financial statements and explanatory notes are stated in millions of euro; the comparisons made<br />
(in brackets) relate to information for the prior year. Percentages (margins and changes) are<br />
determined with reference to amounts stated in thousands of euro.<br />
The intermediate indicators of profitability, EBIT 1 and EBITDA 2 utilized in this report are not<br />
identified as accounting measures in the IFRS endorsed by the European Union and their<br />
quantitative determination might not be unequivocal. These indicators represent a measure used<br />
by management to monitor and assess operating performance. Management believes that these<br />
indicators are important parameters for the measurement of operating performance, since they<br />
are not influenced by the effects of the various criteria for the determination of taxable income,<br />
or the amount and characteristics of capital invested. The criteria applied by the Group and the<br />
Parent for determining these indicators might not be consistent with those adopted, for example,<br />
in the contractual definitions of the financial covenants for borrowing, or with those adopted by<br />
other groups or companies and, accordingly, their values might not be comparable with those<br />
determined by such other groups or companies.<br />
1. EBIT: operating profit reported in the income statement.<br />
2. EBITDA: operating profit reported in the income statement, stated gross of depreciation, amortisation<br />
and impairment losses.<br />
2
Financial highlights<br />
Income statement key data of the accounting period<br />
(million euro) <strong>2012</strong> 2011 2010<br />
Revenue 2,886.0 2,825.3 2,877.3<br />
Gross operating profit (EBITDA) 242.6 262.7 309.8<br />
Depreciation and amortisation (109.9) (112.4) (126.0)<br />
Operating profit (EBIT) 132.6 150.3 183.8<br />
Operating profit (EBIT)/Revenue 4.6% 5.3% 6.4%<br />
Profit for the period attributable to the owners of the Parent 62.3 58.8 89.7<br />
Net basic earnings per share (euro) 0.60 0.57 0.87<br />
Net diluted earnings per share (euro) 0.60 0.57 0.87<br />
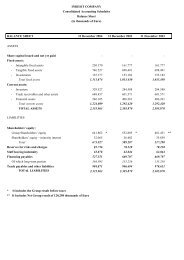
Balance sheet key data<br />
(million euro) 31.12.<strong>2012</strong> 31.12.2011 31.12.2010<br />
Net working capital (47.7) (25.0) 7.0<br />
Non-current assets 1,190.8 1,067.0 1,081.1<br />
Non-current liabilities 407.1 413.6 398.1<br />
Equity attributable to the owners of the Parent 635.8 554.1 572.9<br />
Net financial indebtedness 256.4 218.2 178.9<br />
Net financial indebtedness/Equity 40.3% 39.4% 31.2%<br />
Cash flow<br />
(million euro) <strong>2012</strong> 2011 2010<br />
Operating cash flow 128.2 113.5 201.6<br />
Cash flow from investing activities (142.6) (121.8) (74.7)<br />
Cash flow from financing activities (77.2) 20.2 (95.2)<br />
Free Cash Flow (38.1) (39.3) 111.4<br />
3
<strong>Report</strong> on operations at 31 December <strong>2012</strong><br />
<strong>Report</strong> on operations at 31 December <strong>2012</strong><br />
Market trends<br />
The household appliances market (industry shipments) declined by 3.0% in Western Europe,<br />
compared to 2011, but expanded by 3.3% in Eastern Europe. Overall, demand in Greater<br />
Europe fell by 0.8%.<br />
Change in industry shipments<br />
by segment <strong>2012</strong>/2011<br />
Change in industry shipments<br />
<strong>2012</strong>/2011<br />
6%<br />
4%<br />
2%<br />
0%<br />
–2%<br />
–4%<br />
–6%<br />
1Q 2Q 3Q 4Q<br />
1.0%<br />
0.5%<br />
0%<br />
–0.5%<br />
–1.0%<br />
–1.5%<br />
–2.0%<br />
1Q 2Q 3Q 4Q<br />
Western Europe<br />
Eastern Europe<br />
Total Europe<br />
Currency movements<br />
With respect to 2011, the euro 3 depreciated by 6.6% against the British pound, 2.3% against<br />
the Russian ruble and 1.0% against the Turkish lira, but appreciated by 1.6% against the<br />
Polish zloty.<br />
Exchange rates<br />
vs euro 31.12.<strong>2012</strong> 31.12.2011 Change %<br />
Effect on<br />
revenue<br />
Effect on<br />
profitability<br />
GBP Year 0.811 0.868 -6.6% positive positive<br />
Closing 0.816 0.835 -2.3%<br />
RUR Year 39.926 40.881 -2.3% positive positive<br />
Closing 40.330 41.765 -3.4%<br />
PLN Year 4.185 4.120 1.6% negative negative<br />
Closing 4.074 4.458 -8.6%<br />
TRY Year 2.314 2.338 -1.0% positive positive<br />
Closing 2.355 2.443 -3.6%<br />
3. Determined with reference to the average monthly rates reported by the European Central Bank.<br />
4
<strong>Report</strong> on operations at 31 December <strong>2012</strong><br />
Consolidated results<br />
Revenue<br />
Total revenue & % change<br />
<strong>2012</strong>/2011<br />
Group revenue amounted to 2,886.0 million euro (2,825.3 million euro), up by 2.1%<br />
compared with 2011. Revenue from finished products rose by 1.6%, due to the beneficial<br />
effect of currency movements (2.4%) and a rise in sales volume (1.8%). These effects were<br />
partially offset by a 2.6% decline attributable to adverse changes in the price/mix ratio.<br />
mEur<br />
900<br />
800<br />
700<br />
644.4<br />
621.5<br />
685.0<br />
677.3<br />
797.6<br />
762.7<br />
7<br />
740.9 781.8<br />
600<br />
400<br />
300<br />
200<br />
100<br />
0<br />
1Q 2Q 3Q 4Q<br />
2011<br />
<strong>2012</strong><br />
%<br />
10<br />
8<br />
6<br />
4<br />
6.3%<br />
3.2%<br />
3.4%<br />
4.9%<br />
4.8%<br />
9.2%<br />
18.7%<br />
Revenue from services was 9.3% higher, essentially due to the increased sales of extended<br />
warranties in the UK, where demand is greatest.<br />
Total revenue is analysed below and the related changes are compared with the percentage<br />
changes in EBIT.<br />
2<br />
0<br />
0.3%<br />
1Q 2Q 3Q 4Q<br />
2011 <strong>2012</strong><br />
(million euro) <strong>2012</strong> 2011 Change %<br />
Revenue from finished products 2,656.8 2,615.7 1.6%<br />
Revenue from service operations 229.2 209.6 9.3%<br />
Total revenue 2,886.0 2,825.3 2.1%<br />
(million euro) <strong>2012</strong> 2011 Change %<br />
Home Care 1,196.7 1,160.4 3.1%<br />
Food Treatment 1,414.0 1,417.2 -0.2%<br />
Service and Consumer Care 275.3 247.7 11.1%<br />
Total revenue 2,886.0 2,825.3 2.1%<br />
Product cost<br />
At constant exchange rates, product cost fell by 0.6% during <strong>2012</strong> with respect to 2011. This<br />
was due to reductions in both sourcing costs (-0.4%) and manufacturing costs (-0.2%).<br />
The quarterly percentage changes in product cost are analyzed in the following table:<br />
Q1 <strong>2012</strong> Q2 <strong>2012</strong> Q3 <strong>2012</strong> Q4 <strong>2012</strong> <strong>2012</strong><br />
Sourcing cost -0.7% -0.5% -0.7% -0.5% -0.4%<br />
Manufacturing cost 1.1% 0.5% 0.2% -2.2% -0.2%<br />
Total product cost 0.4% 0.0% -0.5% -2.7% -0.6%<br />
5
<strong>Report</strong> on operations at 31 December <strong>2012</strong><br />
Other operating costs<br />
Advertising & promotion<br />
expenses<br />
mEur<br />
30<br />
25<br />
20<br />
18.3<br />
83<br />
19.2 18.7<br />
15<br />
16.2<br />
13.7<br />
14.9<br />
11.8<br />
11.7<br />
10<br />
5<br />
0<br />
1Q 2Q 3Q 4Q<br />
3.5%<br />
3.0%<br />
2.5%<br />
2.0%<br />
1.5%<br />
1.0%<br />
0.5%<br />
0.0%<br />
At current exchange rates, advertising and promotion expenses totaled 54.7 million euro<br />
(69.9 million euro).<br />
Logistics costs were 9.2 million euro (about 4.1%) higher than in 2011, due to a change in<br />
network logistical flows and an increase in customs duties.<br />
Compared with the prior year, the cost of Service activities was higher due, in the main, to<br />
the revision of insurance costs.<br />
2011 <strong>2012</strong><br />
Operating profitability<br />
Operating profit<br />
mEur<br />
80<br />
70<br />
60<br />
50<br />
40<br />
30<br />
40.5<br />
37.138.1<br />
20<br />
20.1<br />
23.1<br />
49.6<br />
72.3<br />
Gross operating profit (EBITDA) was 242.6 million euro (262.7 million euro), representing<br />
8.4% (9.3%) of revenue, and 221.1 million euro (253.7 million euro) before non-recurring<br />
items, representing 7.7% (9.0%) of revenue.<br />
Operating profit (EBIT) was 132.6 million euro (150.3 million euro), representing 4.6%<br />
(5.3%) of revenue, and 110.1 million euro (141.6 million euro) before non-recurring items,<br />
representing 3.8% (5.0%) of revenue.<br />
The incidence of depreciation and amortisation was 3.8% (4.0%).<br />
Compared with 2011, the principal changes in the components of operating profit (EBIT) are<br />
indicated below:<br />
10<br />
2.2<br />
0<br />
1Q 2Q 3Q 4Q<br />
2011 <strong>2012</strong><br />
Operating margin %<br />
%<br />
10<br />
8<br />
9.2%<br />
18.7%<br />
6.3%<br />
6<br />
4.9%<br />
4.8%<br />
4<br />
2<br />
3.2% 3.4%<br />
0.3%<br />
0<br />
1Q 2Q 3Q 4Q<br />
(million euro) <strong>2012</strong><br />
Exchange rate 42<br />
Advertising & promotion 16<br />
Positive<br />
Non-recurring items 11<br />
(at constant<br />
exchange rates) Sales volume 10<br />
Sourcing cost 7<br />
Manufacturing cost 5<br />
Negative<br />
Price/Mix (91)<br />
(at constant<br />
Distribution cost (7)<br />
exchange rates)<br />
Bad debts (5)<br />
Operating profit (EBIT), excluding non-recurring items, is analysed by quarter in the following<br />
chart:<br />
2011 <strong>2012</strong><br />
6
<strong>Report</strong> on operations at 31 December <strong>2012</strong><br />
Results by geographical<br />
segment<br />
The following geographical areas have been identified as representative of the Group’s<br />
operating segments: Western Europe 4 , Eastern Europe 5 and International 6 .<br />
The costs not allocated to the various areas principally comprise corporate costs and net<br />
restructuring charges, essentially of an industrial nature.<br />
Year <strong>2012</strong> (million euro)<br />
Western<br />
Europe<br />
Eastern<br />
Europe International<br />
Costs not<br />
allocated<br />
Total<br />
Total revenue 1,664.4 1,078.0 143.5 0.0 2,886.0<br />
Operating costs (1,557.8) (994.5) (127.5) (73.6) (2,753.3)<br />
Operating profit 106.7 83.5 16.1 (73.6) 132.6<br />
Revenue by segment <strong>2012</strong> (mEur & %) Operating profit by segment * <strong>2012</strong> (mEur & %)<br />
143.5<br />
5%<br />
1,664.4<br />
58%<br />
16.1<br />
8%<br />
106.7<br />
52%<br />
1,078.0<br />
37%<br />
83.5<br />
40%<br />
Year 2011 (million euro)<br />
Western<br />
Europe<br />
Eastern<br />
Europe International<br />
Costs not<br />
allocated<br />
Total<br />
Total revenue 1,695.7 985.6 144.0 0.0 2,825.3<br />
Operating costs (1,546.5) (898.6) (130.0) (99.9) (2,675.0)<br />
Operating profit 149.2 87.0 14.0 (99.9) 150.3<br />
Revenue by segment 2011 (mEur & %) Operating profit by segment * 2011 (mEur & %)<br />
144.0<br />
5%<br />
1,695.7<br />
60%<br />
14.0<br />
6%<br />
149.2<br />
60%<br />
985.6<br />
35%<br />
87.0<br />
35%<br />
* Before not allocated costs<br />
4. This includes: Italy, the UK and Ireland, France, the Netherlands, Spain, Portugal, Germany, Austria,<br />
Switzerland, Belgium, Scandinavia.<br />
5. This includes: Russia and the Asian Republics, Belarus, Kazakhstan, Poland, Ukraine, Moldova,<br />
Czech Republic, Hungary, Romania, Greece, the Baltic States, Caucasian Republics, Slovak Republic,<br />
Turkey, Bulgaria and the Balkans.<br />
6. This includes all other non-European markets.<br />
7
<strong>Report</strong> on operations at 31 December <strong>2012</strong><br />
Western Europe<br />
Change %<strong>2012</strong>/2011 - Revenue<br />
mEur<br />
460<br />
440<br />
420<br />
400<br />
428.2<br />
401.2<br />
394.6<br />
390.9<br />
9<br />
432.5<br />
426.3<br />
446.6<br />
439.8<br />
380<br />
360<br />
340<br />
1Q 2Q 3Q 4Q<br />
2011 <strong>2012</strong><br />
(million euro) <strong>2012</strong> 2011 Change Change %<br />
Revenue 1,664.4 1,695.7 (31.3) (1.8)<br />
Operating profit 106.7 149.2 (42.5) (28.5)<br />
Operating margin % 6.4% 8.8% -2.4 p.p.<br />
Operating profit<br />
mEur<br />
60<br />
50 48.7<br />
40<br />
30 29.4<br />
22.6<br />
20.5<br />
20<br />
10<br />
30.030.5<br />
47.8<br />
26.2<br />
Revenue<br />
Revenue fell by 1.8% compared with the prior year.<br />
Revenue from finished products fell due to a reduction in the volume of sales and adverse<br />
price/mix changes.<br />
By contrast, there was a beneficial effect deriving from the appreciation of the British pound.<br />
0<br />
1Q 2Q 3Q 4Q<br />
2011 <strong>2012</strong><br />
There was a general downward trend in sales within the Western Europe Area (with the<br />
exception of the UK and Northern Europe).<br />
Operating margin %<br />
14%<br />
12% 11.4%<br />
10%<br />
8% 7.3%<br />
7.1%<br />
6%<br />
5.7%<br />
7.0%<br />
4%<br />
5.3%<br />
2%<br />
10.7%<br />
5.9%<br />
In particular, demand in Italy fell by 9.3%.<br />
Profitability<br />
Area profitability was lower than in the prior year due to an especially adverse price/mix<br />
effect and the reduction in sales volume.<br />
The negative effects of these drivers were partly offset by the change in the euro/sterling<br />
exchange rate and the rationalization of advertising and promotion costs.<br />
0%<br />
1Q 2Q 3Q 4Q<br />
2011 <strong>2012</strong><br />
8
<strong>Report</strong> on operations at 31 December <strong>2012</strong><br />
Eastern Europe<br />
Change % <strong>2012</strong>/2011 - Revenue<br />
mEur<br />
350<br />
300<br />
250<br />
200 180.7<br />
191.7<br />
150<br />
100<br />
50<br />
0<br />
326.9<br />
297.8<br />
304.7<br />
254.7<br />
260.9<br />
246.2<br />
1Q 2Q 3Q 4Q<br />
2011 <strong>2012</strong><br />
(million euro) <strong>2012</strong> 2011 Change Change %<br />
Revenue 1,078.0 985.6 92.4 9.4<br />
Operating profit 83.5 87.0 (3.6) (4.1)<br />
Operating margin % 7.7% 8.8% -1.1 p.p.<br />
Operating profit<br />
mEur<br />
35<br />
31.932.2<br />
30<br />
25.2<br />
25<br />
21.2<br />
22.2<br />
20<br />
17.6<br />
15<br />
11.8<br />
10<br />
8.5<br />
5<br />
0<br />
1Q 2Q 3Q 4Q<br />
2011 <strong>2012</strong><br />
Operating margin %<br />
Revenue<br />
Revenue was 9.4% higher than in 2011.<br />
Revenue from finished products rose due to an increase in the volume of sales and the<br />
performance of the Russian ruble.<br />
By contrast, changes in the price/mix had an adverse effect.<br />
Profitability<br />
The operating margin fell by 4.1%.<br />
The higher volume of sales, the appreciation of the Russian ruble and the containment<br />
of manufacturing costs all mitigated the decline in Area profitability, correlated with the<br />
performance of price/mix.<br />
%<br />
12<br />
10.7%<br />
10<br />
8<br />
6<br />
4<br />
6.5%<br />
4.5%<br />
8.6%<br />
6.9%<br />
9.8%<br />
8.5%<br />
8.3%<br />
2<br />
0<br />
1Q 2Q 3Q 4Q<br />
2011 <strong>2012</strong><br />
9
<strong>Report</strong> on operations at 31 December <strong>2012</strong><br />
International<br />
Change % <strong>2012</strong>/2011 - Revenue<br />
mEur<br />
45<br />
40<br />
35<br />
30<br />
39.4<br />
35.5 36.5<br />
28.7<br />
38.6<br />
38.2<br />
37.3<br />
33.4<br />
25<br />
20<br />
15<br />
10<br />
5<br />
0<br />
1Q 2Q 3Q 4Q<br />
(million euro) <strong>2012</strong> 2011 Change Change %<br />
Revenue 143.5 144.0 (0.4) (0.3)<br />
Operating profit 16.1 14.0 2.1 15.0<br />
Operating margin % 11.2% 9.7% 1.5 p.p.<br />
Operating profit<br />
mEur<br />
7<br />
6 5.7 57<br />
5<br />
4<br />
3.3<br />
3<br />
2<br />
1<br />
2011 <strong>2012</strong><br />
4.6 46<br />
4.3<br />
2.3<br />
4.0<br />
1.7 17<br />
4.2<br />
Revenue<br />
Revenue from finished products fell compared with 2011 due to the lower volume of sales.<br />
This effect was partially offset by an improvement in the price/mix and by exchange rate<br />
movements.<br />
Profitability<br />
Area profitability improved by 15% with respect to 2011, due to a positive price/mix effect<br />
and a reduction in logistics costs (including customs duties).<br />
0<br />
1Q 2Q 3Q 4Q<br />
2011 <strong>2012</strong><br />
Operating margin %<br />
%<br />
18<br />
16<br />
16.2%<br />
14<br />
12<br />
10<br />
11.5%<br />
11.8%<br />
11.7%<br />
10.4%<br />
11.3%<br />
8<br />
6<br />
5.9% 5.0%<br />
4<br />
2<br />
0<br />
1Q 2Q 3Q 4Q<br />
2011 <strong>2012</strong><br />
10
<strong>Report</strong> on operations at 31 December <strong>2012</strong><br />
Non-recurring items<br />
Net non-recurring income amounted to 22.5 million euro (8.8 million euro).<br />
The principal effect on non-recurring items by about 44.0 million euro, was a reduction<br />
in the inflation parameters used to calculate pension benefits under the plan operated<br />
by <strong>Indesit</strong> Company UK Ltd. This positive effect was partially offset by the use of the<br />
restructuring fund relating to the closure of the plant in None,<br />
Net profit<br />
Net financial charges amounted to 30.4 million euro (37.2 million euro).<br />
Operating profit<br />
mEur<br />
The reduction was due to favourable exchange rate movements and management of the<br />
related hedges.<br />
50<br />
40<br />
40.8<br />
Taxation amounted to 40.0 million euro (54,2 million euro) in <strong>2012</strong>.<br />
30<br />
20<br />
10<br />
20.0<br />
10.9<br />
12.0<br />
20.6<br />
15.0<br />
11.8<br />
Group net profit for <strong>2012</strong> was 62.3 million euro (58.8 million euro), representing 2.2% (2.1%)<br />
of revenue.<br />
0<br />
–10<br />
–15<br />
(10.0)<br />
1Q 2Q 3Q 4Q<br />
2011 <strong>2012</strong><br />
Operating margin %<br />
%<br />
8<br />
6<br />
5.2%<br />
4<br />
2<br />
0<br />
1.8%<br />
3.1%<br />
1.8%<br />
2.6%<br />
2.0%<br />
1.6%<br />
–1<br />
–2<br />
–1.5%<br />
1Q 2Q 3Q 4Q<br />
2011 <strong>2012</strong><br />
11
<strong>Report</strong> on operations at 31 December <strong>2012</strong><br />
Cash flows<br />
(million euro) <strong>2012</strong> 2011<br />
EBITDA 242.6 262.7<br />
Change in NWC 22.6 32.0<br />
Other operating flow (142.1) (176.8)<br />
Operating cash flow 123.0 117.9<br />
Net capex (137.4) (126.3)<br />
Cash flows before financing activities (14.4) (8.4)<br />
Dividends paid and financing transactions (23.7) (31.0)<br />
Free cash flow (38.1) (39.3)<br />
The cash flow 7 generated from operating activities totaled 123.0 million euro (117.9 million<br />
euro). The improvement with respect to 2011 was due to the contribution from other<br />
operating flows.<br />
This outcome benefited from exchange rate movements and the change in the hedging<br />
reserve.<br />
The Free Cash Flow 8 absorbed was 38.1 million euro (39.3 million euro), resulting in an<br />
increase in net financial indebtedness by the same amount since 31 December 2011.<br />
7. The change in net working capital reported in the above cash flow statement includes the change<br />
in trade payables incurred for investment purposes (net of the exchange rate effect), negative<br />
for 4.0 million euro, which is classified as part of the Cash flows from investing activities in the<br />
Consolidated cash flow statement. This latter statement therefore reports different amounts for the<br />
cash flows from operating activities and from investing activities.<br />
8. Free Cash Flow: the cash flow from/absorbed by operating and investing activities, net of dividend<br />
payments and capital increases.<br />
12
<strong>Report</strong> on operations at 31 December <strong>2012</strong><br />
Consolidated statement of financial position 9<br />
(million euro) 31.12.<strong>2012</strong> 31.12.2011<br />
Trade receivables 465.3 440.5<br />
Inventories 331.8 323.2<br />
Trade payables (844.8) (788.8)<br />
Net working capital (47.7) (25.0)<br />
Non-current assets 1,189.2 1,065.5<br />
Other current assets and liabilities and non-current liabilities (249.3) (268.1)<br />
Net invested capital 892.2 772.4<br />
Net financial indebtedness 256.4 218.2<br />
Equity attributable to the owners of the Parent 635.8 554.1<br />
Non-controlling interests 0.0 0.0<br />
Equity and financial liabilities 892.2 772.4<br />
The reduction in net working capital since 31 December 2011 reflects an improvement in<br />
the management of trade payables.<br />
Certain trade receivables (UK and Poland) have been sold without recourse. The amounts<br />
sold but not collected at 31 December <strong>2012</strong> total 30.8 million euro (23.4 million euro for UK)<br />
Net invested capital amounts to 892.2 million euro (772.4 million euro). This increase<br />
mainly reflects the growth in non-current assets, which more than offset the containment of<br />
commitments in Net working capital.<br />
In particular, the rise was partly due to the increase in the UK pension fund surplus (see note<br />
9.5 for further information).<br />
The Group’s ROI (before tax) was slightly below the average for the past 5 years, due to the<br />
higher than average level of net invested capital.<br />
9. The trade receivables and payables, inventories and equity reported in the above reclassified<br />
statement of financial position are the same as the amounts reported in the consolidated<br />
statement of financial position. Net financial indebtedness is analyzed in the following table.<br />
“Non-current assets” and “Other current assets and liabilities and non-current liabilities” comprise<br />
the captions of the consolidated statement of financial position that are not mentioned above or<br />
included as part of net financial indebtedness.<br />
13
<strong>Report</strong> on operations at 31 December <strong>2012</strong><br />
Net invested capital<br />
mEur<br />
1,200<br />
1,000<br />
800<br />
Average<br />
2007-2011<br />
ROI % 19.3% 14.9%<br />
Asset turnover 3.6 3.2<br />
<strong>2012</strong><br />
600<br />
400<br />
200<br />
0<br />
2007 2008 2009 2010 2011 <strong>2012</strong><br />
The Equity attributable to the owners of the Parent has increased by 81.7 million euro since<br />
31 December 2011.<br />
This increase primarily reflects the positive change in the translation reserve, 37.4 million<br />
euro, and the net profit earned by the Group, 62.3 million euro. Consolidated equity was<br />
reduced by the payment of dividends to owners totaling 23.7 million euro.<br />
(million euro) 31.12.<strong>2012</strong> 31.12.2011<br />
Current financial assets 29.4 20.9<br />
Cash and cash equivalents 142.8 234.4<br />
Banks and other financial payables (197.8) (228.7)<br />
Net financial indebtedness position - short term (25.6) 26.6<br />
Medium/long-term financial payables (232.3) (246.3)<br />
Net financial position * (257.9) (219.7)<br />
Other non-current financial assets 1.5 1.5<br />
Net financial indebtedness (256.4) (218.2)<br />
* As defined in CONSOB Communication DEM/6064293 dated 28 July 2006, applying the CESR recommendations<br />
dated 10 February 2005.<br />
Net financial indebtedness has increased by 17.5% since 31 December 2011 to<br />
256.4 million euro.<br />
Gross financial indebtedness totals 430.1 million euro (475.0 million euro), of which 54.0% is<br />
classified as medium/long term (51.9% at 31 December 2011).<br />
14
<strong>Report</strong> on operations at 31 December <strong>2012</strong><br />
Investments<br />
Net investments during the year amounted to 137.4 million euro, or 4.8% of revenue<br />
(128.5 million euro, 4.5% of revenue), of which 101.4 million euro (98.4 million euro) for<br />
property, plant and equipment and 36.1 million euro (30.2 million euro) for intangible<br />
assets.<br />
Net investments are stated after disposals totaling 15.4 million euro (12 million euro), of<br />
which 15.1 million euro reflects non-current assets that have been reclassified as other assets<br />
available for sale.<br />
Gross investment <strong>2012</strong><br />
by destination (mEur & %)<br />
8.0<br />
5%<br />
74.0<br />
49%<br />
12.7<br />
8%<br />
New product<br />
Industrial activities<br />
Information technology<br />
Health and safety<br />
environment and general<br />
services<br />
58.1<br />
38%<br />
Gross investment therefore amounted to 152.8 million euro (140.5 million euro).<br />
The 58.1 million euro invested in new products is analyzed below 10 :<br />
• 35% in the washing sector (20 million euro). The principal projects comprise the<br />
development of a new look for washing machines and the expansion of the washing<br />
machine range at the Lipetzk factory (Russia);<br />
• 15% in the cooking sector (9 million euro);<br />
• 33% in the cooling sector (19 million euro). The principal projects comprise completion<br />
of the new 70 cm platform at the Manisa factory (Turkey), completion of the new built-in<br />
fridge platform at the Carinaro plant (Italy), and addition of the new no-frost range at the<br />
Lipetzk factory (Russia);<br />
• 11% in the dishwasher sector (6 million euro). The principal project relates to the<br />
development of a new platform for 45 and 60 cm dishwashers at the Radomsko factory<br />
(Poland);<br />
• 6% (3 million euro) in the small household appliances sector.<br />
The 74.0 million euro allocated to industrial activities relates to actions taken to expand,<br />
rationalize, maintain and increase the efficiency of the Group’s plant. The principal<br />
investments related to:<br />
• an increase in the productive capacity of the Russian factories (washing and cooling<br />
sectors), 24 million euro;<br />
• the completion of a new factory for the production of cooker hoods in Poland, 14 million<br />
euro (production expected to start during the first quarter of 2013);<br />
• rationalization of the Italian factories pursuant to the business plan discussed with and<br />
approved by the various social partners, 5 million euro;<br />
• improvements and adaption to the “lean production” concept at all Group factories, 3<br />
million euro.<br />
10. The above amounts invested have been rounded to millions of euro.<br />
15
<strong>Report</strong> on operations at 31 December <strong>2012</strong><br />
Other investments, totalling 20.7 million euro, mainly related to:<br />
• Health and Safety work at factories (5 million euro), with particular emphasis on<br />
the improvement of working conditions and the reduction of noise in production<br />
departments, and actions aimed to minimize the potential environmental impact of the<br />
Group’s factories (including the investment of 3 million euro to complete the elimination<br />
of asbestos from the large majority of sites);<br />
• improvement of the Information Technology infrastructure and services (including 8<br />
million euro spent on licences and software);<br />
• other activities of a general nature.<br />
Research and development<br />
activities<br />
Gross investment <strong>2012</strong><br />
(mEur & %)<br />
36.1*<br />
24%<br />
116.8<br />
76%<br />
Innovation is a priority for the Group in order to create value and achieve sustainable<br />
growth. The ability to innovate and develop leading-edge solutions addresses the primary<br />
need to guarantee consumers the best quality lifestyle. Accordingly, <strong>Indesit</strong>’s household<br />
appliances are designed with a focus on the environment, ease of use, ergonomics, flexibility<br />
and appearance.<br />
The process of innovation takes two separate paths that subsequently join together.<br />
On the one hand:<br />
• analysis of consumers; observation of their habits and the challenges faced each day<br />
when using appliances (identifying the directions in which innovation may offer business<br />
potential).<br />
On the other:<br />
• studies, research and development of new technologies that might respond to<br />
consumer needs and create new opportunities for appliance business and operations.<br />
A substantial percentage of total annual investments is dedicated to the research and<br />
development of new products. The number of patents filed is growing at 30% p.a. on<br />
average, due to the efforts made by more than 600 persons active in this area, many of<br />
whom work in Italy.<br />
Investments in tangible assets<br />
Investments in intangible assets<br />
* Of which 26 million euro related to R&D<br />
activities, prototypes and new product<br />
samples.<br />
16
<strong>Report</strong> on operations at 31 December <strong>2012</strong><br />
Financial position of the Parent <strong>Indesit</strong> Company S.p.A.<br />
The schedules presented and discussed below are based on the Parent’s separate financial<br />
statements at 31 December <strong>2012</strong>, to which reference is made, prepared under the IFRS<br />
issued by the International Accounting Standards Board (“IASB”) and endorsed by the<br />
European Union, and in accordance with the enabling regulations for art. 9 of Legislative<br />
Decree no. 38/2005.<br />
Key financial indicators<br />
of the Parent<br />
<strong>Indesit</strong> Company S.p.A. acts as an investment holding company and as an operating<br />
company in Italy, while also supplying goods and services to other Group companies.<br />
The Parent’s income statement reports a profit for the year of 45.9 million euro (10.4 million<br />
euro), up 35.5 million euro.<br />
The principal economic indicators are summarised below:<br />
Income statement key data of the accounting period<br />
(million euro) <strong>2012</strong> 2011 2010<br />
Revenue 1,017.5 1,108.1 1,238.2<br />
Gross operating profit (EBITDA) 27.8 55.7 34.8<br />
Depreciation and amortisation (59.0) (59.3) 69.6<br />
Operating profit (EBIT) (31.2) (3.5) (34.8)<br />
Operating profit (EBIT)/revenue -3.1% -0.3% -2.8%<br />
Profit for the year of Parent 45.9 10.4 55.9<br />
Statement of financial position key data<br />
(million euro) 31.12.<strong>2012</strong> 31.12.2011 31.12.2010<br />
Net working capital 117.0 113.5 95.2<br />
Non-current assets 952.9 790.5 786.6<br />
Non-current liabilities 305.6 320.7 278.3<br />
Equity 509.3 487.7 512.5<br />
Net financial indebtedness 417.7 232.9 149.4<br />
Net financial indebtedness/Equity 82.0% 47.8% 29.2%<br />
Cash flows<br />
(million euro) 31.12.<strong>2012</strong> 31.12.2011 31.12.2010<br />
Operating cash flow 3.2 (25.5) 203.2<br />
Cash flows from(for) investing activities (163.6) (51.5) (86.5)<br />
Cash flows from(for) financing activities 161.4 77.6 (116.6)<br />
Revenue was 8.2% lower following a 10.7% decrease in revenue from third parties and a<br />
6.3% reduction in intercompany revenue.<br />
17
<strong>Report</strong> on operations at 31 December <strong>2012</strong><br />
Gross operating profit (EBITDA) amounted to 27.8 million euro (55.7 million euro),<br />
representing 2.7% (5.0%) of revenue. The reduction was due to the negative trend in<br />
demand and additional non-recurring charges recognised during the year. Before<br />
non-recurring items, EBITDA was 43.2 million euro (59.1 million euro). As a percentage of<br />
revenue: 4.1% (5.3%).<br />
The operating loss (EBIT) was 31.2 million euro (3.5 million euro), representing -3.1% of<br />
revenue (-0.3%).<br />
Net financial income was 76.9 million euro (30.7 million euro). The change mainly reflects<br />
an increase in dividends received, net of impairment losses on equity investments of<br />
100.0 million euro (51.0 million euro).<br />
Profit before taxation (PBT) was 45.7 million euro (27.2 million euro), representing 4.5%<br />
(2.5%) of revenue. The tax income amounted to 0.2 million euro (accruals totaling<br />
16.7 million euro).<br />
Cash flows 11<br />
(million euro) <strong>2012</strong> 2011<br />
EBITDA 27.8 55.7<br />
Change in NWC (3.5) (18.2)<br />
Other operating cash flows (29.2) (53.3)<br />
Operating cash flow (4.9) (15.8)<br />
Investments net of proceeds from the disposal of property, plant and<br />
(50.9) (58.5)<br />
equipment and intangible assets<br />
Cash flows before financing activities (55.8) (74.3)<br />
Investments net of proceeds from the disposal of financial assets (109.0) (2.8)<br />
Dividend received/paid and other changes in equity 84.9 (6.5)<br />
Free cash flow (79.8) (83.6)<br />
Operating cash flow, lower than the 2011, was negative for 4.9 million euro (negative for<br />
15.8 million euro). 11<br />
Dividends received/paid and other changes in equity increases reflect dividends received<br />
net of those paid, together with changes in the hedging reserve.<br />
Free Cash Flow 12 reflects the use of 79.8 million euro (83.6 million euro).<br />
11. The change in net working capital reported in the above cash flow statement includes the decrease<br />
in trade payables incurred for investment purposes, 3.7 million euro (9.7 million euro), which is<br />
classified as part of the Cash flows from investing activities in the separate cash flow statement. This<br />
latter statement therefore reports different amounts for the cash flows for operating activities and<br />
for other operating cash flows.<br />
12. Free Cash Flow: cash flows for operating activities and investing activities, net of dividends collected/paid, the<br />
hedging reserve and share capital increases.<br />
18
<strong>Report</strong> on operations at 31 December <strong>2012</strong><br />
Summary of the financial<br />
position of the Parent<br />
The financial position of the Parent is summarized in the following table:<br />
(million euro) <strong>2012</strong> 2011<br />
Trade receivables 418.3 406.0<br />
Inventories 90.3 107.6<br />
Trade payables (391.6) (400.2)<br />
Net working capital 117.0 113.5<br />
Non-current operating assets 952.5 740.5<br />
Other current assets and liabilities and non-current liabilities (142.4) (133.4)<br />
Net invested capital 927.1 720.6<br />
Net financial indebtedness 417.7 232.9<br />
Equity 509.3 487.7<br />
Equity and financial liabilities 927.1 720.6<br />
Net financial indebtedness amounts to 417.7 million euro (232.9 million euro).<br />
Equity amounts to 509.3 million euro (487.7 million euro), up 21.6 million euro.<br />
The payment of dividends totaling 23.7 million euro and a reduction in the hedging reserve<br />
for 0.5 million euro partially offset the profit for the year of 45.9 million euro.<br />
Reconciliation between equity<br />
and profit for the year of the<br />
Parent<br />
In accordance with Consob regulations 13 the equity and profit for the year of the Parent are<br />
reconciled below with the related consolidated amounts:<br />
31.12.<strong>2012</strong> 31.12.2011<br />
(million euro) Profit (Loss) Equity Profit (Loss) Equity<br />
Financial statements of the Parent<br />
Company 45.9 509.3 10.4 487.7<br />
Consolidation adjustments<br />
Difference between carrying amount and<br />
equity of Group companies 293.8 137.2 171.4 76.4<br />
Dividends received from subsidiaries (275.6) - (123.0) -<br />
Effect of aligning separate financial<br />
statements with Group accounting<br />
policies 0.2 2.9 (0.2) 4.1<br />
Elimination of intercompany profits (0.8) (12.5) 0.4 (14.2)<br />
Tax and other effects (1.3) (1.1) (0.2) 0.2<br />
Total consolidation adjustments 16.3 126.5 48.4 66.5<br />
Consolidated financial statements 62.3 635.8 58.8 554.2<br />
13. Consob Communication DEM/6064293 dated 28 July 2006<br />
19
<strong>Report</strong> on operations at 31 December <strong>2012</strong><br />
Corporate governance and ownership structure<br />
The Corporate Governance structure adopted by <strong>Indesit</strong> Company S.p.A. is essentially<br />
consistent with the principles established in the Code of Conduct for Listed Companies<br />
(the Code) and with international best practice. On 21 March 2013, the Board of Directors<br />
approved the <strong>2012</strong> <strong>Annual</strong> report on corporate governance and the ownership structure,<br />
prepared pursuant to art. 123-bis of the consolidated law on financial intermediation (TUIF).<br />
This report is published on the Company’s website in the “Company” section, sub-section<br />
“Governance” 14 . Reference is made to this report for the disclosures required by law.<br />
<strong>Indesit</strong> Company S.p.A. has adopted the ordinary model of administration and control<br />
(envisaged under Italian law), with the presence of a Shareholders’ Meeting, a Board of<br />
Directors, a Board of Statutory Auditors and Independent Auditors. The company bodies<br />
are appointed at the Shareholders’ Meeting and remain in office for a period of three<br />
years. The significant presence of Independent Directors, as defined in the Code, and the<br />
important role they play on both the Board and Board Committees (Human Resources<br />
Committee, Internal Audit Committee, Strategic Development Committee and Related-party<br />
transactions Committee), ensures that the interests of all shareholders are appropriately<br />
balanced and guarantees a high level of discussion at the Board of Directors meetings.<br />
During the meetings held in February <strong>2012</strong>, the Board of Directors acted on a<br />
recommendation of the Remuneration Committee and approved a Remuneration<br />
Policy. This was consistent with the provisions of the Code and the regulations issued by<br />
Consob. Pursuant to current legislation, the Remuneration Policy is the first section in the<br />
Remuneration <strong>Report</strong> and will be presented for examination at the Shareholders’ Meeting<br />
called to approve the <strong>2012</strong> <strong>Annual</strong> <strong>Report</strong>. In addition, with support from the relevant<br />
committees, the Board of Directors analyzed the principles and criteria that were revised or<br />
updated in the latest edition of the Code, having regard for the way they are implemented<br />
by the Group.<br />
14. At the address www.indesitcompany.com/inst/en/vision/corporate_governance/cGHome.action.<br />
20
<strong>Report</strong> on operations at 31 December <strong>2012</strong><br />
Intercompany and related<br />
party transactions, and<br />
significant, non-recurring,<br />
atypical or unusual<br />
transactions<br />
Transactions between Group companies are settled on an arms’ length basis, having regard<br />
for the quality of the goods and services provided. Note 12 to the consolidated financial<br />
statements describes the nature of the principal transactions arranged by the Parent and<br />
other Group companies with related parties. This note also contains the detailed information<br />
required by Consob regulations and IAS 24. In accordance with Consob regulations 15 ,<br />
Attachments 3 and 4 to the consolidated financial statements and Attachments 2 and 3<br />
to the separate financial statements present both the income statement with separate<br />
indication of non-recurring items and transactions with related parties, together with<br />
the related percentage incidence, and the statement of financial position with separate<br />
indication of transactions with related parties and the related percentage incidence.<br />
The Group’s intercompany transfer prices are determined using the cost-plus method,<br />
which envisages the application of a mark up on production cost. The fairness of such<br />
transfer prices is checked by applying the Transactional Net Margin Method (TNMM), as<br />
required by the regulations, normal practice in Italy and the OECD Guidelines (or Directives).<br />
Transactions with related parties are not significant to the financial position of the Group.<br />
There were no atypical or unusual transactions during <strong>2012</strong>.<br />
Further information on the procedures adopted by the Group with regard to significant and<br />
related party transactions can be found in the <strong>2012</strong> <strong>Annual</strong> <strong>Report</strong> on corporate governance<br />
and the ownership structure, prepared pursuant to art. 123-bis of the TUIF and approved on<br />
21 March 2013.<br />
Information on the investments held by directors, statutory auditors, general managers<br />
and executives with strategic responsibilities, and on the remuneration paid to directors,<br />
statutory auditors, general managers and executives with strategic responsibilities, is<br />
presented in the Remuneration <strong>Report</strong>.<br />
15. Consob Decision 15519 dated 27 July 2006 and Consob Communication DEM/6064293 dated<br />
28 July 2006.<br />
21
<strong>Report</strong> on operations at 31 December <strong>2012</strong><br />
Information on Company<br />
bodies<br />
Board of Directors<br />
Chairman<br />
Chief Executive Officer and General Director<br />
Directors<br />
Honorary Chairman<br />
Board of Statutory Auditors<br />
Chairman<br />
Auditors<br />
Alternate Auditors<br />
Human Resources and Remuneration Committee<br />
Internal Audit Committee<br />
Related-party transactions Committee<br />
Strategic Development Committee<br />
Representative of the savings shareholders<br />
Independent Auditors<br />
Manager charged with preparing the Company’s<br />
financial reports<br />
Andrea Merloni<br />
Marco Milani<br />
Valerio Battista<br />
Francesco Caio<br />
Innocenzo Cipolletta<br />
Paolo De Cesare<br />
Mario Greco<br />
Antonella Merloni<br />
Aristide Merloni<br />
Maria Paola Merloni<br />
Paolo Monferino<br />
Vittorio Merloni<br />
Marco Reboa<br />
Andrea Amaduzzi<br />
Luigi Biscozzi<br />
Michele Casò<br />
Francesco Nobili<br />
Mario Greco (Chairman)<br />
Maria Paola Merloni<br />
Paolo Monferino<br />
Innocenzo Cipolletta (Chairman)<br />
Francesco Caio<br />
Antonella Merloni<br />
Paolo Monferino (Chairman)<br />
Valerio Battista<br />
Paolo De Cesare<br />
Andrea Merloni (Chairman)<br />
Francesco Caio<br />
Marco Milani<br />
Paolo Monferino<br />
Adriano Gandola<br />
KPMG S.p.A.<br />
Stefano Cavacini<br />
22
<strong>Report</strong> on operations at 31 December <strong>2012</strong><br />
Stock option plans<br />
No new plans were authorized during <strong>2012</strong> and no stock options were granted, while<br />
105,000 stock options expired. The stock option plans are described in the explanatory<br />
notes to the consolidated financial statements, which discuss the plans and provide the<br />
information required by law and the relevant Consob communications.<br />
Treasury shares and shares<br />
of the Parent<br />
<strong>Indesit</strong> Company S.p.A. did not purchase or sell any treasury shares or shares of its Parent<br />
during the year, whether directly or via third parties. Information on the treasury shares held<br />
by the Parent is provided in the explanatory notes to the separate financial statements.<br />
Information about significant<br />
non-EU companies<br />
<strong>Indesit</strong> Company S.p.A. controls, directly or indirectly, 5 companies established under and<br />
governed by the laws of countries that are not members of the European Union (“Significant<br />
non-EU Companies”, as defined by Consob regulations 16 ).<br />
With regard to these companies:<br />
• all Significant non-EU Companies prepare reporting packages for the purpose of<br />
preparing the consolidated financial statements;<br />
• the statements of financial position and income statements of such companies are<br />
made available to the owners of <strong>Indesit</strong> Company S.p.A. on the basis and with the timing<br />
envisaged in the related regulations;<br />
• <strong>Indesit</strong> has obtained the articles of association and information about the membership<br />
and powers of the governing bodies of the significant non-EU companies;<br />
• the significant non-EU companies:<br />
• provide the Parent’s audit company with the information needed in order to audit<br />
the annual and interim financial statements of the Parent;<br />
• apply an administrative-accounting system capable of providing the regular<br />
economic and financial information needed by <strong>Indesit</strong>’s management and<br />
independent auditors in order to prepare the consolidated financial statements.<br />
In order to comply with its obligations under current regulations, the control body of <strong>Indesit</strong><br />
Company S.p.A. has checked that these administrative-accounting systems are capable of<br />
regularly providing the economic and financial information needed by management and<br />
the independent auditors of <strong>Indesit</strong> Company S.p.A. for the preparation of the consolidated<br />
financial statements, and that such information flows do actually occur through meetings<br />
with both that company’s independent auditors and the management and local<br />
independent auditors of the significant non-EU companies.<br />
16. Resolution no. 16191 dated 29 October 2007 and subsequent amendments, in relation to the listing of Parent<br />
companies with non-EU subsidiaries. These companies are Closed Joint Stock Company <strong>Indesit</strong> International,<br />
<strong>Indesit</strong> Company International Business S.A., <strong>Indesit</strong> Rus Llc, <strong>Indesit</strong> Company Beyaz Esya Pazarlama A.S. and<br />
<strong>Indesit</strong> Company Beyaz Esya Sanayi ve Ticaret A.S.<br />
23
<strong>Report</strong> on operations at 31 December <strong>2012</strong><br />
Information about employees<br />
Composition of the work force<br />
The number of employees at 31 December <strong>2012</strong>, 16,331, is 219 units more than at the end<br />
of last year.<br />
Employment is analysed as follows: 72% factory workers, 27% clerical employees and 1%<br />
executives and foreign equivalents.<br />
In geographical terms, 27% of employees are based in Italy, 29% in the Russian Federation,<br />
19% in Poland, 15% in the UK and Ireland, 6% in Turkey and the remaining 4% in other<br />
Group locations.<br />
In organisational terms, 67% are employed in the Industrial area, 14% in Sales; 11% in<br />
the Service area, 4% in the Home Care and Food Treatment divisions, and 4% in Support<br />
functions.<br />
34% of employees are female.<br />
Training, organisation<br />
and remuneration policies<br />
Training for recruits and the development of personnel (In <strong>Indesit</strong> Induction, In Tune, In<br />
Spire and In Action and Minimaster) carried out a total of 303 participants during <strong>2012</strong>. The<br />
catalog of training at Group level addresses the areas for improvement identified through<br />
performance assessments. Such training involved 1,428 participants.<br />
A further 479 persons attended training in support of the Group’s medium-term<br />
development plans. 13,753 participiants attended technical courses, training on safety at<br />
work, quality etc.<br />
A total of 20,755 participiants benefited from training in <strong>2012</strong>.<br />
Remuneration policies are designed to support the organisational development of the<br />
Group. In all areas, the pay rises granted during <strong>2012</strong> reflected conditions in the reference<br />
job markets, inflation trends and any applicable local agreements. Further information is<br />
provided in the Remuneration <strong>Report</strong>.<br />
Safety at work<br />
<strong>Indesit</strong> Company safeguards the health and safety of its employees in compliance with<br />
the regulations in force in each country and the ILO (International Labour Organisation)<br />
guidelines on health and safety at work. An international standard for managing the<br />
health and safety of workers has been adopted in order to guarantee the attainment of<br />
these objectives (OHSAS - Occupational Health and Safety Assessment Series). Almost<br />
every Group site and the related employees obtained certification under OHSAS 18001<br />
during 2011. As a consequence, exceptional results were achieved in <strong>2012</strong> in terms of<br />
reducing the number and seriousness of accidents. Effective involvement at each level<br />
of the organisation has increased the number of near-miss situations that have been<br />
identified, thus boosting prevention-related activities. A program has been implemented<br />
to improve the ergonomics of workstations, with special reference to repetitive<br />
movements and the manual handling of loads. Particular attention has also been given to<br />
improving the comfort of the working environment, with a series of projects relating to<br />
heating and humidity, lighting and noise.<br />
24
<strong>Report</strong> on operations at 31 December <strong>2012</strong><br />
Privacy<br />
The “Data Protection Document” required by Legislative Decree 196 dated 30 June 2003<br />
(Privacy Code) has been updated at the date of this report.<br />
Performance of subsidiaries<br />
All subsidiaries of <strong>Indesit</strong> Company S.p.A. operate in the production and sale of household<br />
appliances or, in any case, carry out related activities. <strong>Indesit</strong> Company manages its<br />
companies (listed in Attachments 1 and 2 of the explanatory notes to the consolidated<br />
financial statements) with reference to the geographical area of operation. Consequently,<br />
reference is made to the information on operating segments contained in the explanatory<br />
notes to the consolidated financial statements for further details about the geographical<br />
areas and, in general, to the information provided in the consolidated financial statements<br />
about the principal events involving subsidiaries.<br />
Management and coordination<br />
activities<br />
<strong>Indesit</strong> Company S.p.A. is not subject to management or coordination by other companies<br />
or bodies, and determines its general and operational strategic guidelines on a fully<br />
autonomous basis. Pursuant to art. 2497-bis of the Italian Civil Code, the Italian subsidiaries<br />
under direct or indirect control have, with specific exceptions, identified <strong>Indesit</strong> Company<br />
S.p.A. as the party that manages and coordinates their activities. This activity consists in<br />
communicating the Group’s general and operational strategic guidelines and involves<br />
determining and improving the system of internal control, the model of corporate<br />
governance and the corporate structure, issuing a Code of Conduct adopted at Group level,<br />
and preparing general policies for the management of human and financial resources,<br />
the procurement of production, facilities and materials marketing and communications.<br />
Although subsidiaries maintain their operational and managerial autonomy, the above<br />
enables them to achieve economies of scale via recourse to professional skills and specialist<br />
services of ever-increasing quality, so that they can concentrate their resources on the<br />
management of their core businesses.<br />
Principal risks and uncertainties faced by the Group and the Parent<br />
The <strong>Indesit</strong> Group is exposed to a series of risks, which can be grouped in the following<br />
three macro-categories:<br />
• strategic and operational;<br />
• financial;<br />
• legal and compliance.<br />
<strong>Indesit</strong> Company S.p.A., as the Parent, is essentially exposed - directly or indirectly - to<br />
the same risks and uncertainties as those described below in relation to the Group. The<br />
risk factors most directly affecting activities in <strong>2012</strong> are discussed in the section entitled<br />
“Outlook”.<br />
25
<strong>Report</strong> on operations at 31 December <strong>2012</strong><br />
Strategic and operational risks<br />
Demand trends: the household appliances sector is part of the broader category of<br />
Consumer Durables and business is cyclical. Contractions in the property market, in<br />
consumer confidence, in the availability of consumer credit and, more generally, in the<br />
GDP growth rate have a rapid effect on the level of market demand and may result in lower<br />
sales and, consequently, in lower profits. Depending on the availability of data, each month<br />
or each quarter, <strong>Indesit</strong> monitors the trends in industry shipments, retail sales (sell out),<br />
retail prices, market share in volume/value terms, and other relevant parameters, making<br />
reference to data for the Group’s largest markets supplied by the principal independent<br />
research institutions. Analysis of this information allows the Group to react to current or<br />
expected changes within the shortest possible period of time. In addition to the lower sales<br />
and profits already mentioned, significant unexpected contractions in demand often lower<br />
the level of plant saturation which, at least in the short term, may have further adverse<br />
effects on profitability, the level of finished product inventories and borrowing.<br />
Predictability of demand: <strong>Indesit</strong> mainly distributes its products via chain retailers,<br />
wholesalers and the manufacturers of fitted kitchens. The order backlog is typically at one<br />
month. The visibility of demand beyond a one/three month planning horizon is therefore<br />
somewhat limited, and is largely based on statistical analysis. Conversely, industrial planning<br />
requires the adoption of a medium-term time horizon, especially when significant changes<br />
in production are required. In addition to the actions described in the previous point,<br />
<strong>Indesit</strong> minimises this risk by managing the level of finished product inventories in order<br />
to maintain a predetermined safety margin, compatible with the requirements of prudent<br />
financial management. Work has also commenced on a number of projects designed to<br />
further refine the mathematical models used to generate sales forecasts and the related<br />
production plans.<br />
Price competition: the household appliances sector, still highly fragmented in Europe,<br />
may be affected at particular moments in the economic cycle by strong price competition<br />
designed to capture market share or, in the short term, to boost the volume of sales and,<br />
therefore, production. Price pressures result in lower profit margins. At the same time,<br />
excessive fragmentation, structural excess capacity and the high elasticity of volume in<br />
response to changes in price, make it both difficult and risky to fully pass on sudden and/<br />
or significant increases in the cost of raw materials in the form of higher selling prices.<br />
<strong>Indesit</strong> mitigates this risk by ensuring a constant flow of new products that help to offset<br />
the deflationary pressures, while also guaranteeing a cost base that is among the most<br />
competitive in the sector.<br />
Exposure to the prices of raw materials and components: the Group is directly or indirectly<br />
(via the purchase of components) exposed to the risk of increases in the prices of raw<br />
materials: principally steel, plastics, copper, nickel and aluminum. In <strong>2012</strong>, the Group’s costs<br />
for the consumption of raw materials, components and consumables totaled 1,657.6 million<br />
euro, including 229.0 million euro for steel and aluminum, 261.3 million euro for plastics,<br />
1,067.8 million euro for components and outsourced production, and 99.4 million euro for<br />
other materials.<br />
26
<strong>Report</strong> on operations at 31 December <strong>2012</strong><br />
Exposure to the prices of raw<br />
materials and components<br />
6%<br />
14%<br />
Normally, with regard to the purchase of steel, the Group’s objective is to sign annual<br />
contracts at fixed prices for the materials requirement estimated when preparing the<br />
budget for the following year. The 2013 objective of signing annual contracts at fixed<br />
prices with all steel vendors in the European market (including Service Centers and<br />
Steelworks) and to the Turkish market was achieved at the end of <strong>2012</strong>. For the Russian<br />
market, prices will again be fixed quarterly during 2013 due, in part, to normal contractual<br />
practice there; accordingly, the steel price for just the first quarter of 2013 was fixed at the<br />
end of <strong>2012</strong>.<br />
For non-ferrous metals (nickel, copper and aluminum), the supply agreements for 2013 are<br />
partly annual and partly six-monthly (nevertheless with the fixing of prices), depending on<br />
the strategies agreed with the various vendors.<br />
64%<br />
Plastic<br />
Components and transformation<br />
Steel & aluminium<br />
Other<br />
16%<br />
Lastly with regard to plastics, as usual the Group has signed fixed price contracts for 2013<br />
covering about 30% of its requirement, while the prices for the remaining 70% are indexed<br />
to sector parameters. The duration of these supply contracts is either quarterly or halfyearly,<br />
depending on the negotiating strategies established with the vendors of the various<br />
commodities.<br />
Country risk: a significant and growing part of the Group’s production and sales activities<br />
takes place outside of the OECD. The Group is exposed to the risks associated with operating<br />
in countries that may not be as politically and economically stable as those in the OECD<br />
area. Such risks might include:<br />
• restrictive policies on the import of components and/or the export of finished<br />
products;<br />
• limitations on investment/divestments by non-resident parties;<br />
• the convertibility and/or transferability of the local currency;<br />
• the introduction of restrictive laws and/or regulations, including the risks of<br />
nationalisation or expropriation.<br />
Other operating risks: this category comprises the risks typically faced by the durable goods<br />
sector: risk of product obsolescence, risks associated with the warranties given on products<br />
sold, risks associated with the disposal of waste electrical and electronic products. These risks<br />
are managed and measured by the Group and their coverage is reflected in the captions<br />
of the consolidated statement of financial position relating to inventories (provisions for<br />
obsolescence) and the provisions for risks and charges (provisions for product warranties<br />
and for the disposal of waste products). See the explanatory notes to the consolidated<br />
financial statements for further information about the provisions and writedowns<br />
recognised in <strong>2012</strong>.<br />
Financial risks<br />
The principal financial risks faced by the Group are: liquidity risk; market risk (currency<br />
risk, interest rate risk, commodity price risk) and credit risk. Financial risks are managed in<br />
accordance with the Treasury Policy approved by the Board of Directors, except for the<br />
credit risk in relation to commercial counterparts.<br />
Liquidity risk: the Group defines liquidity risk as the risk that a Group company, or the Group<br />
as a whole, may be unable to meet its obligations on a timely basis. The containment of this<br />
risk is pursued via actions aimed to guarantee a balanced capital structure, diversification<br />
27
<strong>Report</strong> on operations at 31 December <strong>2012</strong><br />
of the sources of finance, the spreading of debt maturities over a broad time horizon, the<br />
maintenance of undrawn committed lines of credit, and defined limits for maturities and<br />
counterpart credit in the management of liquidity. The Group believes that the lines of credit<br />
and investments available at 31 December <strong>2012</strong> are sufficient to cover the requirements<br />
arising from operations, capital expenditure and the repayment of borrowing upon maturity.<br />
Currency risk: the Group’s economic and financial results and equity are influenced by<br />
changes in the rates of exchange for foreign currencies (especially the British pound,<br />
the Russian ruble, the Polish zloty and the Turkish lira). The Group identifies three types<br />
of risk: competitive risk, economic risk and translation risk. Currency risk is managed in<br />
accordance with the guidelines established in the Treasury policy which forbids, inter alia,<br />
the acceptance of risk positions that are not strictly correlated with the Group’s operating<br />
activities.<br />
Interest rate risk: the risk that adverse movements in the interest rate curve might have<br />
an adverse effect on the cost of borrowing. This risk is managed in accordance with the<br />
guidelines of the Treasury policy. As a policy, the Group prefers borrowing at floating rates,<br />
limiting the conversion from floating rate to fixed rate within the notional, maturity and<br />
market limits defined in the policy.<br />
Credit risk: this represents the Group’s exposure to potential losses deriving from the failure<br />
of financial and commercial counterparts to meet their obligations. The guidelines for the<br />
management of financial counterpart risk are set out in the Treasury policy.<br />
Further details about the management of financial risk are provided in note 10 to the<br />
consolidated financial statements.<br />
Legal and compliance risks<br />
The Group defines compliance risk as the possibility of incurring court and/or administrative<br />
penalties, financial losses or loss of reputation as a consequence of failure to comply with<br />
compulsory rules (laws or regulations), or self-imposed rules (articles of association, codes of<br />
conduct and codes of self regulation). The principal risks of this type may be grouped into<br />
the categories described below.<br />
General risks associated with changes in the regulatory environment: the Group is<br />
subject to numerous national and international laws and regulations, including tax rules, in<br />
the various countries of operation. This represents a complex reference framework that is<br />
constantly evolving.<br />
The Group monitors changes in the applicable regulations and their proper application<br />
via its own legal and tax professionals, working within the principal Group companies,<br />
and by recourse to leading external consultants of international standing. The control<br />
bodies described in the <strong>Report</strong> on corporate governance and the ownership structure also<br />
contribute to this process.<br />
Despite this, there is no certainty that the Group will not become involved in future disputes<br />
and face possibly significant liabilities, given the large number of jurisdictions involved, the<br />
range of topics addressed, the rapidity of change, and the often subjective nature of matters<br />
open to interpretation or valuation.<br />
28
<strong>Report</strong> on operations at 31 December <strong>2012</strong><br />
Risks relating to compliance with environmental regulations: the products and activities<br />
of the <strong>Indesit</strong> Group are subject to many environmental rules and regulations. This<br />
regulatory framework is subject to restrictive revision in the countries where the Group<br />
operates, often as a consequence of new directives issued by supranational entities,<br />
including the European Union. The regulations may relate to products, with more severe<br />
rules for the disposal of waste and energy consumption, or to factories, with rules about<br />
atmospheric emissions, the disposal of waste materials and water, and the cleaning up of<br />
land.<br />
The principal regulations of this type, specific to the sector, include the WEEE (Waste<br />
Electrical and Electronic Equipment) Directive which makes manufacturers responsible at a<br />
European level for the recovery and disposal of waste products. In Italy, a Decree approved<br />
during 2010 finally established how to implement individual responsibility in practice,<br />
by allowing manufacturers to comply with their WEEE obligations by registering with a<br />
collective system.<br />
In the EU and Turkey, refrigerators must be classified as class A+ or better as from 1 July<br />
<strong>2012</strong>, while the washing machine and dishwasher cycles whose consumption is reported on<br />
the related energy labels must be identified as their “standard” cycles as from 1 December<br />
<strong>2012</strong>. For these categories, the labeling of Group products placed on the European market<br />
has complied with the new regulations from the time they came into effect.<br />
In terms of environmental policy, <strong>Indesit</strong> Company supports actions and projects that<br />
respect the environment and meet the requirements of stakeholders. Respect for and<br />
compliance with environmental regulations are monitored and evaluated periodically,<br />
considering also the principles of the Group’s own environmental policy based on<br />
sustainable development and respect for the environment as strategic success factors in the<br />
competitive arena.<br />
The two categories of risk described above, whether real or considered probable at 31<br />
December <strong>2012</strong>, have been assessed appropriately and their impact has been reflected in<br />
the accounts. See the explanatory notes to the consolidated financial statements (9.23) and<br />
the separate financial statements (6.31) for further information.<br />
Significant events during the year and subsequent to year end<br />
In October, following the discussions with social partners that began several months earlier,<br />
the Group signed an agreement at the Ministry for Economic Development that has resulted<br />
in the shutdown of production at the None factory, in the province of Turin, Italy.<br />
This agreement confirms the continuation of R&D activities at None and the promotion of<br />
efforts to find work for redundant personnel and reindustrialize the site (as already achieved<br />
at Brembate and Refrontolo). An application has been filed for special government-assisted<br />
layoffs (CIGS) covering all former factory workers at None for 24 months. In addition, with a<br />
view to facilitating the management of redundant personnel, the Group has also confirmed<br />
its willingness, within 12 months of the start of the CIGS procedure, to establish a logistics<br />
hub and after-sales service center there.<br />
29
<strong>Report</strong> on operations at 31 December <strong>2012</strong><br />
Production activities ceased during December <strong>2012</strong>.<br />
In October <strong>2012</strong>, the Company informed the members of the UK defined-benefit pension<br />
scheme (DB Scheme) about the decision to change the inflation parameter used to revalue<br />
their pensions, moving from the RPI (retail price index) to the CPI (consumer price index)<br />
inflation index. The two inflation indices have historically given different results, with the RPI<br />
being higher than the CPI.<br />
The communication to persons with current and deferred pensions took immediate effect,<br />
while a consultation period of 60 days was established for active members.<br />
The consultation ended in December <strong>2012</strong> and the change in the revaluation criteria was<br />
implemented. This modification reduced the DB Scheme’s deficit and resulted in a credit in<br />
profit or loss of about 44.0 million euro, reflecting the change in past service benefit, due to<br />
the change of the constructive obligation to fund members, occurred during <strong>2012</strong>.<br />
From 1 January 2013, the Group will adopt the new version of IAS 19 with retrospective<br />
effect.<br />
This standard prevents use of the corridor method currently applied by the Group (see the<br />
basis of consolidation and accounting policies described in note 4.1 in the consolidated<br />
financial statements ).<br />
It also requires application of the same discount rate to the net assets and liabilities of the<br />
pension fund when calculating net interest expense (income), thus eliminating use of the<br />
expected return on the assets servicing the plan.<br />
Starting from 2013, the changes in the pension fund relating to service costs and net interest<br />
(e.g. curtailment) will be reflected in profit or loss, while the changes due to remeasurement<br />
(e.g. changes in actuarial assumptions) will be reported in the statement of comprehensive<br />
income.<br />
The Group will include actuarial gains (losses) in the effects of remeasuring the net assets<br />
and liabilities of the pension funds. The effect of such recognition will be to increase the<br />
liability associated with the pension fund by about 39.7 million euro, decrease the noncurrent<br />
assets relating to the surplus by about 63.3 million euro and reduce the deferred tax<br />
liability by about 23.9 million euro. Consequently, consolidated equity will decline by about<br />
79.0 million euro (retrospective application of the standard).<br />
The introduction of the net interest calculation and elimination of the amortisation of the<br />
corridor difference will reduce profit for the year by 0.6 million euro (net of tax effect).<br />
30
<strong>Report</strong> on operations at 31 December <strong>2012</strong><br />
The following schedule summarises the reclassifications expected as a result of adopting<br />
IAS 19 Revised:<br />
IAS 19<br />
IAS 19 Revised<br />
Income statement <strong>2012</strong><br />
<strong>2012</strong><br />
Revised Note<br />
EBIT 132.6 135.8 Elimination of amortization<br />
on the excess corridor<br />
Financial expenses (30.4) (34.3) Effect of the net interest<br />
calculation<br />
Income taxes (40.0) (39.8)<br />
Net profit 62.3 61.7<br />
IAS 19<br />
IAS 19 Revised<br />
Balance sheet 31.12.<strong>2012</strong><br />
31.12.<strong>2012</strong><br />
Revised Note<br />
Non-current assets 1,190.8 1,136.8<br />
Of which:<br />
- Other non-current assets 92.0 28.7 Elimination of surplus pension<br />
fund<br />
- Deferred tax assets 77.7 87.0<br />
Non-current liabilities 407.1 432.2<br />
Of which:<br />
- Liabilities for employee benefits 44.7 84.4 Elimination of corridor<br />
- Deferred tax liabilities 50.2 35.5<br />
IAS 19<br />
IAS 19 Revised<br />
Equity 31.12.<strong>2012</strong><br />
31.12.<strong>2012</strong><br />
Revised Note<br />
Group shareholders' equity 635.8 556.8<br />
Of which:<br />
- Reserve of remeasurement 0.0 (78.5) Elimination of corridor and<br />
introduction of net interest<br />
- Translation reserve (97.7) (97.7)<br />
- Net profit 62.3 61.7<br />
In addition to the above, there were no additional significant events subsequent to year end.<br />
31
<strong>Report</strong> on operations at 31 December <strong>2012</strong><br />
Outlook<br />
The Group expects demand from distributors (Industry Shipments) in Greater Europe to be<br />
stable at <strong>2012</strong> levels during 2013.<br />
Trends are expected negative in Italy and France.<br />
In <strong>2012</strong> an improvement is expected in Eastern Europe, particularly in Turkey, Russia and UK.<br />
Retail prices should be similar to those in <strong>2012</strong>.<br />
The harsh macroeconomic environment shows no signs of improvement in the near future.<br />
Accordingly, in 2013 the Group will continue to implement the various actions envisaged<br />
in its long-term strategic plans. These are designed to maintain financial solidity and<br />
profitability over the medium and long term.<br />
In particular, we note the following items::<br />
• manufacturing costs should fall slightly, to transfer production and operating efficiencies;<br />
• moderate increase in sourcing costs for the continuing pressure on prices of plastics;<br />
• the launch, during the second quarter of 2013, of a new range of small household<br />
appliances under the Hotpoint brand should help to improve percentage profitability,<br />
albeit only to a small extent;<br />
Significant risks and uncertainties in 2013<br />
Considering the elements mentioned above, it is also necessary to note a number of<br />
specific risks and uncertainties that, during 2013, might generate adverse effects and have a<br />
significant impact on the Group’s economic and financial results.<br />
In particular:<br />
• depreciation of the British pound, the Turkish lira and/or the Russian ruble against the<br />
euro, if this exceeds the averages recognised during the final quarter of <strong>2012</strong> and built<br />
into the budget for 2013. The effect would be to erode revenue and, holding costs<br />
constant, operating profit;<br />
• a change in the prices of raw materials, beyond the estimates currently made, could<br />
adversely affect the costs of production;<br />
• lower demand in Western Europe might not be sufficiently offset by higher volumes in<br />
Russia, Turkey and Ukraine;<br />
• increased competitive pressure, fueled by fragmentation and the perpetuation of excess<br />
production capacity, might place additional downward pressure on current price levels.<br />
32
<strong>Report</strong> on operations at 31 December <strong>2012</strong><br />
Proposed allocation of profit for the year<br />
Shareholders,<br />
the Parent’s separate financial statements at 31 December <strong>2012</strong> report a profit for the year of<br />
45,929,359 euro.<br />
The Parent is not required to allocate any profit for the year to the legal reserve since such<br />
reserve already exceeds 1/5 of share capital.<br />
At the date of this report, the share capital is 102,759,269.40 euro with 114,176,966 shares<br />
outstanding with nominal value of 0,90 euro, of which:<br />
• 113,665,684 ordinary shares with one vote right for each in the shareholders’ meeting;<br />
• 511,282 savings shares without voting right.<br />
This number might increase prior to the shareholders’ meeting, pursuant to the stock<br />
options plan, due to the possible exercise of 147,000 options granted to Group executives<br />
and managers, with the resulting issue of the same number of ordinary shares.<br />
The Board of Directors therefore proposes the declaration of a dividend of 0.20 euro per<br />
ordinary share outstanding and 0.218 euro per savings share outstanding, used for this<br />
purpose, the operating profit of the year up to a maximum of 20,704,688.92 euro.<br />
The Parent holds 11,039,750 ordinary shares (representing 9.71% of the ordinary share<br />
capital), the voting rights of which are therefore suspended.<br />
The Board of Directors therefore proposes:<br />
• a dividend of 0.20 euro for each 102,625,934 ordinary share different for treasury share;<br />
• a dividend of 0.218 for each 511,282 saving share;<br />
• to assign the residual operating profit of the year to the extraordinary reserve.<br />
The dividends will be payable from 23 May 2013 with detachment of the related coupons<br />
on 20 May 2013.<br />
In 2013 the payable dividends will receive, under the fiscal view, the benefit of the article 1,<br />
comma 3 of the decree of the 2 April 2008 (Finance and economics minister) because the<br />
<strong>Indesit</strong> Company S.p.A has got payable reserves constituted before 31 December 2007.<br />
Milan, 21 March 2013<br />
For the Board of Directors<br />
The Chairman<br />
Andrea Merloni<br />
33
Consolidated financial statements at 31 December <strong>2012</strong>
Consolidated financial statements at 31 December <strong>2012</strong> – Contents<br />
Contents<br />
36 Consolidated financial<br />
statements 36 Consolidated income statement<br />
Consolidated statement of comprehensive income<br />
37 Consolidated statement of financial position<br />
38 Consolidated cash flow statement<br />
39 Statement of changes in consolidated equity<br />
40 Notes 40 Group structure and activities<br />
Approval of the consolidated financial statements at 31 December <strong>2012</strong><br />
Significant events subsequent to year end<br />
Statement of compliance with international accounting standards and basis of presentation<br />
41 Accounting policies<br />
56 Reclassifications<br />
Changes in the scope of consolidation<br />
Operating segments<br />
58 Notes to the consolidated income statement<br />
65 Notes to the consolidated statement of financial position<br />
89 Notes to the consolidated cash flow statement<br />
91 Financial instruments<br />
Management of financial risks<br />
100 Recognition of hedge transactions and categories of financial asset/liability<br />
106 Information required by IAS 24 on the remuneration of management and on related parties<br />
Remuneration of management<br />
107 Schedules summarizing transactions with related parties<br />
111 Attachments 111 List of companies consolidated on a line-by-line basis<br />
112 List of other investments in subsidiaries and associates<br />
113 Consolidated income statement for the year ended 31 December <strong>2012</strong>, prepared<br />
in accordance with Consob Resolution no. 15519 dated 27 July 2006 and Consob<br />
Communication no. DEM/6064293 dated 28 July 2006<br />
114 Consolidated statement of financial position at 31 December <strong>2012</strong>, prepared in<br />
accordance with Consob Resolution no. 15519 dated 27 July 2006 and Consob<br />
Communication no. DEM/6064293 dated 28 July 2006<br />
116 Summary of the fees charged by the audit company and the network for services<br />
provided to the Group during the year, prepared pursuant to art. 149-duodecies of<br />
Issuers’ Regulation no. 11971 dated 14 May 1999 and subsequent amendments<br />
117 Statement of compliance of the Consolidated financial statements at 31 December<br />
<strong>2012</strong> pursuant to art. 81-ter of Consob Regulation no. 11971 dated 14 May 1999 and<br />
subsequent amendments and additions<br />
118 <strong>Report</strong> of the independent auditors<br />
35
Consolidated financial statements at 31 December <strong>2012</strong> – Contents<br />
Consolidated financial statements at 31 December <strong>2012</strong><br />
Consolidated income statement for the year ended 31 December <strong>2012</strong> 1<br />
(million euro) Note <strong>2012</strong> 2011<br />
Revenue 8.1 2,886.0 2,825.3<br />
Cost of sales 8.2 (2,177.5) (2,098.4)<br />
Selling and distribution expenses 8.3 (466.6) (462.9)<br />
General and administrative expenses 8.4 (109.3) (113.6)<br />
Operating profit 8.5 132.6 150.3<br />
Interest expenses 8.6 (25.8) (19.6)<br />
Interest income 8.6 2.9 1.9<br />
Exchange rate differences and other net financial expenses 8.6 (7.9) (20.4)<br />
Share of profit (losses) of associates and other 8.6 0.3 0.9<br />
Profit before tax 102.3 113.2<br />
Income taxes 8.7 (40.0) (54.2)<br />
Profit for the year 62.3 59.0<br />
Attributable to non-controlling interests 8.8 (0.0) 0.2<br />
Attributable to the owners of the Parent 62.3 58.8<br />
Basic earnings per share (euro) 9.11 0.60 0.57<br />
Diluted earnings per share (euro) 9.11 0.60 0.57<br />
Consolidated statement of comprehensive income for the year ended 31 December <strong>2012</strong><br />
(million euro) Note <strong>2012</strong> 2011<br />
Profit (loss) for the year (A) 62.3 59.0<br />
Cash flow hedges 9.11 5.7 (8.3)<br />
Exchange rate differences on translating foreign operations 9.11 37.4 (38.3)<br />
Total other comprehensive income/(loss), net of tax (B) 43.1 (46.6)<br />
Total comprehensive income/(loss) (A + B) 105.4 12.3<br />
Attributable to non-controlling interests (0.0) (0.2)<br />
Attributable to owners of the Parent 105.4 12.2<br />
1. Pursuant to Consob Resolution no. 15519 dated 27 July 2006, the effects of related party and non-recurring<br />
transactions on the consolidated income statement are reported in Attachment 3 and in notes 8.5 and 12,<br />
respectively.<br />
36
Consolidated financial statements at 31 December <strong>2012</strong> – Contents<br />
Consolidated statement of financial position as at 31 December <strong>2012</strong> 2<br />
(million euro) Note 31.12.<strong>2012</strong> 31.12.2011<br />
Assets<br />
Property, plant and equipment 9.1 673.1 623.2<br />
Goodwill and other intangible assets with an indefinite useful life 9.2 242.2 236.5<br />
Other intangible assets with a finite useful life 9.3 103.8 100.1<br />
Investments in associates 9.4 0.5 0.5<br />
Other non-current assets 9.5 92.0 41.0<br />
Deferred tax assets 9.6 77.7 64.3<br />
Other non-current financial assets 9.13.5 1.5 1.5<br />
Total non-current assets 1,190.8 1,067.0<br />
Inventories 9.7 331.8 323.2<br />
Trade receivables 9.8 465.3 440.5<br />
Current financial assets 9.13.1 29.4 20.9<br />
Tax receivables 9.9 20.3 12.9<br />
Other receivables and current assets 9.10 75.4 67.8<br />
Cash and cash equivalents 9.13.2 142.8 234.4<br />
Assets held for sale 9.21 20.4 11.8<br />
Total current assets 1,085.4 1,111.4<br />
Total assets 2,276.1 2,178.5<br />
Equity<br />
Share capital 9.11 92.8 92.8<br />
Reserves 9.11 (24.1) (67.2)<br />
Retained earnings 9.11 504.8 469.7<br />
Profit attributable to owners of the Parent 9.11 62.3 58.8<br />
Equity attributable to owners of the Parent 635.8 554.1<br />
Non-controlling interests 9.12 0.0 0.0<br />
Total equity 635.8 554.2<br />
Liabilities<br />
Medium and long-term loans and borrowings 9.13.4 232.3 246.3<br />
Employee benefits 9.14 44.7 45.4<br />
Provisions for risks and charges 9.15 50.1 48.6<br />
Deferred tax liabilities 9.16 50.2 38.4<br />
Other non-current liabilities 9.17 29.9 34.9<br />
Total non-current liabilities 407.1 413.6<br />
Banks and other short-term loans and borrowings 9.13.3 197.8 228.7<br />
Provisions for risks and charges 9.15 64.4 58.6<br />
Trade payables 9.18 844.8 788.8<br />
Tax payables 9.19 23.6 27.6<br />
Other payables 9.20 102.7 107.2<br />
Total current liabilities 1,233.1 1,210.7<br />
Total liabilities 1,640.3 1,624.3<br />
Total equity and liabilities 2,276.1 2,178.5<br />
2. Pursuant to Consob Resolution no. 15519 dated 27 July 2006, the effects of related party transactions on the<br />
separate statement of financial position are reported in Attachment 4 and in note 12.<br />
37
Consolidated financial statements at 31 December <strong>2012</strong> – Contents<br />
Consolidated cash flow statement for the year ended 31 December <strong>2012</strong> 3<br />
(million euro) Note <strong>2012</strong> 2011<br />
Profit for the year 10.1 62.3 59.0<br />
Income taxes 10.1 40.0 54.2<br />
Depreciation and amortisation 10.1 109.9 112.4<br />
Other non-monetary income and expenses, net 10.2 32.3 (6.3)<br />
Change in trade receivables 10.3 (24.8) 57.6<br />
Change in inventories 10.3 (8.6) 2.8<br />
Change in trade payables 10.3 61.2 (32.9)<br />
Change in other assets and liabilities 10.4 (84.9) (61.7)<br />
Taxes paid 10.1 (47.8) (56.7)<br />
Interest paid 10.2 (24.0) (29.8)<br />
Interest received 10.2 12.6 14.8<br />
Cash flows from/(used in) operating activities 128.2 113.5<br />
Acquisition of property, plant and equipment 10.5 (121.9) (105.9)<br />
Proceeds from sale of property, plant and equipment 10.5 15.0 14.2<br />
Acquisition of intangible assets 10.6 (36.1) (30.2)<br />
Proceeds from sale of intangible assets 10.6 0.4 -<br />
Cash flows from/(used in) investing activities (142.6) (121.8)<br />
Increase in share capital - -<br />
Dividends paid 10.7 (23.7) (31.0)<br />
New medium/long-term financial liabilities - 193.0<br />
Repayments of medium/long-term financial liabilities and bond issue 10.8 (9.5) (195.6)<br />
Change in short, medium and long-term financial liabilities 10.9 (44.0) 53.7<br />
Cash flows from/(used in) financing activities (77.2) 20.2<br />
Net cash flows from/(used in) (91.6) 11.8<br />
Cash and cash equivalents, start of year 9.13.2 234.4 222.7<br />
Cash and cash equivalents, end of year 9.13.2 142.8 234.4<br />
Total change in cash and cash equivalents (91.6) 11.8<br />
3. Pursuant to Consob Resolution no. 15519 dated 27 July 2006, the financial effects of related party transactions are disclosed<br />
in note 12. In addition, the financial effects of non-recurring transactions are described in note 8.5.<br />
38
Consolidated financial statements at 31 December <strong>2012</strong> – Contents<br />
Statement of changes in consolidated equity as at 31 December <strong>2012</strong><br />
Note 9.11<br />
(million euro)<br />
Opening balances<br />
Other profit/losses,<br />
net of taxation<br />
Profit for the year<br />
Statement of changes in consolidated<br />
equity as at 31 December <strong>2012</strong><br />
Share capital 92.8 - - - - - - - 92.8<br />
Share premium reserve 35.9 - - - - - - - 35.9<br />
Legal reserve 22.7 - - - - - - - 22.7<br />
Translation reserve (135.1) 37.4 - 37.4 - - - - (97.7)<br />
Other reserves 9.3 5.7 - 5.7 - - - - 15.0<br />
Retained earnings 469.7 - - - (23.7) - 58.8 35.1 504.8<br />
Profit attributable to owners of the Parent 58.8 - 62.3 62.3 - - (58.8) (58.8) 62.3<br />
Equity attributable to owners of the Parent 554.1 43.1 62.3 105.4 (23.7) - 0.0 (23.7) 635.8<br />
Non-controlling interests 0.0 - 0.0 0.0 - - - - 0.0<br />
Total equity 554.2 43.1 62.3 105.4 (23.7) - 0.0 (23.7) 635.8<br />
Income (expenses) recognised<br />
directly in equity<br />
Dividends paid<br />
Exercise of stock option rights<br />
Allocation of profit for the year<br />
Total effects of transactions<br />
with owners of the Parent<br />
Closing balances<br />
Statement of changes in consolidated<br />
equity as at 31 December 2011<br />
Share capital 92.8 - - - - - - - 92.8<br />
Share premium reserve 35.9 - - - - - - - 35.9<br />
Legal reserve 22.7 - - - - - - - 22.7<br />
Translation reserve (96.8) (38.3) - (38.3) - - - - (135.1)<br />
Other reserves 17.7 (8.3) - (8.3) - - - - 9.3<br />
Retained earnings 410.9 - - - (31.0) - 89.7 58.8 469.7<br />
Profit attributable to owners of the Parent 89.7 - 58.8 58.8 - - (89.7) (89.7) 58.8<br />
Equity attributable to owners of the Parent 572.9 (46.6) 58.8 12.2 (31.0) - - (31.0) 554.1<br />
Non-controlling interests (0.2) - 0.2 0.2 - - - - 0.0<br />
Total equity 572.8 (46.6) 59.0 12.3 (31.0) - - (31.0) 554.2<br />
39
Consolidated financial statements at 31 December <strong>2012</strong> – Notes<br />
Consolidated financial statements at 31 December <strong>2012</strong><br />
Notes<br />
1. Group structure and activities<br />
<strong>Indesit</strong> Company is a Group led by <strong>Indesit</strong> Company S.p.A., an Italian company based in Fabriano (near<br />
Ancona) that is listed on the Milan Stock Exchange.<br />
The Group is active in the production and sale of white goods, namely household appliances for<br />
the cooking sector (cookers, ovens and hobs), the cooling sector (refrigerators and freezers), and the<br />
washing sector (washing machines, combined washer-dryers, dryers and dishwashers).<br />
The Group operates mainly in Europe, Russia and Turkey.<br />
The Group’s operating segments, as defined in IFRS 8 - Operating Segments comprise the geographical<br />
areas which, in organisational terms, generate revenue and costs that are periodically reviewed by chief<br />
operating decision makers in order to evaluate performance and decide on the allocation of resources,<br />
and for which separate financial information is available.<br />
The household appliances sector is highly seasonal, which affects all the main economic and financial<br />
parameters.<br />
The reporting by segment required by IFRS 8 is provided in note 7.<br />
2. Approval of the consolidated financial statements at 31 December <strong>2012</strong><br />
The consolidated financial statements at 31 December <strong>2012</strong> were approved by the Board<br />
of Directors on 21 March 2013; they have been audited and will be presented to the <strong>Annual</strong><br />
Shareholders’ Meeting.<br />
3. Significant events subsequent to year end<br />
From 1 January 2013, the Group will adopt the new version of IAS 19 with retrospective effect.<br />
This standard prevents use of the corridor method currently applied by the Group (see the basis of<br />
consolidation and accounting policies described in the consolidated financial statements note 4.1).<br />
It also requires application of the same discount rate to the net assets and liabilities of the pension fund<br />
when calculating net interest expense (income), thus eliminating use of the expected return on the<br />
assets servicing the plan (see the <strong>Report</strong> on operations and note 9.14 for further information).<br />
There have not been any other significant events subsequent to year end.<br />
4. Statement of compliance with international accounting standards and basis<br />
of presentation<br />
The consolidated financial statements of <strong>Indesit</strong> Company have been prepared in accordance with<br />
the International Financial <strong>Report</strong>ing Standards - IFRS (hereafter referred to as IFRS or IAS) issued by<br />
the International Accounting Standards Board (IASB), as interpreted by the International Financial<br />
<strong>Report</strong>ing Interpretations Committee (IFRIC) and endorsed by the European Union.<br />
40
Consolidated financial statements at 31 December <strong>2012</strong> – Notes<br />
The consolidated financial statements at 31 December <strong>2012</strong> have also been prepared in accordance<br />
with Consob’s instructions regarding the format of financial statements, in application of art. 9 of<br />
Legislative Decree 38/2005 and other Consob regulations and instructions concerning financial<br />
statements.<br />
The consolidated financial statements at 31 December <strong>2012</strong> are presented on a comparative basis<br />
and comprise the consolidated statement of financial position, the consolidated income statement,<br />
the consolidated statement of comprehensive income, the consolidated cash flow statement, the<br />
statement of changes in consolidated equity and these explanatory notes.<br />
The income statement format adopted by the Group classifies costs by function. This is deemed<br />
to be more meaningful than a classification by type of expenditure, since it reflects the format<br />
of internal reporting and is consistent with international practice in the household appliances<br />
sector.<br />
The consolidated statement of comprehensive income comprises the various components forming the<br />
results for the year, together with the income and charges not deriving from transactions with owners<br />
that were recognised directly in equity. The transactions carried out with owners are presented in the<br />
consolidated statement of changes in equity, together with comprehensive income.<br />
The presentation of the statement of financial position distinguishes between current and non-current<br />
assets and liabilities.<br />
The cash flow statement is presented using the indirect method.<br />
In compliance with Consob requirements 4 , the separate income statement prepared by <strong>Indesit</strong><br />
Company S.p.A. reports expenditure by nature. This format is deemed to be appropriate given the<br />
dual role of the Parent, both as an operating company that supplies goods and services to other<br />
Group companies, and as the company holding for the equity investments of the Group. In order to<br />
ensure consistency for the users of the financial statements, an attachment to the separate financial<br />
statements of the Parent classifies its income statement by function, in the format and using the criteria<br />
adopted for the preparation of the consolidated income statement.<br />
Accounting policies<br />
4.1 Basis of<br />
preparation<br />
and accounting<br />
policies adopted<br />
Basis of preparation<br />
The currency of presentation of the consolidated financial statements is the euro, and financial<br />
statement balances are stated in millions of euro (except where stated otherwise). The consolidated<br />
financial statements are prepared on an historical cost basis, except for derivative financial instruments,<br />
financial assets held for sale and financial instruments and assets classified as available for sale, which<br />
are stated at their fair value, as well under the going concern assumption.<br />
The accounting policies are applied on a consistent basis by all Group companies. There are<br />
no financial assets held to maturity. Financial transactions are recognised with reference to the<br />
trade date.<br />
4. Consob Resolution no. 15519 dated 27 July 2006.<br />
41
Consolidated financial statements at 31 December <strong>2012</strong> – Notes<br />
The accounting policies adopted for the preparation of the consolidated financial statements at 31<br />
December <strong>2012</strong> have also been applied on a consistent basis to all the comparative financial information.<br />
Accounting<br />
estimates<br />
The preparation of consolidated financial statements involves making assumptions and estimates that<br />
affect the value of assets and liabilities and the related disclosures, as well as the value of contingent<br />
assets and liabilities at the reference date. These estimates are used to measure the property, plant<br />
and equipment and intangible assets subject to impairment, as well as to recognize allowances<br />
for doubtful accounts, provisions for inventory obsolescence, depreciation and amortisation and<br />
impairment losses on assets, employee benefits, taxation, and other provisions for risks and charges.<br />
The estimates and underlying assumptions are based on historical experience and various other factors<br />
believed reasonable at the time of making them.<br />
Estimates and assumptions are reviewed regularly and, if later estimates differ from those made initially,<br />
the effects - which obviously cannot be estimated or forecast at this time - are immediately reflected<br />
in the income statement. If the changes in estimate relate to both the current and future periods, their<br />
effects are reflected in the income statements for the periods concerned.<br />
The principal measurement processes and the key assumptions used by management in applying the<br />
accounting policies in relation to the future are summarized below. These processes and assumptions<br />
may have a significant effect on the amounts reported in the consolidated financial statements, or may<br />
give rise to the risk of significant adjustments to the carrying amount of assets and liabilities in the next<br />
accounting period.<br />
Allowance for doubtful accounts<br />
The allowance for doubtful accounts reflects the management’s estimate of the losses that may be<br />
incurred on trade receivables. Provisions to the allowance for doubtful accounts are determined with<br />
reference to the ageing of receivables, taking account of specific circumstances if this is more prudent,<br />
and any available guarantees.<br />
Provision for inventory obsolescence<br />
The provision for inventory obsolescence reflects management’s estimate of the losses to be incurred<br />
on raw materials, semi-finished and finished products, determined with reference to the life-cycle of<br />
each product and stock rotation statistics that take account of both past and forecast consumption.<br />
Recoverable amount of non-current assets<br />
Non-current assets comprise property, plant and equipment, intangible assets and other financial<br />
assets. Management reviews the carrying amounts of the non-current assets held and used, and of any<br />
assets due to be disposed of. This work is performed whenever events and circumstances require such<br />
review, and at least each year for intangible assets with an indefinite life. The review makes reference<br />
to the results of independent appraisals and/or to the cash flows expected from the use or sale of the<br />
assets concerned, applying suitable discount rates for the determination of their present value. When<br />
the carrying amount of a non-current asset is impaired, the Group recognises an impairment losses for<br />
the difference between its carrying amount and the lower amount recoverable from its use or sale, as<br />
determined by reference to the most recent business plans.<br />
Defined benefit plans<br />
The Group maintains defined benefit plans for certain employees of some Group companies.<br />
Management, assisted by actuaries and technical experts, uses various statistical and other assumptions<br />
42
Consolidated financial statements at 31 December <strong>2012</strong> – Notes<br />
to calculate the charges and the present value of the liabilities and assets relating to such plans. The<br />
assumptions made relate to the discount rate, the expected yield on plan assets, the rate of future pay<br />
increases, demographic trends, the inflation rate and the forecast cost of medical care. In addition, the<br />
Group’s consulting actuaries consider such subjective factors as mortality and termination rates.<br />
Realizability of deferred tax assets<br />
The Group recognizes deferred tax assets and the theoretical tax benefit of carried-forward tax losses.<br />
Management records deferred tax assets to the extent that their recoverability is considered likely. Their<br />
measurement takes account of current budgets and forecasts for future years.<br />
Contingent liabilities<br />
The Group is exposed to the risk of having to meet obligations deriving from legal and other disputes,<br />
without being able to predict with certainty the extent of the related outflows. This inability is often<br />
associated with the variety, proliferation and complexity of the jurisdictions and laws concerned,<br />
that may be subject to uncertain interpretations, as well as with the varying levels of predictability<br />
surrounding the facts and circumstances relating to each dispute. The Group makes reference to<br />
economists, consultants and legal experts in order to monitor appropriately the related risks, and<br />
tackle and assess the contingencies concerned. If, as a consequence, a financial outflow is deemed<br />
probable and the amount can reasonably be estimated, the Group records a related provision for risks<br />
and charges. If a financial outflow is considered possible or, in extremely rare circumstances, probable<br />
without being able to determine the amount, the situation is reported in the explanatory notes.<br />
Consolidation<br />
principles<br />
Subsidiaries<br />
Subsidiary companies are those over which <strong>Indesit</strong> Company S.p.A. exercises control by virtue of the<br />
power to determine, directly or indirectly, their financial and operating policies and to obtain benefits<br />
from their activities. In general, companies in which <strong>Indesit</strong> Company S.p.A. holds more than 50% of the<br />
voting rights, considering any potential voting rights that may be exercised at the time, are deemed to<br />
be subsidiaries. The financial statements of subsidiaries are consolidated on a line-by-line basis from the<br />
time that control commences until the date on which control ceases. Significant transactions between<br />
Group companies are eliminated in full. Unrealized gains and losses on transactions with subsidiaries<br />
are eliminated in full. The equity and results attributable to minority interests are determined with<br />
reference to their actual voting rights, without considering any potential voting rights. Any surplus<br />
arising on the elimination of investments against the book value of the related equity at the time<br />
of initial consolidation is allocated as an increase in the carrying amount of the assets, liabilities and<br />
contingent liabilities concerned; any residual amounts are classified as goodwill. The accounting<br />
reference date of all Group companies is 31 December.<br />
Dormant subsidiaries and those with an insignificant volume of business are not consolidated on a<br />
line-by-line basis, since they do not have a material effect on the financial position, cash flows or the<br />
results of operations of the Group.<br />
This list of companies consolidated on a line-by-line basis is presented in Attachment 1 to the<br />
explanatory notes to the consolidated financial statements.<br />
Associates<br />
Associates are those entities over which <strong>Indesit</strong> Company S.p.A. exercises significant influence, but<br />
does not control their operations or have the power to determine their financial and operating policies<br />
or obtain benefits from their activities. In general, companies in which <strong>Indesit</strong> Company S.p.A. holds<br />
43
Consolidated financial statements at 31 December <strong>2012</strong> – Notes<br />
directly or indirectly between 20% and 50% of the equity capital or voting rights, considering any<br />
potential voting rights that may be exercised or converted, are deemed to be associates.<br />
Associates are measured using the equity method from the time that significant influence commences<br />
over their operations until the date on which such influence ceases. If the Group’s interest in the losses of<br />
an associated company exceed the book value of the related investment, such book value is written off<br />
and the additional losses are covered by a specific provision to the extent that <strong>Indesit</strong> Company S.p.A. is<br />
obliged to cover the losses of such company or, in any case, to fulfill obligations on its behalf. Unrealized<br />
gains and losses on transactions with associates are eliminated in proportion to the equity interest held.<br />
Investments in other companies<br />
Investments in other companies in which, in general, the Group holds less than 20% of the share capital<br />
or voting rights are initially measured at cost and subsequently adjusted to fair value through the income<br />
statement. Where fair value cannot be reliably determined, these investments are measured at cost as<br />
adjusted to reflect any impairment losses. Dividends are recognized as financial income when the right to<br />
collect them is established, which generally coincides with the shareholders’ resolution.<br />
Treatment of foreign<br />
currency transactions<br />
Foreign currency transactions<br />
All transactions are recognised in the functional currency of the principal operating environment in which<br />
each Group company operates. Transactions not carried out in the functional currency of Group companies<br />
are translated using the exchange rates applying at the time they take place. Monetary assets and liabilities<br />
(defined as assets and liabilities held for collection or payment, whose amount is fixed or determinable - IAS<br />
21) are translated using the exchange rates applying at the reporting date and any exchange rate differences<br />
are recognized in the income statement. Non-monetary assets and liabilities recognised at historical cost in<br />
foreign currencies are translated using the historical rates applying at the time of the related transactions.<br />
Non-monetary assets and liabilities measured at fair value in foreign currencies are translated using the<br />
exchange rates applying at the time that their fair value was determined.<br />
Translation of financial statements<br />
The financial statements of companies whose functional currency differs from that used to prepare the<br />
consolidated financial statements (euro) and which do not operate in hyper-inflationary economies,<br />
are translated as follows:<br />
a) assets and liabilities, including the goodwill and fair-value adjustments deriving from the<br />
consolidation process, are translated using the reference date exchange rates;<br />
b) revenues and costs are translated using the average exchange rate for the period (weighted with<br />
reference to sales), which is deemed to approximate the rates applying on the dates when the<br />
individual transactions took place;<br />
c) translation differences are recognized in a specific equity reserve.<br />
On the deconsolidation of an economic entity, the related cumulative translation adjustment (if any) is<br />
reclassified from shareholders’ equity to the income statement. The cumulative translation adjustment was<br />
reclassified to other reserves on the first-time adoption of IFRS, accordingly the gains and losses deriving<br />
from future disposals will only include the translation adjustments arising from 1 January 2004 onwards.<br />
Net investments in foreign operations<br />
The exchange differences arising from the translation of net investments in functional currencies other than<br />
the euro, generally comprising intercompany loans, are taken to the translation reserve. Such differences are<br />
released to the income statement upon liquidation (repayment/disposal) of the net investment.<br />
44
Consolidated financial statements at 31 December <strong>2012</strong> – Notes<br />
Derivative financial<br />
instruments<br />
If the conditions established in IAS 39 regarding the formal designation of derivative financial<br />
instruments as hedges are met and these instruments are shown to be highly effective, both ex ante<br />
when the transaction is arranged and ex post during subsequent accounting periods, then they are<br />
recognised on a hedge accounting basis, as described below.<br />
Fair Value Hedges (hedges of assets and liabilities)<br />
If a derivative financial instrument is designated to hedge the risk of changes in the fair value of a<br />
recognized asset or liability (the underlyings), the gain or loss from subsequent fair-value adjustments<br />
to the hedging instrument is recognized in the income statement together with the gain or loss<br />
deriving from the measurement of the related underlyings.<br />
Cash Flow Hedges<br />
If a derivative financial instrument is designated as a hedge of the risk of variability in the cash flows of a<br />
recognized asset or liability or a highly probable forecast transaction, the effective part of gains or losses<br />
on such financial instrument is recognized in the hedging reserve within equity, while the ineffective<br />
portion (if any) is taken to the income statement. If the hedge of a forecast transaction subsequently<br />
results in the recognition of a non-financial asset or liability, the hedging reserve is removed from equity<br />
and included in the initial cost of such non-financial asset or liability. If the hedge of a forecast transaction<br />
subsequently results in the recognition of a financial asset or liability, the hedging reserve is released to<br />
the income statement in the period when the asset acquired or recognized liability has an effect on the<br />
income statement. In other cases, the hedging reserve is released to the income statement in a manner<br />
consistent with the hedged transaction i.e. when its economic effects are recognized. If a hedging<br />
instrument expires, is sold or is terminated early with respect to the timing of the hedged transaction and<br />
the latter is no longer expected to take place, the related hedging reserve is released immediately to the<br />
income statement. If, on the other hand, the hedged transaction is still expected to occur, the cumulative<br />
gain or loss remains in equity until the transaction takes place.<br />
Hedge of a net investment in a foreign operation<br />
If a derivative financial instrument is designated to hedge a net investment in a foreign operation, the<br />
gains or losses deriving from the related measurement of fair value are recognized directly in equity, to<br />
the extent that the hedge is deemed to be effective, while the ineffective portion (if any) is recognized<br />
in the income statement.<br />
Financial instruments not covered by hedge accounting<br />
If financial instruments do not meet the requirements for the application of hedge accounting<br />
methodology, they are stated at fair value and the related effects are recognized directly in the income<br />
statement.<br />
Property, plant and<br />
equipment<br />
Owned assets<br />
Property, plant and equipment are stated at purchase cost or, if self-constructed, at production cost,<br />
comprising the cost of materials, labor and a reasonable portion of overheads and related charges,<br />
less accumulated depreciation and impairment of value determined on the basis described below.<br />
If necessary and significant, the cost of property, plant and equipment includes an initial estimate of<br />
dismantling and removal costs. Ordinary maintenance expenses are charged to the income statement,<br />
while the costs of replacing certain parts of property, plant and equipment and extraordinary<br />
maintenance costs are capitalized when it is probable that they will generate measurable economic<br />
benefits in the future.<br />
45
Consolidated financial statements at 31 December <strong>2012</strong> – Notes<br />
Any borrowing costs incurred on the acquisition or construction of capitalized assets that normally<br />
require time before they become available for use or for sale, are also capitalized and amortized over<br />
the useful life of the asset class concerned. All other borrowing costs are charged to the income<br />
statement for the year to which they relate.<br />
Finance leasing of fixed assets<br />
Property, plant and equipment held under finance leases, in relation to which <strong>Indesit</strong> Company has<br />
assumed substantially all the risks and rewards of ownership, are recognized at fair value at inception of<br />
the lease or, if lower, at the present value of the minimum lease payments. They are depreciated over<br />
their estimated useful lives and adjusted for any impairment losses determined on the basis described<br />
below. The liability to the lessor is classified among financial payables in the statement of financial<br />
position.<br />
Depreciation<br />
Property, plant and equipment are depreciated on a straight-line basis over their estimated useful lives.<br />
Significant parts of plant and machinery with different useful lives are depreciated separately. Useful<br />
lives are monitored on a constant basis, having regard for changes in the intensity with which these<br />
assets are used. Any changes in the depreciation schedules are applied on a prospective basis.<br />
Carrying amount is verified with reference to the estimated present value of expected future<br />
cash flows and adjusted, where necessary, every time events suggest that the carrying amount of<br />
property, plant and equipment may be impaired, or when there is a marked decrease in their market<br />
value, significant technological changes or evidence of significant obsolescence. Such write-downs<br />
are reversed if the reasons for recording them cease to apply. Land, whether or not used for the<br />
construction of civil or industrial buildings, is not depreciated since it is deemed to have an indefinite<br />
useful life.<br />
The useful lives of tangible fixed assets are grouped into the following categories:<br />
Category<br />
Useful life<br />
Buildings and temporary constructions<br />
from 10 to 50 years<br />
Plant and machinery<br />
from 5 to 20 years<br />
Industrial and commercial equipment<br />
from 3 to 20 years<br />
Other assets:<br />
- vehicles and internal transport from 3 to 6 years<br />
- furniture, IT and office machines from 3 to 10 years<br />
Intangible assets<br />
Intangible assets are stated at cost, determined on the basis described for property, plant and<br />
equipment, when it is likely that the use of such assets will generate economic benefits and<br />
their cost can be determined reliably. Intangible assets with a finite useful life are amortized<br />
and stated net of both the related accumulated amortization, provided on a straight-line basis<br />
over their estimated useful lives, having regard for the period during which they are expected<br />
to generate economic benefits, and any impairment in their value. Intangible assets with an<br />
indefinite useful life, comprising the Hotpoint trademark and goodwill, are not amortized but<br />
their recoverability is tested for impairment at least once each year. Subsequent expenditure<br />
on recognized intangible assets is capitalized only if it increases the future economic benefits<br />
embodied in the specific asset to which it relates; otherwise, it is charged to the income<br />
statement as incurred.<br />
46
Consolidated financial statements at 31 December <strong>2012</strong> – Notes<br />
Any borrowing costs incurred on the acquisition or construction of capitalized assets that normally<br />
require time before they become available for use or for sale, are also capitalized and amortized over<br />
the useful life of the asset class concerned. All other borrowing costs are charged to the income<br />
statement for the year to which they relate.<br />
Goodwill<br />
Goodwill is an intangible asset with an indefinite life, deriving from a business combination<br />
recognized using the purchase method of accounting (adopted for all acquisitions made<br />
subsequent to 31 December 2002). It is recognised to reflect the positive difference between<br />
purchase cost and the value of the Group’s equity interest at the time of acquisition, after having<br />
recognized all assets, liabilities and identifiable contingent liabilities attributable to both the Group<br />
and third parties at their full fair value.<br />
The value of goodwill is verified with reference to the cash generating units (CGUs) that benefit<br />
from the synergies deriving from the acquisition. The expected cash flows are discounted at the<br />
cost of capital, having regard for the specific risks associated with the unit concerned. Impairment is<br />
recognized if the recoverable amount of the CGU, represented by the discounted cash flows, is less<br />
than the related carrying amount. Such impairment is deducted first from the value of goodwill.<br />
The gains and losses arising on the disposal of businesses or lines of business that were acquired with<br />
the payment of goodwill are determined having regard for the residual value of such goodwill. Any<br />
impairment losses in goodwill charged to the income statement are not reversed even if the related<br />
reasons cease to apply.<br />
Research and development expenses<br />
Expenditure on research activities undertaken to acquire new knowledge is charged to the income<br />
statement as incurred. Expenditure on development activities incurred to create new products or<br />
improve existing products, or to develop and improve production processes, are capitalized if the<br />
innovations made result in technically feasible processes and/or commercially salable products, on<br />
condition that there is an intention to complete the development project, sufficient resources are<br />
available for such completion, and the economic costs and benefits deriving from such innovations can<br />
be measured reliably. Capitalized expenditure includes both internal and external design costs (including<br />
payroll and materials used) and the portion of general manufacturing costs reasonably attributable to the<br />
projects concerned. Capitalized development expenditure is treated as an intangible asset with a finite<br />
life and is amortized over the expected period of economic benefit, which is generally taken to be 5 years.<br />
Adjustments are recognised to reflect any impairment losses arising subsequent to initial recognition.<br />
Other development expenditures are charged to the income statement in the year incurred.<br />
Other intangible assets<br />
Other intangible assets expected to generate measurable economic benefits are deemed to have<br />
a finite life and are recognised at cost. They are amortized on a straight-line basis over the period<br />
of expected economic benefit. This period is deemed to be 10 years for the Cannon trademark and<br />
between 5 and 10 years for the other assets. Adjustments are recognised to reflect any impairment<br />
losses arising subsequent to initial recognition.<br />
Trade receivables<br />
When first recognised, trade receivables are stated at the fair value of the initial consideration, as<br />
increased by the related transaction costs. Receivables normally fall due within one year and arise<br />
47
Consolidated financial statements at 31 December <strong>2012</strong> – Notes<br />
in the context of market interest rates that are not particularly high. Accordingly, if the receivables<br />
were generated as a result of the sales invoicing process, the invoiced amount is generally deemed<br />
to represent fair value. In the case of advances, fair value is represented by the amount of the cash<br />
movement or equivalent transaction.<br />
Subsequent to initial recognition, receivables are measured at amortized cost, being their initiallyrecognized<br />
amount, net of any payments or services received and any impairment losses. Impairment<br />
losses are estimated by determining the allowance for doubtful accounts, as described in the<br />
accounting policies adopted for the preparation of the consolidated financial statements.<br />
If the above criterion (nominal value) is not used at the time of initial recognition, amortized cost also<br />
takes account of the amortization accumulated using the effective interest method.<br />
If the impairment loss decreases in a later period, the loss previously recognised is partly or fully<br />
reversed and the value of the receivable is restored to an amount that does not exceed the amortized<br />
cost that would have been reported had the loss not been recognized.<br />
Trade receivables sold with or without recourse, for which all the conditions established in IAS 39 for<br />
the derecognition of financial assets do not apply, continue to be reported in the statement of financial<br />
position, while receivables sold without recourse which satisfy all the conditions of IAS 39 for the<br />
derecognition of financial assets are eliminated from the financial statements at the time of disposal.<br />
Other current and<br />
non-current financial<br />
assets<br />
Held-to-maturity securities are initially measured at cost, as increased by the transaction costs incurred<br />
to acquire them. Subsequently, they are measured at amortized cost using the effective interest<br />
method, net of any impairment losses.<br />
Financial assets held for trading are classified as current assets and measured at fair value, with the<br />
recognition of any gains or losses in the income statement.<br />
Securities and other financial assets classified as available for sale are stated at their fair value. Gains and<br />
losses deriving from fair-value measurement are recognized directly in equity, except for impairment<br />
losses and exchange rate losses which are charged to the income statement. The deferred gains and<br />
losses recognized in equity are released to the income statement at the time of sale.<br />
Receivables maturing beyond one year that do not earn interest or which earn interest at below market<br />
rates are discounted using market rates.<br />
The interest earned on financial assets, determined using the effective interest method, is credited to<br />
the income statement. The fair value of financial assets held for trading and those available for sale is<br />
represented by their market price at the reporting date.<br />
Inventories<br />
Cash and cash<br />
equivalents<br />
Inventories are stated at the lower of cost or net realizable value. Cost is determined on a weightedaverage<br />
cost basis and includes purchasing-related expenses, inclusive of indirect charges, and the costs<br />
of converting products and bringing them to their present location and condition. Net realizable value<br />
is determined with reference to market prices after deducting completion costs and selling expenses.<br />
Obsolete and slow-moving materials and finished products are written down with reference to their lifecycles<br />
and stock rotation statistics that take account of both past and forecast consumption.<br />
Cash and cash equivalents, recognised at nominal value, comprise cash on hand, bank and postal<br />
deposits and equivalent assets that can be liquidated in the very-short term (three months) and are not<br />
subject to significant fluctuations in value.<br />
48
Consolidated financial statements at 31 December <strong>2012</strong> – Notes<br />
Impairment of assets<br />
At each reporting date, the carrying amounts of the Group’s intangible assets with an indefinite life,<br />
goodwill and intangible assets in progress are tested for impairment, on the basis described in the<br />
relevant paragraphs. With the exclusion of inventories and deferred tax assets and except as discussed<br />
in relation to property, plant and equipment, other assets are tested for impairment if events suggest<br />
that they may have incurred an impairment loss. If the test shows that the recognised assets of a cashgenerating<br />
unit (CGU) have suffered a loss in value, their recoverable value is estimated and any excess<br />
carrying value is charged to the income statement. The loss in value of a CGU is allocated first against<br />
the related goodwill, if any, and then against the value of its other assets.<br />
The recoverable value of CGUs to which goodwill and intangible assets with an indefinite useful<br />
life have been allocated is verified by determining their value in use, being the value of expected<br />
cash flows discounted using a rate that reflects the specific risks of the individual CGUs at the<br />
measurement date. In applying this method, management uses many assumptions, including<br />
estimates for the change in sales, gross profit, operating costs, the growth rate for terminal values,<br />
capital investment, the changes in operating capital and the weighted-average cost of capital<br />
(discount rate), which contribute to the preparation of a medium-term plan specifically for the<br />
purpose of carrying out impairment tests. This plan is updated annually and approved by the<br />
Parent’s Board of Directors.<br />
The recoverable value of investments in securities held to maturity and receivables recognised at<br />
amortized cost is represented by the present value of future cash flows, discounted using the effective<br />
interest rate determined at the time of initial recognition. The recoverable amount of other assets is<br />
represented by the greater of their net selling price or their value in use, determined by discounting<br />
estimated future cash flows using a market rate.<br />
Any impairment losses on securities held to maturity and receivables stated at amortized cost are<br />
reversed if any subsequent increases in their recoverable amount can be determined on an objective<br />
basis.<br />
If the impairment loss associated with an individual asset cannot be determined, the Group identifies<br />
the loss in value of the CGU to which it belongs.<br />
Share capital<br />
Financial liabilities<br />
Trade payables<br />
and other payables<br />
Share capital, including the portion represented by savings shares, is stated at nominal value. The<br />
buy-back of treasury shares, stated at cost including related charges, is recognised as a change in<br />
shareholders’ equity; the nominal value of treasury shares is classified as a reduction of share capital,<br />
while the difference between cost and nominal value is deducted from the equity reserves. Dividends<br />
to shareholders are recognized as a liability in the year in which they are declared.<br />
Financial liabilities are initially recognized at their fair value, net of related charges, and subsequently<br />
measured at amortized cost using the effective interest method. The difference between amortized<br />
cost and repayment value is recognized in the income statement over the life of the liability in<br />
proportion to the related interest accrued. Where hedge accounting applies, the financial liabilities<br />
hedged by derivative instruments are measured on a basis consistent with the hedging instrument.<br />
Trade payables and other payables due on normal commercial terms, generally within one year, are<br />
recognised at the fair value of the initial consideration, as increased by the related transaction costs.<br />
Following initial recognition, they are measured at amortized cost and any differences are reflected in<br />
the income statement over the life of the liability using the effective interest method. Trade payables<br />
and other payables, generally due within one year, are not discounted.<br />
49
Consolidated financial statements at 31 December <strong>2012</strong> – Notes<br />
Employee benefits<br />
Obligations for employee pensions and other benefits deemed to represent defined contribution<br />
plans are charged to the income statement on an accruals basis. The net liability to employees under<br />
defined benefit plans, principally represented by severance indemnities (TFR) in Italy and pension<br />
funds in the UK, is recognised to reflect the expected future value of the benefits to be received by<br />
employees and accrued by them in the current and prior years. These benefits are discounted and<br />
the resulting obligation is stated net of the fair value of any pension plan assets. The net obligation<br />
is determined separately for each plan using actuarial assumptions and is calculated each year,<br />
or more frequently, with the support of an independent actuary using the projected unit credit<br />
method. The benefits are discounted using the rate for a bond with an AA rating and a maturity date<br />
that is consistent with the timing of the related payments to employees. The actuarial gains and<br />
losses arising subsequent to 1 January 2004, the IFRS transition date, are recognised in the income<br />
statement on a straight-line basis over the residual working lives of employees, to the extent that<br />
their cumulative net value exceeds by more than 10% the greater of: the total liability arising under<br />
defined benefit plans or the fair value of the assets servicing these plans (corridor method) at the<br />
end of the prior year.<br />
As a result of the reform of supplementary pensions, the TFR accrued by Italian Group companies from<br />
1 January 2007 is treated as a defined contribution plan, while that accrued up to 31 December 2006<br />
continues to be treated as a defined benefit plan.<br />
In the event of business restructuring, the defined benefit plans are remeasured and any excess<br />
amounts identified are reflected in the income statement.<br />
Stock options<br />
Provisions for risks<br />
and charges<br />
The remuneration recognized to employees and directors by the granting of stock options is charged<br />
to the income statement with a matching entry in equity. Such cost is determined with reference to<br />
the fair value of the options at the time they are granted. The cost of stock options, determined on<br />
the above basis, is charged to the income statement over the related vesting period. The fair value of<br />
the options at the grant date is determined using financial models that take account of the terms and<br />
conditions under which such options were granted.<br />
The provisions for risks and charges are recognised to cover obligations, of a legal or constructive<br />
nature (under contracts or for other reasons), deriving from past events. Provisions for risks and charges<br />
are recognized if it is probable that the related obligations will crystallize and the amounts concerned<br />
can be estimated reliably. If the settlement of such obligations is expected to take place after more<br />
than one year and the effects of this are significant, they are discounted using a rate that takes account<br />
of the cost of money and the specific risks associated with the liabilities concerned. Any changes in<br />
the estimated amount of provisions are reflected in the income statement in the year identified. In the<br />
event of discounting, the increase in the provision due to the passage of time and the effect of any<br />
changes in the discounting rate are recognised as a financial charge.<br />
The principal liabilities covered by provisions are described below.<br />
Warranties<br />
Provisions for legally-required and voluntary warranty costs are recognised at the time the related<br />
products are sold. The provision is determined with reference to the call rate for the products still<br />
under warranty cover, the period of time between the sale of the finished products to distributors<br />
and the start of the warranty period (sell in - sell out), and the average unit cost of the work<br />
performed.<br />
50
Consolidated financial statements at 31 December <strong>2012</strong> – Notes<br />
Restructuring work<br />
Provisions for restructuring are recognized at the time that a constructive obligation arises, such as<br />
when the Group informs interested parties about the restructuring plan or makes sufficiently specific<br />
announcements that induce interested parties to believe that the related obligation will be met.<br />
Onerous contracts<br />
Provisions for onerous contracts are recognized when the expected benefits are lower than the related<br />
costs. They are recognised in the year in which the related losses become known and measurable.<br />
Product disposal (WEEE)<br />
The European Union adopted the WEEE (Waste Electrical and Electronic Equipment) Directive in<br />
December 2002, which makes manufacturers responsible at a European level for the recovery and<br />
disposal of waste products.<br />
At the start, the Directive established different regimes of responsibility, for products put on the market<br />
up to 13 August 2005 (old waste) and for those put on the market subsequently (new waste).<br />
For the first (old waste), manufacturers were required to incur the related disposal costs on a collective<br />
basis. Compliance with this obligation involved:<br />
• the creation of consortiums dedicated to the collection and disposal of waste products;<br />
• the reallocation of the related consortium costs in proportion to the market share of each<br />
manufacturer in the year in which such costs were incurred;<br />
• and the possibility of financing disposal activities, for a transitional period of 8 years (from 2005), by<br />
uplifting the selling prices of products by a so-called visible fee.<br />
For the second (new waste), the principle of individual responsibility was applied, making each<br />
manufacturer responsible for the cost of disposing of the products that it put on the market.<br />
On implementing the WEEE Directive, the regulations governing the treatment of new waste in<br />
numerous EU countries maintained the principle of individual responsibility established in the<br />
Directive, but allowed compliance via a system of collective disposal using a mechanism that is<br />
essentially consistent with that applied for the disposal of old waste. Accordingly, manufacturers<br />
have been allowed to delegate the collection and disposal of new waste to consortiums, that<br />
allocate their costs using criteria in line with those mentioned above in relation to old waste. Italian<br />
legislation imposes individual responsibility for the collection and disposal of new waste, allowing<br />
manufacturers to comply with their obligations by registering with a collective system. The Parent has<br />
taken advantage of this opportunity by electing to manage its collection and disposal activities via the<br />
collective system operated by the ECODOM consortium.<br />
With regard to new waste, certain Group companies operating within the EU do not follow the<br />
general practice described above, since local regulations governing their individual responsibility<br />
only allow compliance on an individual basis with the requirement to collect and dispose of waste.<br />
Manufacturers operating in the countries concerned therefore make a specific annual provision for<br />
the estimated future cost of collecting and disposing of the products sold by them. With regard to<br />
such countries, the Group estimates the required provision by reference to the visible fee charged<br />
for each category of products, as reduced to reflect a steady improvement in the efficiency of the<br />
product disposal process and a rise in the proportion of materials recovered from this process. The<br />
provision recognised is discounted over a period of time equal to the life cycles of the products<br />
concerned.<br />
51
Consolidated financial statements at 31 December <strong>2012</strong> – Notes<br />
Other provisions<br />
Provisions are recognised for other future charges deriving from court cases, disputes and other<br />
obligations when the requirements for the recognition of a liability are met, being in the accounting<br />
period in which such charges become known and measurable reliably.<br />
Income<br />
Revenue<br />
Revenue from the sale of goods is recognized when the significant risks and rewards of ownership are<br />
transferred to the buyer. Revenue from the sale of goods is generally recognized when they are handed over<br />
to the transport firms which, under the terms of current contracts, marks the time when the above risks and<br />
rewards are transferred. Revenue is not recognized if its recoverability is considered to be uncertain.<br />
Revenue is stated net of discounts, allowances, rebates, returns and expenses incurred on promotional<br />
actions that, in substance, represent commercial discounts. This caption does not include proceeds<br />
from the disposal of raw materials and scrap. Revenue from services is recognised in the income<br />
statement based on their stage of completion at the reporting date, determined with reference to the<br />
work performed or, alternatively, to the percentage of completion with respect to the total.<br />
Dividends<br />
Collectible dividends are recognized as revenue when they are declared at the related shareholders’<br />
meeting.<br />
Grants<br />
Grants from the Government or other bodies, recognized in the form of direct payments or tax<br />
benefits, are recognized as deferred income in the statement of financial position, among other<br />
liabilities, at the time their collection become reasonably certain and when compliance with all the<br />
requirements to obtain them is assured. They are recognized as revenue in the income statement on a<br />
systematic basis in order to match the accounting recognition of the costs for which such grants were<br />
made (capital grants).<br />
Operating grants are taken to the income statement at the time the requirements for their<br />
recognition are met, and when it becomes certain that they will be recognized in order to offset the<br />
eligible costs.<br />
Expenses<br />
The costs of purchasing goods and services are recognized when the amounts concerned can be<br />
determined reliably. The costs of purchasing goods are recognized on delivery which, under the terms<br />
of current contracts, marks the time when the related risks and rewards are transferred. The costs of<br />
services are recognized on an accruals basis with reference to the time they are received.<br />
Cost of sales<br />
Cost of sales includes all the costs of manufacturing finished products, comprising raw materials, the<br />
purchase of components, the cost of direct and indirect, internal and external processing, industrial<br />
depreciation, all production-related charges, and the provisions for costs to be incurred in relation to<br />
products sold, as well as research costs and any development costs that are not capitalized.<br />
Selling, distribution, general and administrative expenses<br />
Selling, distribution, general and administrative expenses comprise all the costs incurred to<br />
commercialize products and provide services (except for the expenses incurred on promotional<br />
52
Consolidated financial statements at 31 December <strong>2012</strong> – Notes<br />
actions that, in substance, represent commercial discounts and are deducted from Revenue), the costs<br />
of distributing products to the Group’s warehouses and to customers, general and administrative<br />
expenses and related charges, as well as all the other non-financial expenses that are not part of core<br />
business.<br />
Leases and rentals<br />
Payments made under operating leases are expensed on an accruals basis to match the economic<br />
benefits deriving from the leased assets. If such economic benefits are less than the related charges,<br />
effectively as a result of loss contracts, the difference between the discounted charges and benefits is<br />
recognised as a cost in the income statement.<br />
Finance leases give rise to the recognition of depreciation on the assets recognized and of financial<br />
charges representing interest on the loan obtained under the lease.<br />
These financial charges are spread over the term of the leases in order to apply a constant interest rate<br />
to the remaining balance of the liability.<br />
Interest expense, interest income, exchange differences and other net financial charges<br />
These captions include the interest payable on all forms of borrowing, cash discounts allowed to<br />
customers for early payments with respect to the agreed terms of sale, financial income from cash<br />
and cash equivalents, and exchange gains and losses, as well as the economic effects recognised<br />
in the income statement of measuring the transactions that hedge interest-rate and exchangerate<br />
risks.<br />
Income and expense<br />
from associates<br />
Income tax<br />
The share of profits (losses) from associates includes the effects deriving from application of the equity<br />
method and the gains and losses arising on disposal of equity interests in these companies.<br />
Income tax is recognized in the income statement, except for that relating to transactions recognized<br />
directly in equity, in which case it is also recognized in equity. Income tax includes current taxes and<br />
the changes in deferred tax assets and liabilities. Current taxes are based on an estimate of the amount<br />
that <strong>Indesit</strong> Company expects will be paid, determined by multiplying the taxable income of each<br />
Group company by the tax rate in force on the accounting reference date in each of the countries<br />
concerned.<br />
Deferred tax assets and liabilities are recognized using the liability method, considering all the<br />
temporary differences that emerge between the tax value of assets and liabilities and their carrying<br />
amounts in the consolidated financial statements. Deferred tax assets and liabilities are not recognized<br />
in respect of goodwill or those assets and liabilities that do not affect taxable income. Income<br />
taxes deriving from the distribution of dividends are recognized at the time the related payable is<br />
recognized.<br />
The recoverability of deferred tax assets is verified at each reporting date and any amounts for which<br />
recovery is no longer likely are charged to the income statement.<br />
Deferred tax assets and liabilities are recognized using the tax rates expected to be in force in the<br />
countries concerned for the tax periods in which the related temporary differences are forecast to<br />
reverse or expire.<br />
Deferred tax assets are recognized to the extent it is probable that sufficient future taxable income will<br />
be available to recover them.<br />
53
Consolidated financial statements at 31 December <strong>2012</strong> – Notes<br />
Current and deferred tax assets and liabilities are offset when due to the same tax authority, if the<br />
periods of reversal are the same and a legal right of offset exists.<br />
Deferred tax liabilities are recognized in relation to the distributable profits of subsidiaries, if there is an<br />
intention to distribute such profits.<br />
Non-current assets<br />
held for sale<br />
and discontinued<br />
operations<br />
Earnings per share<br />
4.2 Amendments<br />
and revised<br />
accounting<br />
standards applied<br />
for the first time<br />
by the Group<br />
Assets held for sale are measured at the lower of their carrying value at the time their sale was<br />
decided or their fair value, net of estimated selling costs. All costs, income and write-downs, if any, are<br />
recognised in the income statement and reported separately.<br />
Operating activities that represent a separate major line of business or geographical area of operations<br />
are classified separately in the income statement and the statement of financial position at the time of<br />
disposal, or when they meet the conditions for classification as assets held for sale.<br />
Basic earnings per share is calculated with reference to the profit for the year of the Group and the<br />
weighted average number of shares in <strong>Indesit</strong> Company S.p.A. outstanding during the year. Treasury<br />
shares are excluded from this calculation. Diluted earnings per share is determined by adjusting the<br />
basic earnings per share to take account of the theoretical conversion of all potential shares, being all<br />
financial instruments that are potentially convertible into ordinary shares, with a diluting effect. The<br />
Group’s stock option plans represent a category of potential instruments with a diluting effect.<br />
IAS 12 - Income taxes<br />
The amendment introduced a presumption that deferred tax on investment property measured at fair<br />
value in accordance with IAS 40 should be determined taking into account that the carrying amount<br />
will be recovered through sale. A consequence of this amendment, SIC-21 - Income taxes - Recovery of<br />
revalued non-depreciable asset, will no longer apply. The amendment must be applied retrospectively<br />
from 1 January <strong>2012</strong>. It should be noted that this case is not regulated by the amendment in the Group.<br />
The relevant accounting standards and related amendments are listed below.<br />
4.3 Amendments<br />
and<br />
interpretations<br />
applicable from<br />
1 January 2013<br />
onwards<br />
IAS 1 - Presentation of Financial Statements<br />
The amendments to IAS 1 are intended to clarify the presentation of those captions representing other<br />
components of comprehensive income. This will help users of the accounts to distinguish between the<br />
individual captions that subsequently may, or may not, be reclassified to the income statement.<br />
The standard, which will be applied from 1 January 2013, will have no effect on the results of the Group<br />
or on consolidated equity.<br />
IAS 19 - Employee Benefits<br />
The amended standard requires the company to determine the present value of its defined benefit<br />
obligations and the fair value of plan assets, and to recognize in the statement of financial position the<br />
net liability for defined benefits.<br />
The amended standard eliminates the opportunity to apply the corridor method, which is currently<br />
used by the Group.<br />
The standard also requires the discount rate on net payables to be applied to defined benefits (assets),<br />
in order to calculate the net interest expense (income). In this way, the standard eliminates the use of<br />
an expected yield on plan assets.<br />
54
Consolidated financial statements at 31 December <strong>2012</strong> – Notes<br />
The changes to the net liability for defined benefits (assets) will be recognized as follows:<br />
• the service cost and net interest in the income statement, and<br />
• subsequent measurement in the statement of comprehensive income.<br />
The standard will have the following impact on the presentation of the results and equity of the<br />
Group: all historical actuarial gains and losses will be included in the measurement of the net<br />
liability for defined benefits. This will increase <strong>Indesit</strong>’s liability and reduce equity (net of deferred<br />
taxation).<br />
Future changes in the net liability for defined benefits due, for example, to changes in the discount rate<br />
or the mortality rate will be reported in the statement of comprehensive income.<br />
Please refer to the annual report (paragraph of significant events) for more details about the impact of<br />
this amendment on the Group’s equity.<br />
IFRS 7 - Financial Instruments: Disclosures<br />
The amendment requires information on the effects or potential effects of the rights to offsetting<br />
financial assets and financial liabilities on the balance sheet. This amendment shall be applied for<br />
financial years beginning on or after 1 January 2013 and interim periods subsequent to that date. The<br />
information must be provided retrospectively. It is believed that the adoption of this standard did not<br />
have a material impact on the Group’s financial statements.<br />
IFRS 10 - Consolidated financial statements<br />
This standard identifies control as the basis for consolidation in all types of company. It replaces<br />
IAS 27 - Consolidated and separate financial statements and SIC 12 - Consolidation - Special purpose<br />
entities.<br />
IFRS 11 - Joint Arrangements - Establishes the disclosures required by parties to joint arrangements.<br />
This standard replaces IAS 31 - Interests in Joint Ventures and SIC 13 - Jointly Controlled Entities -<br />
Non-monetary Contributions by Venturers.<br />
IFRS 12 - Disclosure of Interests in Other Entities<br />
This standard brings together, improves and replaces the disclosures required about interests in<br />
subsidiaries, joint arrangements, associates and unconsolidated structured entities.<br />
The amended versions of IFRS 10, IFRS 11 and IFRS 12 will not have an immediate impact of the results<br />
and equity of the Group, but might affect the accounting logic applied for consolidation purposes.<br />
The standards will take effect from January 2014 in the European Union.<br />
IFRS 13 - Fair Value Measurement<br />
The principle clarifies how to determine fair value for accounting purposes and applies to all IFRS that<br />
require or permit fair value measurements or the presentation of information based on fair value. The<br />
principle is to be applied prospectively from 1 January 2013. It is believed that the adoption of this<br />
standard did not have a material impact on the Group’s financial statements.<br />
IFRS 9 - Financial Instruments<br />
This standard relates to the classification and measurement of financial instruments. The Group will<br />
evaluate the effect of its application on the accounting presentation of financial assets and liabilities.<br />
The IASB has recently modified IFRS 9 and deferred its obligatory effective date to 1 January 2015,<br />
although early adoption is allowed.<br />
55
Consolidated financial statements at 31 December <strong>2012</strong> – Notes<br />
5. Reclassifications<br />
Commencing from 1 January <strong>2012</strong>, certain data has been reclassified in order to improve its accounting<br />
presentation: insurance excesses and the uninsured element of third-party liability settlements relating<br />
to household appliances (reclassified from selling expenses to cost of sales), as well as certain technical<br />
and corporate costs following the organizational changes made.<br />
Overall, these reclassifications have not had any effect on the Group’s operating profit (EBIT), profit for<br />
the year or consolidated equity.<br />
6. Changes in the scope of consolidation<br />
RTC International Ltd., a dormant company, was liquidated on 24 April <strong>2012</strong>.<br />
A number of other dormant companies were liquidated on 8 May <strong>2012</strong>: Fixt Ltd., Hotpoint UK Ltd., Hotpoint<br />
Sales Ltd., Ariston Group Service Ltd., <strong>Indesit</strong> Properties Ltd. and Creda Domestic Appliances Service Ltd.<br />
During the second semester, <strong>Indesit</strong> Company Nordics AB was consolidated on a line-by-line basis for<br />
the first time.<br />
7. Operating segments<br />
The following geographical areas have been identified as representative of the Group’s operating<br />
segments:<br />
• Western Europe Area 5 ;<br />
• Eastern Europe Area 6 ;<br />
• International Area 7 .<br />
Segment revenue is calculated based on the final destination of the products and segment results take<br />
account of all expenses that can be directly allocated to the geographical areas concerned. The costs not<br />
allocated to geographical areas include non-recurring industrial charges and corporate costs. Similarly,<br />
financial income and expenses and taxation are not allocated to the various geographical areas.<br />
Except for trade receivables, assets, liabilities and investments are not allocated to geographical areas<br />
and are examined by senior management at Group level.<br />
The trade receivables allocated to geographical areas and reviewed by the most senior decision makers<br />
comprise those deriving from the sale of finished products. They do not include receivables deriving<br />
from the provision of services (with the exception of UK service activities), advances to suppliers or the<br />
effects of any disposals of receivables.<br />
The following tables present the Group’s operating information analyzed by geographical area based<br />
on the final destination of the products.<br />
5. This includes: Italy, the UK and Ireland, France, the Netherlands, Spain, Portugal, Germany, Austria, Switzerland, Belgium,<br />
Scandinavia.<br />
6. This includes: Russia and the Asian Republics, Belarus, Kazakhstan, Poland, Ukraine, Moldova, Czech Republic, Hungary,<br />
Romania, Greece, the Baltic States, Caucasian Republics, Slovak Republic, Turkey, Bulgaria and the Balkans.<br />
7. This includes all other non-European markets.<br />
56
Consolidated financial statements at 31 December <strong>2012</strong> – Notes<br />
Analysis by operating segment at 31 December <strong>2012</strong><br />
31.12.<strong>2012</strong><br />
Western Eastern<br />
Costs not<br />
(million euro)<br />
Europe Europe International allocated<br />
Total<br />
Total revenue 1,664.4 1,078.0 143.5 0.0 2,886.0<br />
Cost of sales (1,240.2) (832.1) (108.3) 3.1 (2,177.5)<br />
Selling and distribution expenses (282.9) (145.6) (17.6) (20.4) (466.6)<br />
General and administrative expenses (34.6) (16.8) (1.6) (56.3) (109.3)<br />
Operating costs (1,557.8) (994.5) (127.5) (73.6) (2,753.3)<br />
Operating profit 106.7 83.5 16.1 (73.6) 132.6<br />
Interest expenses (25.8)<br />
Interest income 2.9<br />
Exchange rate differences and other net financial expenses (7.9)<br />
Share of profit (losses) of associates 0.3<br />
Income taxes (40.0)<br />
Profit attribuable to owners of the Company 62.3<br />
Analysis by operating segment at 31 December 2011<br />
31.12.2011<br />
Western Eastern<br />
Costs not<br />
(million euro)<br />
Europe Europe International allocated<br />
Total<br />
Total revenue 1,695.7 985.6 144.0 0.0 2,825.3<br />
Cost of sales (1,236.3) (744.0) (109.5) (8.6) (2,098.4)<br />
Selling and distribution expenses (278.6) (135.8) (18.8) (29.7) (462.9)<br />
General and administrative expenses (31.6) (18.8) (1.7) (61.6) (113.6)<br />
Operating costs (1,546.5) (898.6) (130.0) (99.9) (2,675.0)<br />
Operating profit 149.2 87.0 14.0 (99.9) 150.3<br />
Interest expenses (19.6)<br />
Interest income 1.9<br />
Exchange rate differences and other net financial expenses (20.4)<br />
Share of profit (losses) of associates 0.9<br />
Income taxes (54.2)<br />
Profit attribuable to owners of the Company 59.0<br />
Trade receivables analyzed by operating segment<br />
(million euro) 31.12.<strong>2012</strong><br />
% of rolling<br />
sales<br />
(12 months) 31.12.2011<br />
% of rolling<br />
sales<br />
(12 months)<br />
Western Europe 221.5 7.7% 220.6 7.8%<br />
Eastern Europe 170.8 5.9% 153.6 5.4%<br />
International 21.9 0.8% 20.6 0.7%<br />
Not allocated trade receivables 51.0 - 45.8 -<br />
Total 465.3 16.1% 440.5 15.6%<br />
57
Consolidated financial statements at 31 December <strong>2012</strong> – Notes<br />
8. Notes to the consolidated income statement<br />
8.1 Revenue<br />
Revenue is analyzed as follows:<br />
(million euro) Year <strong>2012</strong> Year 2011 Change %<br />
Revenue from finished products 2,656.8 2,615.7 1.6%<br />
Revenue from service operations 229.2 209.6 9.3%<br />
Total revenue 2,886.0 2,825.3 2.1%<br />
(million euro) Year <strong>2012</strong> Year 2011 Change %<br />
Home Care 1,196.7 1,160.4 3.1%<br />
Food Treatment 1,414.0 1,417.2 -0.2%<br />
Service and Consumer Care 275.3 247.7 11.1%<br />
Total revenue 2,886.0 2,825.3 2.1%<br />
Revenue from the provision of services relates to services provided to customers (transport) and end<br />
consumers (after-sales maintenance), to the sale of extended warranties beyond the legal minimum<br />
period, and to the sale of spare parts.<br />
Revenue from finished products increased due to a rise in the volume of sales (+1.8%) and the effect<br />
of positive exchange-rate movements (+2.4%). These effects were partially offset by a 2.6% decline<br />
attributable to changes in the price/mix.<br />
Revenue from services was 9.3% higher, essentially due to the increased sales of extended warranties in<br />
the UK, where demand is greatest.<br />
8.2 Cost of sales<br />
Cost of sales comprises the cost of raw materials and components, external processing, direct<br />
and indirect labor, the depreciation of property, plant and equipment, internal movements<br />
and logistics, inventory write-downs, provisions for product warranty and provisions for risks<br />
and charges, as well as research costs, development costs that are not capitalized and all other<br />
production overheads.<br />
Cost of sales is analyzed below by nature:<br />
(million euro) Year <strong>2012</strong> Year 2011<br />
Change in the inventories of finished products (6.3) (8.0)<br />
Purchase of raw materials. components, materials and change in inventories (1,650.7) (1,597.0)<br />
Services (147.1) (141.0)<br />
Payroll costs (272.9) (274.6)<br />
Depreciation and amortization (89.4) (90.8)<br />
Other expenses (40.2) (19.4)<br />
Other income 29.2 32.5<br />
Cost of sales (2,177.5) (2,098.4)<br />
The cost of sales absorbed 75.5% of revenue, compared with 74.3% in 2011.<br />
58
Consolidated financial statements at 31 December <strong>2012</strong> – Notes<br />
The change in the incidence of cost of sales revenues compared with the previous year relates mainly<br />
to higher costs for the consumption of raw materials, components and supplies due to the increase in<br />
raw material prices recognised in <strong>2012</strong>.<br />
Other expenses rose by 20.8 million euro, largely because of higher restructuring charges and<br />
insurance costs.<br />
Research costs totaling 7.0 million euro (8.3 million euro) were charged to the income statement.<br />
The net non-recurring income included in cost of sales totals 5.5 million euro (net income for 4.8<br />
million euro). Further information is provided in note 8.5.<br />
8.3 Selling and<br />
distribution<br />
expenses<br />
Selling and distribution expenses comprise all the costs incurred to commercialise products, including<br />
advertising and promotion, and provide after-sales services, as well as the cost of distributing products<br />
to the Group’s warehouses and to customers.<br />
Selling and distribution expenses are analyzed below by nature.<br />
(million euro) Year <strong>2012</strong> Year 2011<br />
Change in the inventories of finished products (0.4) (0.6)<br />
Purchase of raw materials. components, materials and change in inventories (7.2) (6.7)<br />
Services (337.9) (338.9)<br />
Payroll costs (93.7) (96.0)<br />
Depreciation and amortization (7.5) (7.1)<br />
Other expenses (40.5) (18.5)<br />
Other income 20.5 4.9<br />
Selling and distribution expenses (466.6) (462.9)<br />
The principal services consisted of distribution and storage expenses of about 225.5 million euro (214.6<br />
million euro).<br />
Selling and distribution expenses were essentially in line with those for the prior year.<br />
Other expenses mainly comprise provisions, the impairment losses on receivables and taxes<br />
other than income taxes. The increase in this caption principally reflects the impairment losses<br />
on receivables recognised by <strong>Indesit</strong> Company UK for starting of the procedure concorsule of a<br />
distributor.<br />
The net non-recurring income included in selling and distribution expenses totals 12.6 million euro<br />
(net income for 4.8 million euro). Further information is provided in note 8.5.<br />
59
Consolidated financial statements at 31 December <strong>2012</strong> – Notes<br />
8.4 General and<br />
administrative<br />
expenses<br />
General and administrative expenses include all general management and administrative costs, and<br />
all expenditure not directly attributable to production or sales units or to research and development.<br />
General and administrative expenses are analyzed below by nature:<br />
(million euro) Year <strong>2012</strong> Year 2011<br />
Purchase of raw materials. components, materials and change in inventories 0.2 (0.3)<br />
Services (50.3) (53.0)<br />
Payroll costs (54.8) (55.9)<br />
Depreciation and amortization (13.0) (14.5)<br />
Other expenses (12.1) (10.4)<br />
Other income 20.7 20.6<br />
General and administrative expenses (109.3) (113.6)<br />
The net non-recurring income included in general and administrative expenses totals 4.4 million euro<br />
(net expenses of 0.9 million euro). Further information is provided in note 8.5.<br />
The decrease in service costs mainly reflects the reduction in outsourcing costs and other services<br />
obtained from third parties.<br />
The reduction in payroll costs is discussed in the following note.<br />
8.5 Operating profit<br />
Operating profit is analyzed below by type of cost:<br />
(million euro) Year <strong>2012</strong> Year 2011<br />
Revenue 2,886.0 2,825.3<br />
Change in the inventories of finished products (6.8) (8.7)<br />
Purchase of raw materials. components, materials and change in inventories (1,657.6) (1,604.1)<br />
Services (535.3) (532.9)<br />
Payroll costs (421.3) (426.5)<br />
Depreciation and amortization (109.9) (112.4)<br />
Other income and expenses (22.4) 9.6<br />
Operating profit 132.6 150.3<br />
Operating profit is analyzed further in the <strong>Report</strong> on operations.<br />
The change in inventories is analyzed by nature below:<br />
(million euro) Year <strong>2012</strong> Year 2011<br />
Raw materials and semi-finished products 6.0 15.9<br />
Finished products (6.8) (8.7)<br />
Total change in inventories (0.8) 7.2<br />
Compared with the prior year, the reduction of operating profit is represented by the higher cost of<br />
raw materials and semi-finished products due, in the main, to the increased volume of production and<br />
the rise in raw material prices.<br />
60
Consolidated financial statements at 31 December <strong>2012</strong> – Notes<br />
Payroll costs were about 1.2% higher than in the prior year.<br />
This decrease is attributable to the UK pension fund (as described in note 9.22), containment measures<br />
carried out during the year and remuneration trends in variable.<br />
A partial compensation of these effects are to highlight the positive change in production levels (about<br />
2% compared to 2011), the trend of the effects of inflation and currency of the nations in which most<br />
of the production facilities of the Group’s factories are located (Russia, Poland and Turkey).<br />
The number of employees at 31 December <strong>2012</strong> is 16,331 (16,112).<br />
Employment is analyzed as follows 8 :<br />
Year <strong>2012</strong> Year 2011<br />
Executives 141 136<br />
Office workers 4,336 4,401<br />
Factory workers 11,854 10,575<br />
Total 16,331 16,112<br />
In geographical terms, 27% of employees are based in Italy, 29% in the Russian Federation,<br />
19% in Poland, 15% in the UK and Ireland, 6% in Turkey and the remaining 4% in other Group<br />
locations.<br />
As required by Consob 9 , non-recurring items are detailed in the following tables. They mainly<br />
comprise restructuring charges.<br />
(million euro) Year <strong>2012</strong> Year 2011<br />
Redundancies (17.7) (1.0)<br />
Charges for disposal of assets in Industrial areas involved in restructuring plans (1.4) (7.4)<br />
Start up charges in new industrial areas (1.4) (0.5)<br />
Gain/loss on disposal of non-strategic assets - 2.2<br />
Gains on pension fund 43.6 15.0<br />
Provisions for legal disputes 0.3 0.3<br />
Other non-recurring income and expenses (1.0) 0.1<br />
Total non-recurring income and expenses 22.5 8.8<br />
The non-recurring income relating to the pension fund includes the positive effect of a change<br />
in Pension Fund rules at <strong>Indesit</strong> Company UK Ltd., about 44.0 million euro, following the<br />
application of a different inflation adjustment parameter (CPI) when measuring the deferred<br />
pension liability.<br />
Redundancies mainly comprise the cost of the actions taken in relation to the None factory.<br />
8. In <strong>2012</strong> was adopted a different classification in relation to Field Service Engineer. Therefore the 2011 data were<br />
reconditioned.<br />
9. Consob Communication DEM/6064293 dated 28 July 2006.<br />
61
Consolidated financial statements at 31 December <strong>2012</strong> – Notes<br />
The cost of closing activities in certain industrial areas mainly reflects the impairment of property, plant<br />
and equipment and other costs associated with factory closures.<br />
Net provisions for legal disputes relate to the litigation in progress.<br />
The non-recurring items included in cost of sales, selling and distribution expenses, and general and<br />
administrative expenses are detailed below.<br />
(million euro)<br />
Cost of sales<br />
Selling and<br />
distribution<br />
expenses<br />
General and<br />
administrative<br />
expenses Year <strong>2012</strong><br />
Restructuring expenses (13.7) (2.9) (1.1) (17.7)<br />
Other non-recurring income and expenses 19.2 15.5 5.5 40.2<br />
Total non-recurring income and expenses 5.5 12.6 4.4 22.5<br />
(million euro)<br />
Cost of sales<br />
Selling and<br />
distribution<br />
expenses<br />
General and<br />
administrative<br />
expenses Year 2011<br />
Restructuring expenses 1.8 (1.3) (1.5) (1.0)<br />
Other non-recurring income and expenses 3.0 6.2 0.6 9.7<br />
Total non-recurring income and expenses 4.8 4.8 (0.9) 8.8<br />
Attachment 3 (Consolidated income statement for the year ended 31 December <strong>2012</strong>, prepared<br />
pursuant to Consob Resolution 15519 dated 27 July 2006 and Consob Communication DEM/6064293<br />
dated 28 July 2006) summarizes the overall effect of non-recurring items on the consolidated income<br />
statement.<br />
Non-recurring items do not have an immediate cash flow effect with regard to the redundancy<br />
incentive costs recognised in accordance with IAS 37 (incurred on average over the twelve months<br />
following accounting recognition); the provisions recognised for risks (often not possible to determine<br />
when they will crystallize); impairment losses (no cash flow effect), and changes in the pension fund<br />
liability as a result of non-recurring phenomena.<br />
8.6 Interest expense,<br />
interest income,<br />
exchange rate<br />
differences,<br />
other financial<br />
expenses and<br />
share of profit/<br />
loss of associates<br />
and other<br />
Interest expense comprises:<br />
(million euro) Year <strong>2012</strong> Year 2011<br />
Bond interests (3.1) (4.7)<br />
Interest on medium- and long-term bank loans (1.7) (0.9)<br />
Interest on short-term bank, loan and borrowings (11.8) (6.2)<br />
Other interest expenses (7.3) (4.9)<br />
Mark-to-market derivatives related to loans 0.0 (0.9)<br />
Interest expenses on pension funds and post-employment benefits UK (1.9) (2.0)<br />
Interest expenses (25.8) (19.6)<br />
This increase was due to higher average borrowing, a broadening of the market spreads for<br />
short-term debt and the change of the impact on the income statement of the interest-rate swap,<br />
which converted part of the floating-rate debt into fixed-rate debt (see note 11). The reduction in the<br />
reference rates made a positive contribution.<br />
62
Consolidated financial statements at 31 December <strong>2012</strong> – Notes<br />
Other interest expense was adversely influenced by the decline in long-term interest rates which<br />
affected the discounting of the provisions for risks and charges.<br />
Interest income is analyzed below:<br />
(million euro) Year <strong>2012</strong> Year 2011<br />
Interest income on deposits 2.0 1.5<br />
Interest income on UK pension scheme 1.0 0.3<br />
Interest income 2.9 1.9<br />
The change in interest income was due to the rise in the average liquidity employed. The rise in interest<br />
income relating to the UK pension funds was due to greater remuneration of the assets servicing the<br />
pension plan.<br />
Exchange differences and other net financial charges are analyzed below:<br />
(million euro) Year <strong>2012</strong> Year 2011<br />
Net realised exchange rate differences (15.7) (7.6)<br />
Net unrealised exchange rate differences 13.2 (8.8)<br />
Commissions (5.3) (4.0)<br />
Exchange rate differences and other financial expenses (7.9) (20.4)<br />
The marked reduction in exchange-rate fluctuations principally reflects the beneficial effect of<br />
measuring the currency options recognized as cash flow hedges.<br />
The improvement in the net unrealized exchange rate differences was due to favorable movements<br />
in the exchange rates of currencies other than the functional currency including, in particular, the<br />
Polish zloty and the Turkish lira. The deterioration in net realized exchange differences was a result of<br />
measuring the derivatives that hedge transaction risk.<br />
See note 11 for information about the derivatives outstanding at 31 December <strong>2012</strong>.<br />
Income from other investments was as follows:<br />
(million euro) Year <strong>2012</strong> Year 2011<br />
Other investments 0.3 0.9<br />
Share of profit (loss) of associates and other 0.3 0.9<br />
8.7 Income taxes<br />
(million euro) Year <strong>2012</strong> Year 2011<br />
Current taxes (43.4) (57.4)<br />
Change in deferred tax assets/liabilities, net 3.4 3.2<br />
Total (40.0) (54.2)<br />
Current income taxes include IRAP of 4.1 million euro (5.6 million euro).<br />
The income tax expense for <strong>2012</strong> was 40.0 million euro (54.2 million euro), with an effective tax rate of<br />
39.1% (47.9%).<br />
63
Consolidated financial statements at 31 December <strong>2012</strong> – Notes<br />
The lower incidence of taxation on pre-tax profit was principally attributable to the tax liability of 8.4<br />
million euro recognized in 2011. This was recognised following objections made to <strong>Indesit</strong> Company<br />
S.p.A. by the Marche Tax Authorities about transfer pricing, and the interest charged on the deferred<br />
payment terms allowed to Group companies.<br />
The following table reconciles the theoretical tax charge, determined using the current tax rate in Italy,<br />
with the tax charge reported in the consolidated financial statements:<br />
(million euro) Year <strong>2012</strong> Year 2011<br />
Profit before tax 102.3 113.2<br />
Tax rate 27.5% 27.5%<br />
Theoretical tax charge (28.1) (31.1)<br />
Effective tax charge (40.0) (54.2)<br />
Difference (11.9) (23.1)<br />
Effects relating to the Parent and companies based in Italy<br />
IRAP (4.1) (5.6)<br />
Effect of taxation on dividends of subsidiaries to be distributed (0.0) (2.9)<br />
Other effects (9.8) (14.4)<br />
Total effects relating to the Parent and companies based in Italy (14.0) (23.0)<br />
Effects relating to companies operating in other countries and tax differentials<br />
with respect to companies based in Italy 2.1 (0.1)<br />
Total difference (11.9) (23.1)<br />
8.8 Results<br />
attributable to<br />
non-controlling<br />
interests<br />
The results attributable to non-controlling interests relate to Fabrica Portugal S.A.<br />
64
Consolidated financial statements at 31 December <strong>2012</strong> – Notes<br />
9. Notes to the consolidated statement of financial position<br />
9.1 Property, plant<br />
and equipment<br />
During the year <strong>2012</strong>, investments were made to 116.8 million euro (110.3 million euro). Investments in<br />
tangible fixed assets mainly relate to the replacement of plant and investment in new production lines.<br />
Land and buildings include the fair value of assets recognized on the acquisition of GDAH in 2002.<br />
These assets were fully depreciated.<br />
Depreciation, amortization and impairment losses amounted to 79.8 million euro (80.3 million euro).<br />
The amount of orders to suppliers relating to tangible assets not yet fulfilled is equal to 25.3 million<br />
euro (4.9 million euro) relating to the completion of the lines to new projects.<br />
Advances to suppliers of fixed assets not yet delivered or unrealized amounted to 0.2 million euro (0.2<br />
million euro).<br />
The Net disposals and retirements, amounting to 15.3 million euro (12.0 million euro), mainly relate to<br />
the different classification of certain tangible assets reclassified as available for sale (for more details,<br />
please refer to paragraph 9.21).<br />
Assets under construction, amounting to 50.1 million euro (45.7 million euro), mainly refer to<br />
investments made by the Group in respect of new production lines.<br />
There are no liens on the ownership of property.<br />
Property, plant and equipment are analyzed as follows:<br />
(million euro) 31.12.<strong>2012</strong> 31.12.2011<br />
Land and buildings 255.5 248.8<br />
Plant and machinery 251.0 227.6<br />
Industrial and commercial equipment 93.9 80.3<br />
Assets under construction 50.1 45.7<br />
Other assets 22.5 20.7<br />
Total property, plant and equipment 673.1 623.2<br />
65
Consolidated financial statements at 31 December <strong>2012</strong> – Notes<br />
The change in the historical cost of property, plant and equipment is shown below:<br />
(million euro) 31.12.2011 Additions<br />
Depreciation<br />
and<br />
impairment<br />
losses<br />
Decreases<br />
Exchange<br />
rate<br />
differences<br />
Reclassifications<br />
31.12.<strong>2012</strong><br />
Land and buildings 397.0 17.2 - (26.1) 13.4 5.2 406.7<br />
Plant and machinery 681.2 28.2 - (13.1) 20.8 21.2 738.3<br />
Industrial and commercial equipment 396.4 20.0 - (14.0) 1.1 14.5 418.1<br />
Assets under construction 45.7 46.8 - - 3.8 (46.2) 50.1<br />
Other assets 89.0 4.6 - (2.4) 0.8 1.1 93.1<br />
Total 1,609.2 116.8 - (55.5) 39.9 (4.2) 1,706.2<br />
(million euro) 31.12.2010 Additions<br />
Depreciation<br />
and<br />
impairment<br />
losses<br />
Decreases<br />
Exchange<br />
rate<br />
differences<br />
Reclassifications<br />
31.12.2011<br />
Land and buildings 417.1 3.7 - (15.6) (13.5) 5.4 397.0<br />
Plant and machinery 721.1 30.8 - (72.2) (26.2) 27.6 681.2<br />
Industrial and commercial equipment 409.9 24.6 - (46.9) (8.8) 17.6 396.4<br />
Assets under construction 53.8 50.1 - (5.0) (1.9) (51.3) 45.7<br />
Other assets 92.8 1.2 - (4.2) (1.6) 0.8 89.0<br />
Total 1,694.7 110.3 - (143.8) (52.0) 0.0 1,609.2<br />
The changes in the related accumulated depreciation were as follows:<br />
(million euro) 31.12.2011 Additions<br />
Depreciation<br />
and<br />
impairment<br />
losses<br />
Decreases<br />
Exchange<br />
rate<br />
differences<br />
Reclassifications<br />
31.12.<strong>2012</strong><br />
Land and buildings (148.2) - (10.6) 11.2 (3.6) (0.0) (151.2)<br />
Plant and machinery (453.5) - (37.9) 12.9 (9.7) 1.0 (487.2)<br />
Industrial and commercial equipment (316.1) - (27.4) 13.9 (0.5) 5.9 (324.2)<br />
Other assets (68.2) - (3.9) 2.2 (0.7) (0.1) (70.8)<br />
Total (986.0) - (79.8) 40.2 (14.5) 7.0 (1,033.4)<br />
(million euro) 31.12.2010 Additions<br />
Depreciation<br />
and<br />
impairment<br />
losses<br />
Decreases<br />
Exchange<br />
rate<br />
differences<br />
Reclassifications<br />
31.12.2011<br />
Land and buildings (145.2) - (13.6) 10.2 1.5 (1.1) (148.2)<br />
Plant and machinery (499.8) - (38.0) 70.9 12.2 1.1 (453.5)<br />
Industrial and commercial equipment (341.4) - (24.9) 46.1 4.1 0.0 (316.1)<br />
Other assets (71.1) - (3.9) 4.7 2.1 (0.0) (68.2)<br />
Total (1,057.5) - (80.3) 131.9 19.9 (0.0) (986.0)<br />
66
Consolidated financial statements at 31 December <strong>2012</strong> – Notes<br />
The changes in the net carrying amount of property, plant and equipment are summarized in the<br />
following table:<br />
Depreciation<br />
(million euro) 31.12.2011 Additions<br />
and<br />
impairment<br />
losses Decreases<br />
Exchange<br />
rate<br />
differences<br />
Reclassifications<br />
31.12.<strong>2012</strong><br />
Land and buildings 248.8 17.2 (10.6) (14.9) 9.8 5.2 255.5<br />
Plant and machinery 227.6 28.2 (37.9) (0.2) 11.1 22.1 251.0<br />
Industrial and commercial equipment 80.3 20.0 (27.4) (0.1) 0.7 20.4 93.9<br />
Assets under construction 45.7 46.8 - - 3.8 (46.2) 50.1<br />
Other assets 20.7 4.6 (3.9) (0.2) 0.1 1.0 22.5<br />
Total 623.2 116.8 (79.8) (15.3) 25.5 2.5 673.1<br />
Depreciation<br />
(million euro) 31.12.2010 Additions<br />
and<br />
impairment<br />
losses Decreases<br />
Exchange<br />
rate<br />
differences<br />
Reclassifications<br />
31.12.2011<br />
Land and buildings 271.9 3.7 (13.6) (5.4) (12.0) 4.2 248.8<br />
Plant and machinery 221.3 30.8 (38.0) (1.3) (13.9) 28.8 227.6<br />
Industrial and commercial equipment 68.5 24.6 (24.9) (0.9) (4.7) 17.6 80.3<br />
Assets under construction 53.8 50.1 - (5.0) (1.9) (51.3) 45.7<br />
Other assets 21.7 1.2 (3.9) 0.5 0.5 0.7 20.7<br />
Total 637.2 110.3 (80.3) (12.0) (32.1) 0.0 623.2<br />
Finance leases<br />
Non-cancellable<br />
operating leases<br />
The Group was not party to any significant finance leases during <strong>2012</strong>.<br />
The minimum future payments for non-cancellable operating leases are analyzed by maturity as<br />
follows:<br />
(million euro) 31.12.<strong>2012</strong> 31.12.2011<br />
Within 1 year 13.4 14.0<br />
Between 1 and 5 years 33.5 33.2<br />
Beyond 5 years 21.4 23.8<br />
Total minimun lease payments 68.3 71.0<br />
The principal non-cancellable operating leases relate to the Radomsko warehouse in Poland and the<br />
Uxbridge office in the UK. These contracts expire in April 2024 and July 2013 respectively. Neither<br />
contract envisages the possibility of renewal or purchase of the assets concerned.<br />
The income statement reflects rental charges incurred under operating leases on an accruals basis, 20.2<br />
million euro (17.8 million euro).<br />
67
Consolidated financial statements at 31 December <strong>2012</strong> – Notes<br />
9.2 Goodwill and<br />
other intangible<br />
assets with an<br />
indefinite useful<br />
life<br />
Goodwill and other intangible assets with an indefinite useful life are analyzed as follows:<br />
(million euro) 31.12.<strong>2012</strong> 31.12.2011<br />
Goodwill 135.4 132.3<br />
Brands with an indefinite useful life 106.8 104.2<br />
Other intangible assets with an indefinite useful life - -<br />
Total goodwill and other intangible assets with an indefinite useful life 242.2 236.5<br />
The changes in the net carrying amount of goodwill and other intangible assets with an indefinite<br />
useful life are summarized in the following table:<br />
Exchange<br />
(million euro) 31.12.2011<br />
Impairment<br />
losses<br />
rate<br />
differences 31.12.<strong>2012</strong><br />
Goodwill 132.3 - 3.1 135.4<br />
Brands with an indefinite useful life 104.2 0.2 2.5 106.8<br />
Total 236.5 0.2 5.6 242.2<br />
Exchange<br />
(million euro) 31.12.2010<br />
Impairment<br />
losses<br />
rate<br />
differences 31.12.2011<br />
Goodwill 128.6 (0.2) 3.9 132.3<br />
Brands with an indefinite useful life 101.1 - 3.1 104.2<br />
Total 229.7 (0.2) 7.0 236.5<br />
At 31 December <strong>2012</strong> the caption Brands with an indefinite useful life comprises solely the amounts<br />
recognised on the acquisition of General Domestic Appliances Holding Ltd. (GDAH), a UK company, in<br />
2002.<br />
On allocating the purchase price of GDAH, 87.0 million pounds was attributed to brands with an<br />
indefinite life and 110.5 million pounds to goodwill. These amounts, denominated in British pounds,<br />
are subject to exchange rate fluctuations arising on the translation to euro.<br />
The Hotpoint brand with an indefinite life is allocated to the UK CGU, since it is the leader of the UK<br />
market for household appliances.<br />
The goodwill recognized at the time of acquisition using current exchange rates was allocated both to<br />
the UK CGU representing the UK market, 33.2 million euro, and to the Group as a whole (Group CGU),<br />
102.2 million euro, in view of the synergies deriving from the acquisition and attributable, in general,<br />
to economies in the scale of purchasing, production, brand management and relations with major<br />
distributors that could not be allocated to specific CGUs.<br />
(million euro) 31.12.<strong>2012</strong> 31.12.2011<br />
CGU UK goodwill 33.2 32.5<br />
Other Group CGU goodwill 102.2 99.8<br />
Hotpoint brand 106.8 104.2<br />
Total intangible assets with an indefinite useful life 242.2 236.5<br />
68
Consolidated financial statements at 31 December <strong>2012</strong> – Notes<br />
The value of intangible assets with an indefinite life is subjected to impairment testing at least once<br />
every year. The tests performed at 31 December <strong>2012</strong> and 31 December 2011 did not identify any need<br />
to adjust the carrying amount of these assets.<br />
The recoverable value of the CGUs is based on their value in use, determined by applying<br />
DCF techniques over a five-year period (2013-2017) and to the terminal value, considering the<br />
forecasts prepared by management and approved by the directors at the board meeting held on<br />
21 March 2013.<br />
The principal assumptions underpinning the strategic plans of the Group CGU are set out below:<br />
• sales volume are expected to rise at a compound annual growth rate (CAGR) of around 2.0%;<br />
• average unit revenues in euro are expected to be substantially constant (CAGR of 0.2%);<br />
• advertising and promotion expenses are expected to rise during the plan period at a rate of 9.5%;<br />
• annual investment during the plan period is expected to average 120 million euro;<br />
• exchange rates are forecast to remain stable over the plan period at the following levels: GBP/euro<br />
at 0.81, RUB/euro at 41.00, PLN/euro at 4.00, TRY/euro at 2.28;<br />
• net working capital is expected to rise during the plan period.<br />
The principal assumptions underpinning the plans of the UK CGU are set out below:<br />
• sales volumes are expected to increase slightly to a compound annual growth rate (CAGR) around<br />
0.4%;<br />
• the trend in average unit revenue is expected to be substantially constant (CAGR -0.2%);<br />
• spending on advertising and promotion follows the same trend as the Group CGU;<br />
• the investments are expected on average 31% of the total amount of the CGU Group;<br />
• changes are assumed stable in the plan at the following levels: GBP/euro 0.81, RUB/euro 41.00, PLN/<br />
Euro 4.00, TRY/euro to 2.28;<br />
• net working capital is expected to increase during the plan period.<br />
Forecast cash flows have been discounted using a weighted-average cost of capital (WACC) of 8.44%<br />
(9.29%) for the Group CGU and 7.05% (7.41%) for the UK CGU. The terminal value of the CGUs was<br />
determined by assuming a long-term normalized cash flow based on that generated in the final<br />
year of the explicit plan (2017), and by prudently using a nominal long-term growth factor (g) of 0%<br />
(unchanged with respect to the prior year).<br />
The higher WACC used by the Group CGU with respect to that of the UK CGU reflects the<br />
additional country risk, compared with the UK, associated with certain geographical areas of<br />
Group operation.<br />
A sensitivity analysis has been performed to simulate the value of the Group CGU and the UK CGU<br />
following changes in certain key parameters of the valuation model: the weighted average cost of<br />
capital, the nominal long-term growth factor (g), the volume of sales and selling prices. The results of<br />
this analysis highlighted a remote impairment risk, limited to combinations of values for the selected<br />
parameters that, at present, are considered somewhat unlikely.<br />
The impairment test on the UK CGU and the Group CGU was carried out internally and approved by<br />
the directors on 21 March 2013. An independent, third-party expert has issued a report on the fairness<br />
of the valuation methods and parameters used in the impairment testing process.<br />
69
Consolidated financial statements at 31 December <strong>2012</strong> – Notes<br />
9.3 Other intangible<br />
assets with a<br />
finite useful life<br />
Other intangible assets are analyzed as follows:<br />
(million euro) 31.12.<strong>2012</strong> 31.12.2011<br />
Development expenses 42.1 39.5<br />
Licences and software 27.9 29.6<br />
Brands with a finite life 14.3 16.4<br />
Intangible assets under construction 15.4 10.4<br />
Other intangible assets with finite life 4.0 4.1<br />
Total 103.8 100.1<br />
The changes in the historical cost of other intangible assets with a finite life during the year are shown<br />
below:<br />
Amortization<br />
(million euro) 31.12.2011 Increases<br />
and<br />
impairment<br />
losses Decreases<br />
Exchange<br />
rate<br />
differences<br />
Reclassification<br />
31.12.<strong>2012</strong><br />
Development expenses 91.6 16.7 - - 0.1 (4.7) 103.7<br />
Licences and software 82.7 5.8 - - 0.4 (4.6) 84.3<br />
Brands with a finite life 22.5 - - - 1.2 (0.0) 23.7<br />
Intangible assets under construction 10.4 13.2 - - 0.1 (8.3) 15.4<br />
Other intangible assets 8.0 0.2 - (0.4) 0.4 (0.2) 8.1<br />
Total 215.2 35.9 - (0.4) 2.3 (17.9) 235.2<br />
Amortization<br />
(million euro) 31.12.2010 Increases<br />
and<br />
impairment<br />
losses Decreases<br />
Exchange<br />
rate<br />
differences<br />
Reclassification<br />
31.12.2011<br />
Development expenses 82.1 14.9 - (7.3) (0.3) 2.3 91.6<br />
Licences and software 78.6 6.2 - (0.1) (1.2) (0.8) 82.7<br />
Brands with a finite life 20.9 - - - 1.5 - 22.5<br />
Intangible assets under construction 16.6 8.8 - - 0.8 (15.9) 10.4<br />
Other intangible assets 8.1 0.3 - (0.0) (0.4) (0.0) 8.0<br />
Total 206.4 30.2 - (7.5) 0.5 (14.4) 215.2<br />
70
Consolidated financial statements at 31 December <strong>2012</strong> – Notes<br />
The changes in the related accumulated amortization were as follows:<br />
(million euro) 31.12.2011 Increases<br />
Amortization<br />
and<br />
impairment<br />
losses<br />
Decreases<br />
Exchange<br />
rate<br />
differences<br />
Reclassification<br />
31.12.<strong>2012</strong><br />
Development expenses (52.1) - (16.1) - (0.2) 6.8 (61.6)<br />
Licences and software (53.1) - (11.3) - (0.4) 8.4 (56.4)<br />
Brands with a finite life (6.1) - (2.5) - (0.8) 0.0 (9.3)<br />
Other intangible assets (3.8) - (0.2) 0.0 (0.1) 0.1 (4.1)<br />
Total (115.1) - (30.1) 0.0 (1.5) 15.3 (131.4)<br />
(million euro) 31.12.2010 Increases<br />
Amortization<br />
and<br />
impairment<br />
losses<br />
Decreases<br />
Exchange<br />
rate<br />
differences<br />
Reclassification<br />
31.12.2011<br />
Development expenses (52.6) - (17.6) 7.3 0.1 10.6 (52.1)<br />
Licences and software (45.6) - (11.6) 0.1 0.2 3.8 (53.1)<br />
Brands with a finite life (2.6) - (2.3) - (1.1) (0.0) (6.1)<br />
Other intangible assets (3.6) - (0.3) 0.0 0.1 0.0 (3.8)<br />
Total (104.5) - (31.8) 7.5 (0.7) 14.4 (115.1)<br />
The changes in the net carrying amount of other intangible assets with a finite life are summarized in<br />
the following table:<br />
Amortization<br />
(million euro) 31.12.2011 Increases<br />
and<br />
impairment<br />
losses Decreases<br />
Exchange<br />
rate<br />
differences<br />
Reclassification<br />
31.12.<strong>2012</strong><br />
Development expenses 39.5 16.7 (16.1) - (0.1) 2.1 42.1<br />
Licences and software 29.6 5.8 (11.3) - (0.1) 3.8 27.9<br />
Brands with a finite life 16.4 - (2.5) - 0.4 (0.0) 14.3<br />
Assets under construction 10.4 13.2 - - 0.1 (8.3) 15.4<br />
Other intangible assets 4.1 0.2 (0.2) (0.4) 0.3 (0.1) 4.0<br />
Total 100.1 35.9 (30.1) (0.4) 0.8 (2.5) 103.8<br />
Amortization<br />
(million euro) 31.12.2010 Increases<br />
and<br />
impairment<br />
losses Decreases<br />
Exchange<br />
rate<br />
differences<br />
Reclassification<br />
31.12.2011<br />
Development expenses 29.5 14.9 (17.6) - (0.2) 12.9 39.5<br />
Licences and software 33.0 6.2 (11.6) - (1.0) 3.0 29.6<br />
Brands with a finite life 18.3 - (2.3) - 0.5 (0.0) 16.4<br />
Assets under construction 16.6 8.8 - - 0.8 (15.9) 10.4<br />
Other intangible assets 4.5 0.3 (0.3) (0.0) (0.4) 0.0 4.1<br />
Total 101.9 30.2 (31.8) (0.0) (0.2) 0.0 100.1<br />
71
Consolidated financial statements at 31 December <strong>2012</strong> – Notes<br />
Including assets in progress, the development expenses capitalized during <strong>2012</strong> totaled 16.7 million<br />
euro (14.9 million euro).<br />
The Licences and software caption comprises the capitalized internal and external cost of IT projects<br />
carried out by the Group, and the cost of licenses to use software that will benefit future years. The<br />
average residual life of these intangible assets is 3 years.<br />
Brands with a finite life include the Cannon brand, recognised on the acquisition of GDAH. The <strong>2012</strong><br />
amortisation charge relating to the above trademark was 2.5 million euro.<br />
Other intangible assets principally comprise industrial patents with an average residual life of 5 years.<br />
9.4 Investments<br />
in associates<br />
Investments in associates mainly comprise the Group’s interest in TradePlace B.V. amounting to<br />
0.5 million euro (0.5 million euro).<br />
9.5 Other noncurrent<br />
assets<br />
Other non-current assets are analyzed below:<br />
(million euro) 31.12.<strong>2012</strong> 31.12.2011<br />
Non-current Special Economic Zone 27.8 28.7<br />
Surplus on Pension fund 63.3 11.7<br />
Other investments 0.9 0.6<br />
Total other non-current assets 92.0 41.0<br />
The non-current portion of the tax receivables relating to the Polish Special Economic Zone (incentives<br />
for the construction of factories) amounts to 27.8 million euro (28.7 million euro). These receivables are<br />
matched by deferred grants from the Government, classified as other non-current liabilities, which are<br />
discussed in note 9.17.<br />
This caption also includes the carrying amount, 0.4 million euro (0.6 million euro), of the investments in<br />
other companies in which, in general, the Group holds less than 20% of share capital or voting rights.<br />
The surplus on pension fund, 63.3 million euro, relates to the pension fund operated by <strong>Indesit</strong><br />
Company UK Ltd. (63,1 million euro). It primarily reflects the effect of the actuarial gains and losses<br />
(91.8 million euro) not recognized due to application of the corridor method. The net amount exceeds<br />
the deficit pension fund (28.7 million euro) 10 . The residual element relates to <strong>Indesit</strong> Company<br />
International B.V., 0.2 million euro.<br />
The equity investments held by <strong>Indesit</strong> Company are not listed and their securities are not traded in<br />
a regulated market. Accordingly, their fair value cannot be determined reliably since there were no<br />
transactions involving these securities during the past year.<br />
10. Further details are provided in note 9.14.<br />
72
Consolidated financial statements at 31 December <strong>2012</strong> – Notes<br />
9.6 Deferred tax<br />
assets<br />
Deferred tax assets and the related changes during the year are analyzed in the following table:<br />
(million euro) 31.12.2011<br />
Taken to<br />
income<br />
statement<br />
Taken to<br />
equity<br />
Exchange<br />
rate effect<br />
Other<br />
movements<br />
Reclassification<br />
31.12.<strong>2012</strong><br />
Property, plant and equipment (1.1) 5.3 0.0 (0.1) 0.0 0.0 4.2<br />
Intangible assets (0.6) (0.4) 0.0 0.0 0.0 0.0 (1.0)<br />
Inventories 0.4 4.3 0.0 (0.2) 0.0 0.0 4.6<br />
Financial liabilities 0.9 0.9 (1.0) 0.0 0.0 0.0 0.9<br />
Pension fund 1.9 (0.1) 0.1 0.0 0.0 0.0 1.9<br />
Provisions for risks 26.5 (2.7) 0.0 0.3 0.0 0.0 24.1<br />
Tax consolidation and other non-deductible<br />
expenses 25.6 (5.0) 0.2 1.1 (0.0) (3.2) 18.8<br />
Tax losses carried forward 21.8 15.3 0.0 0.3 (3.3) 3.2 37.2<br />
Total 75.4 17.6 (0.6) 1.6 (3.3) 0.0 90.7<br />
Amounts offset (11.1) (1.9) 0.0 0.0 0.0 0.0 (13.0)<br />
Total net 64.3 15.7 (0.6) 1.7 (3.3) 0.0 77.7<br />
The deferred tax assets recognised in relation to carried-forward tax losses have increased by<br />
15.4 million euro. This amount, primarily recognized by the Parent, <strong>Indesit</strong> Company France S.A. and<br />
<strong>Indesit</strong> Company Polska Sp.zo.o., is stated net of utilizations by <strong>Indesit</strong> Company International Business<br />
S.A., as well as the exchange rate effect.<br />
Other movements include a reduction in deferred tax assets of 3.3 million euro relating to <strong>Indesit</strong><br />
Company UK Holdings Ltd. This follows utilization of the related tax losses by other UK Group<br />
companies belonging to the tax group.<br />
The amounts offset relate to deferred tax liabilities that reduce these deferred tax assets since they<br />
are due to the same tax authorities, are legally offsettable and relate to temporary differences that will<br />
reverse at the same time.<br />
The deferred tax assets recognised in relation to prior-year tax losses amount to 37.2 million euro<br />
(21.8 million euro), while those not recognised amount to 22.8 million euro (48.6 million euro). The<br />
details are analyzed in the following table:<br />
Company Tax losses Recoverability Tax rate<br />
Deferred<br />
tax assets<br />
recognised<br />
Deferred tax<br />
assets not<br />
recognised<br />
Total<br />
<strong>Indesit</strong> Company S.p.A. 115.2 unlimited 27.5% 25.5 6.2 31.7<br />
<strong>Indesit</strong> Company Electrodomesticos S.A. 42.4 15 years 30.0% - 12.7 12.7<br />
<strong>Indesit</strong> Company France S.A. 17.6 3 years 35.0% 6.1 - 6.1<br />
<strong>Indesit</strong> Company UK Holdings Ltd. 7.5 unlimited 24.5% 1.8 - 1.8<br />
<strong>Indesit</strong> Company Polska Sp.zo.o. 17.6 5 years 19.0% 3.4 - 3.4<br />
<strong>Indesit</strong> Company Beyaz Esya Sanayi ve Ticaret A.S. 1.5 unlimited 20.0% - 0.3 0.3<br />
<strong>Indesit</strong> Ukraine LLC 2.7 unlimited 19.0% 0.5 - 0.5<br />
<strong>Indesit</strong> Company Portugal Electrodomésticos S.A. 13.6 4/6 years 26.5% - 3.6 3.6<br />
Total 218.1 37.2 22.8 60.1<br />
73
Consolidated financial statements at 31 December <strong>2012</strong> – Notes<br />
9.7 Inventories<br />
Inventories are analyzed as follows:<br />
(million euro) 31.12.<strong>2012</strong> 31.12.2011<br />
Raw materials 134.4 123.4<br />
Obsolescence provision (2.4) (2.2)<br />
Total raw materials 132.0 121.2<br />
Finished products and semi-finished products 183.7 185.0<br />
Obsolescence provision (11.9) (11.2)<br />
Total finished products and semi-finished products 171.8 173.9<br />
Spare parts 30.9 30.4<br />
Obsolescence provision (3.0) (2.2)<br />
Total spare parts 28.0 28.1<br />
Total inventories 331.8 323.2<br />
Inventories have increased overall by 8.6 million euro since the end of 2011, mainly due to the rise in<br />
raw material prices.<br />
9.8 Trade<br />
receivables<br />
Trade receivables comprise amounts due from customers as a result of commercial transactions and<br />
the provision of services, stated net of the allowance for doubtful accounts The allowance for doubtful<br />
accounts totals 30.1 million euro (33.6 million euro) at 31 December <strong>2012</strong>. The net provisions and losses<br />
during the year amounted to 26.6 million euro (7.1 million euro). The increase relates to the losses<br />
recognized by <strong>Indesit</strong> Company UK Ltd. (see the note 8.3).<br />
Trade receivables are analyzed below:<br />
(million euro) 31.12.<strong>2012</strong> 31.12.2011<br />
Trade receivables 495.4 474.2<br />
Allowance for doubtful accounts (30.1) (33.6)<br />
Net trade receivables 465.3 440.5<br />
Fund % on trade receivables 6.1% 7.1%<br />
The reduction in the percentage of allowance for doubtful accounts is due to an improvement in the<br />
process of granting credit.<br />
As part of the diversification of sources of finance, during the year the Group sold trade receivables in<br />
the UK and Poland and maintained the securitization program.<br />
The securitization involves the without-recourse sale of trade receivables, on a revolving basis, by the<br />
Parent and by <strong>Indesit</strong> Company France S.A. The receivables are acquired by vehicle companies, which<br />
are financed by the issue of securities whose repayment is guaranteed by the cash flows generated<br />
by the portfolio of receivables sold (asset-backed securities). There are two classes of asset-backed<br />
security: the senior securities are placed in the market and subscribed for by institutional investors; the<br />
junior securities, whose repayment is subordinated to that of the senior securities, are taken up by the<br />
Group. Consistent with SIC 12 - Consolidation - Special-purpose entities (“SPE”), the Group consolidates<br />
vehicle companies on a line-by-line basis, even though it has no equity interest in them and does not<br />
exercise any form of control over their administrative bodies.<br />
74
Consolidated financial statements at 31 December <strong>2012</strong> – Notes<br />
The net financial liabilities to third parties of the consolidated vehicle companies amount to<br />
62.0 million euro at 31 December <strong>2012</strong>, comprising senior securities issued on the ABS market,<br />
87.1 million euro, net of the cash held by them, 25.0 million euro.<br />
At the same date, the liability of Group operating companies to vehicle companies for receivables sold<br />
but not yet collected amounts to 115.7 million euro, while their financial receivables represented by<br />
junior securities total 51.0 million euro.<br />
The without-recourse sale of UK and Polish receivables reduced trade receivables by 30.8 million euro,<br />
being the amount sold but not collected by 31 December <strong>2012</strong> (23.4 million euro in UK).<br />
The concentration risk associated with the 10 largest customers is 19.9% (21.3% in 2011) of total gross<br />
performing receivables.<br />
Trade receivables are analyzed by maturity below:<br />
(million euro) 31.12.<strong>2012</strong> 31.12.2011<br />
Receivables not overdue 458.4 419.0<br />
Overdue in 1 month 0.3 10.3<br />
Overdue by 1 to 3 months 5.2 9.6<br />
Overdue by 3 to 6 months 1.5 1.7<br />
Total overdue receivables not impaired 6.9 21.5<br />
Receivables impaired 30.1 33.6<br />
Trade receivables 495.4 474.2<br />
9.9 Tax receivables<br />
Tax receivables comprise amounts due from the tax authorities in the countries in which the Group<br />
operates, principally in relation to advance taxation. These amounts are analyzed below:<br />
(million euro) 31.12.<strong>2012</strong> 31.12.2011<br />
Tax advances paid 16.3 9.2<br />
Current portion of tax receivables relating to the Special Economic Zone 4.0 3.8<br />
Total tax receivables 20.3 12.9<br />
The receivables relating to advance taxation have increased as a result of the tax repayments requested<br />
in Italy and France.<br />
The current portion of the Special Economic Zone tax receivables, deriving from the investments in<br />
Poland, has essentially remained stable. These receivables, together with the non-current portion, are<br />
matched by deferred Government grants, classified as other non-current liabilities, which are discussed<br />
in note 9.17.<br />
75
Consolidated financial statements at 31 December <strong>2012</strong> – Notes<br />
9.10 Other<br />
receivables<br />
and current<br />
assets<br />
Other receivables and current assets are analyzed as follows:<br />
(million euro) 31.12.<strong>2012</strong> 31.12.2011<br />
Due from employees 2.1 1.9<br />
Due from social security and pension institutions 3.4 4.5<br />
Grants due from public bodies 3.8 3.6<br />
VAT receivables 52.8 44.6<br />
Other receivables 13.2 13.0<br />
Total other receivables and current assets 75.4 67.8<br />
9.11 Equity<br />
attributable<br />
to the owners<br />
of the Parent<br />
Share capital comprises ordinary shares and savings shares, as analyzed below inclusive of the treasury<br />
shares held:<br />
31.12.<strong>2012</strong> 31.12.2011<br />
Description<br />
Number Euro Number Euro<br />
Ordinary shares 113,665,684 102,299,116 113,665,684 102,299,116<br />
Savings shares 511,282 460,154 511,282 460,154<br />
Total 114,176,966 102,759,270 114,176,966 102,759,270<br />
102,500 options granted in 2002, at 7.9258 euro each, expired during the year together with 2,500<br />
options granted in 2003 at 12.6479 euro each. No new stock options were granted during the<br />
year.<br />
The number of shares reported in the table is stated gross of the treasury shares held. Net of the<br />
treasury shares held directly by <strong>Indesit</strong> Company S.p.A., 11,039,750, there are 102,625,934 ordinary<br />
shares outstanding.<br />
The treasury shares classified as a reduction of equity, more specifically as a deduction from share<br />
capital and the share premium on treasury shares, amount to 33.0 million euro.<br />
The nominal value of the ordinary and savings shares is 0.90 euro.<br />
The holders of ordinary shares and savings shares enjoy the ownership and participation rights granted<br />
under Italian law and the articles of association of <strong>Indesit</strong> Company S.p.A. In addition to the right to<br />
participate in the distribution of profits and the return of capital, the ordinary shares also carry the<br />
right to vote at ordinary and extraordinary shareholders’ meetings. The savings shares, on the other<br />
hand, have greater ownership rights but reduced administrative rights. The greater ownership rights<br />
comprise:<br />
• the right to an allocation of profit for the year (after allocating 5% to the legal reserve) representing<br />
up to 5% of the nominal value of the savings shares;<br />
• the right, if a dividend of less than 5% of nominal value was paid in a given year, to collect this<br />
shortfall in the preference dividend in the following two years;<br />
• the right, if a dividend is declared at the shareholders’ meeting, to receive a total dividend that is<br />
higher than that paid on the ordinary shares by 2% of the nominal value of the savings shares.<br />
In addition, in the event of a capital reduction to cover losses, the nominal value of the savings<br />
shares is only reduced by the amount of the losses that exceed the total nominal value of the other<br />
shares.<br />
76
Consolidated financial statements at 31 December <strong>2012</strong> – Notes<br />
The lesser administrative rights with respect to the ordinary shares consist of the absence of voting<br />
rights at ordinary and extraordinary shareholders’ meetings.<br />
The outstanding stock options include 147,000 already granted and 3,002,500 not yet granted.<br />
Dividend payments during <strong>2012</strong> totaled 23.7 million euro (31.0 million euro).<br />
The description of, changes in and restrictions applying to the principal equity reserves are described<br />
below. The detailed analysis of these changes is presented in a separate schedule.<br />
Reserves<br />
The share premium reserve amounts to 35.9 million euro.<br />
The legal reserve, 22.7 million euro, reflects allocation of 5% of the Parent’s net profit each year.<br />
The cumulative translation adjustment or translation reserve is negative by 97.7 million euro, reflecting<br />
the exchange differences arising on the translation of foreign currency financial statements. The overall<br />
improvement during the year deriving from the translation of foreign currency financial statements<br />
amounts to 37.4 million euro. In particular, the appreciation of the Polish zloty contributed 18.9 million<br />
euro, the British pound, 8.1 million euro, the Russian ruble, 8.2 million euro, and the Turkish lira,<br />
3.6 million euro. These effects were offset by 1.4 million euro attributable to the depreciation of the<br />
other currencies used by the Group.<br />
Other reserves amount to 15.0 million euro. These comprise the stock options reserve, 0.4 million euro;<br />
the negative hedging reserve, 3.7 million euro; the merger surplus reserve, 1.4 million euro, and other<br />
reserves totaling 16.9 million euro, mainly in relation to capital grants (art. 14 Law 64/68, Law 488/92,<br />
Law 308/82, Law 218/78, Law 219/81).<br />
Retained earnings amount to 504.8 million euro following an increase of 58.8 million euro on allocation<br />
of the Parent’s results for 2011, and a decrease of 23.7 million euro following the payment of dividends<br />
to the shareholders of the Parent.<br />
With reference to the amounts reported in the Consolidated statement of comprehensive income, the<br />
hedging reserve increased by 5.7 million euro during <strong>2012</strong>.<br />
77
Consolidated financial statements at 31 December <strong>2012</strong> – Notes<br />
The calculations for the basic earnings per share and the diluted earnings per share reported in the<br />
consolidated income statement are set out in the following table:<br />
31.12.<strong>2012</strong> 31.12.2011<br />
Basic attributable earnings (million euro) 62.3 58.8<br />
Basic average number of ordinary shares (thousands) 102,625.9 102,625.9<br />
Ordinary EPS (without savings shares effect) 0.61 0.57<br />
Unit earnings attributed to savings shares (euro) 0.61 0.57<br />
Number of savings shares (thousands) 511.3 511.3<br />
Earnings attributed to savings shares (million euro) (0.31) (0.29)<br />
Basic attributable earnings (million euro) 62.0 58.5<br />
Basic average number of ordinary shares (thousands) 102,625.9 102,625.9<br />
Basic EPS (euro) 0.60 0.57<br />
Basic attributable earnings (million euro) 62.0 58.5<br />
Basic average number of ordinary shares (thousands) 102,625.9 102,625.9<br />
Average number of shares granted to Directors without payment (thousands) - -<br />
Average number of shares granted to employees without payment (thousands) - -<br />
Total 102,625.9 102,625.9<br />
Diluted EPS (euro) 0.60 0.57<br />
9.12 Non-controlling<br />
interests<br />
The equity attributable to non-controlling interests is unchanged.<br />
9.13 Net financial<br />
position<br />
The net financial indebtedness of the Group is analyzed below:<br />
(million euro) Note 31.12.<strong>2012</strong> 31.12.2011<br />
Current financial assets 9.13.1 29.4 20.9<br />
Cash and cash equivalents 9.13.2 142.8 234.4<br />
Banks and other short-term loans and borrowings 9.13.3 (197.8) (228.7)<br />
Net financial indebtedness position - short term (25.6) 26.6<br />
Medium and long-term loans and borrowings 9.13.4 (232.3) (246.3)<br />
Net financial position * (257.9) (219.7)<br />
Other non-current financial assets 9.13.5 1.5 1.5<br />
Total net financial indebtedness (256.4) (218.2)<br />
* As defined in CONSOB Communication DEM/6064293 dated 28 July 2006, applying the CESR recommendations dated 10<br />
February 2005.<br />
9.13.1 Current<br />
financial<br />
assets<br />
Current financial assets include the fair value adjustment of derivative financial instruments,<br />
18.4 million euro (12.0 million euro), and other current financial receivables, 11.0 million euro<br />
(8.9 million euro).<br />
78
Consolidated financial statements at 31 December <strong>2012</strong> – Notes<br />
9.13.2 Cash and cash<br />
equivalents<br />
Cash and cash equivalents include bank and postal deposits, as well as checks and other amounts on<br />
hand. The changes in liquidity during the year are analyzed in the consolidated cash flow statement.<br />
This caption includes liquidity of 25.0 million euro held by the vehicle companies for the securitization<br />
that will be used to settle the financial payables (classified as current financial liabilities) arising under<br />
the program.<br />
9.13.3 Banks and<br />
other shortterm<br />
loans<br />
and<br />
borrowings<br />
Current financial payables comprise amounts due within one year.<br />
This caption is analyzed below:<br />
(million euro) 31.12.<strong>2012</strong> 31.12.2011<br />
Current portion of bank, loans and borrowings 79.8 83.9<br />
Short-term advances for securitization 87.7 109.8<br />
Liability from the measurement of derivative instruments 7.4 16.2<br />
Current portion of bond 8.1 8.1<br />
Current portion of medium/long-term bank, loans and borrowings 14.4 10.2<br />
Current portion of other medium/long-term bank, loans and borrowings 0.5 0.4<br />
Total 197.8 228.7<br />
The current portion of bank loans and borrowings comprises bank overdrafts, the draw-down against<br />
revolving lines of credit and other short-term advances in various forms.<br />
The short-term advances for securitization relate to the amounts payable for securities issued as part of<br />
the securitization program.<br />
9.13.4 Medium<br />
and long-term<br />
loans and<br />
borrowings<br />
The medium and long-term loans and borrowings are analyzed as follows:<br />
(million euro) 31.12.<strong>2012</strong> 31.12.2011<br />
Bonds 156.8 161.0<br />
Due to banks and other financial backers 75.6 85.3<br />
Total 232.3 246.3<br />
The bonds were subscribed for by institutional investors (U.S. Private Placement) in both euro and USD.<br />
The change in the fair value of this liability is offset by the change in the fair value of the derivative<br />
arranged to hedge exchange and interest-rate risk (Cross Currency Swap and Interest Rate Swap).<br />
Further information about the cross currency swap is provided in note 11 on financial instruments.<br />
Medium/long-term loans and borrowings are analyzed by maturity in the following table:<br />
(million euro)<br />
Medium/<br />
long-term<br />
loans and<br />
borrowings<br />
Between<br />
1 and 5 years<br />
Beyond<br />
5 years<br />
Bonds 156.8 156.8 -<br />
Due to banks and other financial backers 75.6 62.8 12.8<br />
Total 232.3 219.6 12.8<br />
79
Consolidated financial statements at 31 December <strong>2012</strong> – Notes<br />
The bonds were subscribed for by institutional investors (U.S. Private Placement) in September 2004.<br />
They are analyzed in the following table:<br />
Nominal<br />
value<br />
(million USD)<br />
Nominal<br />
value<br />
(million euro)<br />
Fair value<br />
(million euro) Maturity Rate Type of hedge<br />
Notes - Series B - - -<br />
Notes - Series C 148.0 - 116.6 17.09.2014 Fixed CCS<br />
Notes - Series E 25.0 - 21.2 17.09.2016 Fixed CCS<br />
Total notes issued in USD 173.0 - 137.8<br />
Notes - Series D - 18.3 19.0 17.09.2014 Fixed IRS<br />
Total notes issued in euro 18.3 19.0<br />
Total fair value 156.8<br />
The interest rate and currency risks associated with the U.S. Private Placement have been hedged by a<br />
Cross Currency Swap, as described further in note 11 on financial instruments.<br />
The change in the fair value of the bonds, due to fluctuations in the exchange rate with the dollar,<br />
should be considered together with the change in the fair value of the Cross Currency Swap.<br />
The medium and long-term amounts due to banks and other financial payables principally comprise<br />
the amortizing line of credit made available by the EIB (maturity 2018), amounting to 62.5 million<br />
euro and the COENV loan of 1.2 million euro (maturity 2018). In addition, to add 13.2 million euro as<br />
evaluation of hedging instruments (interest rate risk and currency risk).<br />
The maturity profile of medium/long-term financial payables is presented below:<br />
Medium/long-term loans and borrowings<br />
(million euro)<br />
Total<br />
2014 2015 2016 2017 2018 Total<br />
Bonds 156.8 136.6 1.0 19.1 - - 156.8<br />
Due to banks and other financial payables 75.6 23.5 12.6 13.9 12.8 12.8 75.6<br />
Total 232.3 160.1 13.6 33.1 12.8 12.8 232.3<br />
Among other obligations, the bonds and the committed bank loans require compliance with certain<br />
financial covenants. In particular, the following parameters must be met:<br />
USPP<br />
Covenant<br />
limit at<br />
31 December<br />
Covenant<br />
limit at<br />
30 June<br />
Net financial indebtedness/EBITDA ≤ 3.0 ≤ 3.5<br />
EBITDA/Net financial expenses ≥ 3.5 ≥ 3.5<br />
Equity ≥ 320<br />
million euro<br />
≥ 320<br />
million euro<br />
80
Consolidated financial statements at 31 December <strong>2012</strong> – Notes<br />
Revolving facility<br />
Covenant<br />
limit at<br />
31 December<br />
Covenant<br />
limit at<br />
30 June<br />
Net financial indebtedness/EBITDA ≤ 3.0 ≤ 4.0<br />
EBITDA/Net financial expenses ≥ 3.5 ≥ 3.5<br />
BEI<br />
Covenant<br />
limit at<br />
31 December<br />
Covenant<br />
limit at<br />
30 June<br />
Net financial indebtedness/EBITDA ≤ 3.0 n.a.<br />
EBITDA/Net financial expenses ≥ 3.5 ≥ 3.5<br />
Equity ≥ 320<br />
million euro<br />
≥ 320<br />
million euro<br />
Securitization<br />
Covenant<br />
limit at<br />
31 December<br />
Covenant<br />
limit at<br />
30 June<br />
Net financial indebtedness/EBITDA ≤ 3.0 ≤ 3.5<br />
In addition to the financial covenants, the bonds and the committed lines of credit require <strong>Indesit</strong><br />
Company S.p.A. and, in certain cases, a number of Group companies to comply with other affirmative<br />
and negative covenants that are consistent with market standards for transactions of a similar nature,<br />
amount, maturity and risk profile.<br />
Failure to comply with these covenants would, following the elapse of a given period of time<br />
available to correct such non-compliance, give the counterparts a right to require the early repayment<br />
of the related borrowings. The above parameters are monitored constantly by the Group and, as of<br />
31 December <strong>2012</strong>, all the covenants have been respected.<br />
9.13.5 Other<br />
non-current<br />
financial<br />
assets<br />
Other non-current financial assets are analyzed as follows:<br />
(million euro) 31.12.<strong>2012</strong> 31.12.2011<br />
Bind deposits 0.8 0.3<br />
Assets for the measurement of derivative instruments 0.8 1.2<br />
Total 1.5 1.5<br />
Other non-current financial assets are analyzed by maturity in the following table:<br />
(million euro)<br />
Total<br />
long term<br />
Within<br />
1 year<br />
Between<br />
1 and 5 years<br />
Beyond<br />
5 years<br />
Bind deposits 0.8 - 0.8 -<br />
Assets for the measurement of derivative instruments 0.8 - 0.8 -<br />
Total 1.5 0.0 1.5 0.0<br />
81
Consolidated financial statements at 31 December <strong>2012</strong> – Notes<br />
9.14 Employee<br />
benefits<br />
Employee benefits reflect the provisions recognised for such post-employment benefits as severance<br />
indemnities (TFR) and pensions. The situation is analyzed in the following table.<br />
(million euro) 31.12.<strong>2012</strong> 31.12.2011<br />
Italian post-employment benefits (TFR) 35.2 38.1<br />
UK and Irish pension plans 2.7 1.6<br />
Other countries pension plans and deferred benefit 6.7 5.6<br />
Total employee benefits 44.7 45.4<br />
The UK and Irish pension plans comprise two defined benefit plans. Both plans were closed in 2011<br />
(no further provisions) and all active members were transferred to a new defined contribution plan.<br />
The new defined contribution fund formed on 1 January <strong>2012</strong> envisages the payment of employee<br />
and employer contributions totaling respectively 6% and 7% of pensionable salary. The contributions<br />
payable by the Group will increase by 0.5% per annum over the next few years, up to a maximum of<br />
10%. In addition, the Group’s UK company will continue to pay the costs of the defined benefit fund<br />
and has already made a special payment to the new defined contribution fund representing 5% of<br />
pensionable salary.<br />
As envisaged by IAS 19, the Group applies the corridor method.<br />
The plan deficit, including unrecognised actuarial gains and losses, amount to 36.7 million euro<br />
(67.7 million euro), of which unrecognised actuarial losses total 97.1 million euro (77.8 million euro).<br />
However, total fund liabilities decreased by 45.3 million euro in <strong>2012</strong> as a result of a change in the<br />
inflation parameters used (from the Retail Price Index to the Consumer Price Index). This change in<br />
the inflation parameters altered the constructive obligation deriving from the communications made<br />
to members and, accordingly, the change in the past service benefit was credited to the income<br />
statement.<br />
The unrecognized actuarial losses (97,1 million euro) exceed the greater of 10% of the present value of<br />
the defined benefits obligation or 10% of the fair value of the assets servicing the plans. In accordance<br />
with IAS 19, the difference of 61.4 million euro (43.0 million euro) is allocated to the income statement -<br />
commencing from the year following that of recognition - over the average remaining working lives of<br />
the employees that are members of the fund.<br />
The effect on the <strong>2012</strong> income statement was 3.2 million euro (1.3 million euro).<br />
As mentioned in the related note on assets with regard to the pension fund of <strong>Indesit</strong> Company<br />
UK Ltd., the non-current assets reported in the statement of financial position include a surplus of<br />
63.1 million euro due to the effect of actuarial gains and losses (91.8 million euro).<br />
The following schedule reconciles the assets and liabilities recognised in the statement of financial<br />
position and the charges made to the income statement, and presents the principal actuarial<br />
assumptions concerning the Italian post-employment benefits, the UK and Ireland pension plans.<br />
82
Consolidated financial statements at 31 December <strong>2012</strong> – Notes<br />
(million euro)<br />
Employee severance<br />
indemnities<br />
UK and Ireland pension plans<br />
31.12.<strong>2012</strong> 31.12.2011 31.12.<strong>2012</strong> 31.12.2011<br />
Present value of the defined benefit obligation<br />
(start of year) 37.9 41.1 348.3 332.8<br />
Current service cost - - 0.2 3.6<br />
Financial expenses 1.7 1.8 17.5 17.6<br />
Contributions from plan participants 0.0 0.0 0.1 1.7<br />
Actuarial (gains)/losses 5.8 (0.4) 36.9 12.2<br />
Benefits paid by the plan/company (5.0) (5.0) (11.7) (10.7)<br />
Curtailment of plan 0.4 0.5 (0.1) (3.6)<br />
Past service benefit - - (45.3) (15.3)<br />
Changes in exchange rates - - 11.1 9.9<br />
Present value of the defined benefit<br />
obligation (end of year) 40.8 37.9 357.0 348.3<br />
Fair value of plan assets (start of year) - - 280.6 267.7<br />
Expected return on plan assets - - 18.2 17.9<br />
Actuarial gains/(losses) - - 15.1 (12.5)<br />
Employer’s contributions 5.0 5.0 8.9 8.4<br />
Employees’ contributions - - 0.1 1.7<br />
Benefits paid (5.0) (5.0) (11.7) (10.7)<br />
Expenses - - (0.1) 0.0<br />
Change in exchange rates - - 9.2 8.1<br />
Fair value of plan assets (end of year) 0.0 0.0 320.3 280.6<br />
Present value of defined benefit obligation under<br />
funded plans - - 357.0 348.3<br />
Fair value of plan assets - - (320.3) (280.6)<br />
Deficit (surplus) of funded plans - - 36.7 67.7<br />
Present value of defined benefit obligation under<br />
unfunded plans 40.8 37.9 - -<br />
Actuarial gains/(losses) not recognised (5.5) 0.3 (97.1) (77.8)<br />
Pension (cost) of unrecognised post service - - - -<br />
Unrecognised assets (limit described in IAS 19.58b) - - - -<br />
Net liability/(asset) recognised 35.2 38.1 (60.4) (10.1)<br />
Amortisation of surplus corridor - - 3.2 1.3<br />
Current service cost - - 0.2 3.6<br />
Past service benefit - - (45.3) (15.3)<br />
Total operating costs - - (41.9) (10.3)<br />
83
Consolidated financial statements at 31 December <strong>2012</strong> – Notes<br />
(million euro)<br />
Employee severance<br />
indemnities<br />
UK and Ireland pension plans<br />
31.12.<strong>2012</strong> 31.12.2011 31.12.<strong>2012</strong> 31.12.2011<br />
Interest expense 1.7 1.8 17.5 17.6<br />
Expected return on plan assets - - (18.2) (17.9)<br />
Total financial charges 1.7 1.8 (0.8) (0.3)<br />
Curtailment (gains) losses 0.4 0.5 - -<br />
Total charge to the income statement 2.1 2.3 (42.7) (10.6)<br />
Assumptions used to determine defined benefit<br />
obligations<br />
Discount rate 3.3% 4.6% 4.5% 4.9%<br />
Salary increases n.a. n.a. 3.2% 3.1%<br />
Inflaction rate 2.0% 2.0% 1.9% 3.1%<br />
Pension increase rate n.a. n.a. 1.9% 3.1%<br />
Assumptions used to determine pension cost<br />
Discount rate 4.6% 4.8% 4.5% 5.4%<br />
Expected return on plan assets 0.0% 0.0% 6.3% 6.8%<br />
Expected salary increase 0.0% 0.0% 3.2% 3.9%<br />
Inflation rate 2.0% 2.0% 1.9% 3.4%<br />
Pension increase rate n.a. n.a. 1.9% 3.4%<br />
The change in the discount rate is due to the reduction, which occurred in <strong>2012</strong>, bond yields used as<br />
benchmark (Corporate Bond rating AA).<br />
The principal demographic assumptions made by the funds in order to determine the actuarial liability<br />
are presented below:<br />
Demographic assumptions<br />
Years<br />
Male 65 years old in <strong>2012</strong> 20.4<br />
Female 65 years old in <strong>2012</strong> 23.0<br />
Male 65 years old in 2032 22.3<br />
Female 65 years old in 2032 24.9<br />
The assets servicing the UK pension plans are invested as follows:<br />
In % 31.12.<strong>2012</strong> 31.12.2011<br />
Bonds 46.2% 44.8%<br />
Multi-Assets funds 53.8% 55.2%<br />
The Multi-Assets funds are managed by leading international financial institutions. They invest in a<br />
range of heterogeneous financial assets designed to lower the exposure to risk, partly by seeking low<br />
correlation between the various classes of asset.<br />
84
Consolidated financial statements at 31 December <strong>2012</strong> – Notes<br />
At 31 December <strong>2012</strong>, the investment portfolio of the Multi-Assets funds comprise:<br />
• equities: 45%;<br />
• bonds: 30%;<br />
• other assets (commodities, property funds etc.): 21%;<br />
• monetary: 4%.<br />
9.15 Provisions<br />
for risks and<br />
charges<br />
The provisions for risks and charges are analyzed as follows:<br />
<strong>2012</strong> movements<br />
(million euro)<br />
Opening<br />
balance<br />
01.01.<strong>2012</strong> Provision Utilisations<br />
Other<br />
movements<br />
Closing<br />
balance<br />
31.12.<strong>2012</strong><br />
Current<br />
portion<br />
Noncurrent<br />
portion<br />
Provision for warranties 47.1 10.5 (14.0) 0.7 44.3 30.4 14.0<br />
Provision for agents’ termination indemnity 1.5 0.2 (0.3) - 1.4 (0.0) 1.4<br />
Provision for restructuring 23.8 9.9 (5.5) 0.1 28.2 25.1 3.1<br />
Provision for WEEE 14.3 0.6 (0.2) 0.1 14.7 1.5 13.2<br />
Provision for onerous contracts 1.8 0.2 (0.8) 0.0 1.3 0.7 0.6<br />
Provision for disputes and other risks 18.6 10.1 (4.3) 0.1 24.5 6.8 17.7<br />
Total 107.2 31.5 (25.2) 1.0 114.5 64.4 50.1<br />
2011 movements<br />
(million euro)<br />
Opening<br />
balance<br />
01.01.2011 Provision Utilisations<br />
Other<br />
movements<br />
Closing<br />
balance<br />
31.12.2011<br />
Current<br />
portion<br />
Noncurrent<br />
portion<br />
Provision for warranties 54.9 4.4 (10.8) (1.3) 47.1 27.0 20.1<br />
Provision for agents’ termination indemnity 1.5 0.2 (0.2) - 1.5 (0.0) 1.5<br />
Provision for restructuring 30.3 2.7 (9.4) 0.1 23.8 20.4 3.4<br />
Provision for WEEE 18.0 - (3.6) (0.1) 14.3 1.4 12.9<br />
Provision for onerous contracts 2.3 0.1 (0.6) 0.1 1.8 0.6 1.2<br />
Provision for disputes and other risks 28.1 6.4 (16.0) 0.0 18.6 9.1 9.5<br />
Total 135.1 13.9 (40.6) (1.2) 107.2 58.6 48.6<br />
The provision for agents’ termination indemnities, determined with reference to the commissions<br />
earned in accordance with art. 1751 of the Italian Civil Code and collective agreements, represents<br />
the estimated liability for payments to agents should their mandates be terminated (for reasons not<br />
attributable to them) by <strong>Indesit</strong> Company S.p.A.<br />
The provision for restructuring covers charges associated with the industrial reorganization plans being<br />
implemented at certain of the Group’s factories. The provision has increased, mainly as a result of the<br />
None plant restructuring plan, and was decreased as a result mainly of uses relating to restructuring<br />
measures carried out in the previous year.<br />
The provision for WEEE covers the charges deriving from application of the product disposal<br />
regulations, with sole reference to new waste in countries where local legislation adopting the EU<br />
Directive envisages the individual responsibility of manufacturers.<br />
85
Consolidated financial statements at 31 December <strong>2012</strong> – Notes<br />
The provisions for onerous contracts relate to rentals, hire agreements and operating leases for<br />
which, due to termination of the use of the assets covered by such contracts as a result of business<br />
restructuring, a discounted liability for future installments has been recognized. The amount of<br />
1.3 million euro relates to the buildings in Uxbridge and in Dublin.<br />
The provision for disputes and other risks reflects the best possible estimate of the likely liability based<br />
on the information available.<br />
At 31 December <strong>2012</strong>, this caption comprises the provisions for outstanding disputes, 5.5 million euro<br />
(6.5 million euro), the provision for environmental risks, 4.9 million euro (7.2 million euro), the provision<br />
for product liability, 13.4 million euro (4.2 million euro), and the provisions for other risks, 0,7 million<br />
euro (0.7 million euro).<br />
From the year <strong>2012</strong>, the policy conditions for liability to third parties for damages caused by the<br />
finished products of the Group, have been revised and the exemption was increased. This revision of<br />
the contract, together with the high number of accidents occurring mainly in the UK and taken by the<br />
insurer in 2011 compared to the premium paid for the annuity itself, led to a substantial increase in the<br />
allocation to provision for liability for damage caused by products finished the previous year.<br />
The Other changes column of the table reporting the movements in the provisions for risks and<br />
charges principally comprises the exchange effect deriving from the translation of financial statements<br />
not denominated in euro, which is the Group’s reporting currency.<br />
Total payables and provisions for non-recurring transactions at 31 December <strong>2012</strong> amount to<br />
71.3 million euro (41.9 million euro) and the cash flow absorbed by them was 6.9 million euro<br />
(generated by 5.8 million euro).<br />
9.16 Deferred tax<br />
liabilities<br />
Deferred tax liabilities and the related changes during the year are analyzed in the following table:<br />
(million euro) 31.12.2011<br />
Credited/<br />
charged<br />
to income<br />
statement<br />
Credited/<br />
charged to<br />
equity<br />
Exchange rate<br />
effect<br />
Other<br />
movements 31.12.<strong>2012</strong><br />
Property, plant and equipment 5.4 (3.5) 0.1 2.0<br />
Intangible assets 29.9 (0.9) (1.7) 27.3<br />
Inventories 1.1 (3.2) 0.0 (2.1)<br />
Non-current financial liabilities 0.0 0.6 1.2 (0.0) 1.8<br />
Employee benefits 4.3 12.0 (0.0) 16.2<br />
Government grants 0.1 - - 0.1<br />
Provisions for risks and charges 0.1 (0.7) 0.0 (0.6)<br />
Other (0.3) 7.8 (0.0) (0.0) 7.4<br />
Distributable retained earnings and other 8.9 - - 8.9<br />
Total 49.5 12.0 1.2 (1.6) (0.0) 61.2<br />
Amounts offset (11.1) 0.1 - - - (11.0)<br />
Total net 38.4 12.1 1.2 (1.6) (0.0) 50.2<br />
86
Consolidated financial statements at 31 December <strong>2012</strong> – Notes<br />
The amounts offset relate to deferred tax liabilities that reduce these deferred tax assets since they<br />
are due to the same tax authorities, are legally offsettable and relate to temporary differences that will<br />
reverse at the same time.<br />
9.17 Other<br />
non-current<br />
liabilities<br />
Other non-current liabilities principally relate to deferred grants from the State and other bodies. These<br />
grants are analyzed by country below:<br />
(million euro) 31.12.<strong>2012</strong> 31.12.2011<br />
Deferred grants for Special Economic Zone in Poland 15.2 19.0<br />
Italy and other countries deferred grants 2.8 3.6<br />
Non-current liabilities for employee benefits 9.0 9.5<br />
Non-current liabilities for other social security institutions 3.0 2.7<br />
Other non-current liabilities 29.9 34.9<br />
The grants collected in Poland principally relate to tax credits for investment relating to the factories in<br />
the Lodz and Radomsko Special Economic Zone. Access to these grants is subject to certain covenants<br />
that are currently respected. The accounting treatment of these tax credits has involved, in accordance<br />
with IAS 20, the recognition of non-current liabilities that will be released to the income statement to<br />
match the depreciation charged on the capital investment concerned. The reduction in this caption is<br />
consistent with the discussion presented in note 9.5.<br />
Deferred government grants totaling 0.9 million euro in Italy (3.8 million euro) and 3.1 million euro<br />
(4.1 million euro) in Poland were credited to the income statement during the year.<br />
9.18 Trade payables<br />
Trade payables relate to the purchase of goods and services from the Group’s suppliers. Payables are<br />
stated at their nominal value. All payables fall due within one year and, accordingly, they have not been<br />
discounted.<br />
The amounts due to suppliers reported among trade payables comprise without distinction the<br />
amounts due to both suppliers of raw materials and suppliers of fixed assets, as shown below:<br />
(million euro) 31.12.<strong>2012</strong> 31.12.2011<br />
Trade payables for investments 61.1 65.1<br />
Trade payables for purchases 783.7 723.7<br />
Trade payables 844.8 788.8<br />
9.19 Tax payables<br />
The amounts due to tax authorities reflect the provision for current taxes and other tax payables:<br />
(million euro) 31.12.<strong>2012</strong> 31.12.2011<br />
Current taxes payables 9.9 14.8<br />
Taxes withheld from employees and freelance workers 13.7 12.8<br />
Total tax payables 23.6 27.6<br />
87
Consolidated financial statements at 31 December <strong>2012</strong> – Notes<br />
9.20 Other payables<br />
Other payables are analyzed as follows:<br />
(million euro) 31.12.<strong>2012</strong> 31.12.2011<br />
Due to social security and pension institutions 25.8 27.0<br />
Due to employees 42.8 42.5<br />
VAT payable 26.5 31.7<br />
Other payables 7.6 6.0<br />
Total 102.7 107.2<br />
9.21 Assets held<br />
for sale<br />
Assets available for sale, 20.4 million euro, include 18.0 million euro relating to investment at new<br />
factories owned by <strong>Indesit</strong> Company Polska Sp.zo.o., which will be used under an operating lease<br />
contract to be arranged during 2013, and 2.4 million euro relating to a property in the UK owned by<br />
<strong>Indesit</strong> Company UK Ltd. for which will be finalized the sale by September 2013.<br />
9.22 Share-based<br />
payments<br />
(stock options)<br />
The resolutions adopted at the extraordinary meetings held on 19 September 1998 and 23 October<br />
2001 authorized, pursuant to art. 2441 of the Italian Civil Code, two increases in share capital by up<br />
to 2,700,000 euro each, via the issue of a combined maximum of 6,000,000 ordinary shares, par value<br />
0.90 euro, to service the stock option plan for the Group’s executives and managers. The Board of<br />
Directors, in the person of the Chairman, determines the number of options to be granted each year<br />
and identifies - on the recommendation of the Chief Executive Officer - the beneficiaries. The options<br />
granted on 24 July 2003 (last grant date) envisage a vesting period of 3 years for the first 50% and 4<br />
years for the remaining 50%, while the options granted previously envisaged vesting periods of 2 years<br />
and 3 years respectively.<br />
105,000 stock options expired during the year, but no new options were granted.<br />
The parameters used to determine the fair value of stock options at the grant date are set out in the<br />
following table:<br />
Exercise price 12.65<br />
Expected volatility 31.39%<br />
Grant date 24.07.2003<br />
Number of options 169,500.00<br />
Option term (years) 3.5<br />
Expected dividends 2.97%<br />
Risk-free interest rate 4.00%<br />
Fair value stock option (million euro) 0.1<br />
Further details about the stock option plans are presented in the Remuneration <strong>Report</strong>.<br />
88
Consolidated financial statements at 31 December <strong>2012</strong> – Notes<br />
10. Notes to the consolidated cash flow statement<br />
10.1 Profit for<br />
the year,<br />
income taxes,<br />
depreciation<br />
and<br />
amortisation,<br />
taxes paid<br />
Net results, income taxes and depreciation, all non-monetary items, are reported in notes 8.5 and 8.7 to<br />
which reference is made.<br />
The provision for income taxes totaled 40.0 million euro, while payments of 47.8 million euro were<br />
made in <strong>2012</strong> to settle the residual amount due for the prior year and make tax advances. The amounts<br />
due are determined with reference to the tax regulations in the various countries in which the Group<br />
operates.<br />
10.2 Other<br />
non-monetary<br />
income and<br />
expenses, net,<br />
interest paid<br />
and received<br />
The other non-monetary income and expenses, net, comprise all non-monetary items recognised in<br />
the income statement, except for income taxes, depreciation and the provisions deducted directly<br />
from asset accounts (allowance for doubtful accounts and provisions for obsolescence). Accordingly,<br />
they include the increases/decreases in the hedging reserve, provisions for warranties, provisions for<br />
risks and charges, disposal gains and losses, unrealized exchange fluctuations, and accrued interest<br />
income and expense. Interest collected is reported separately from interest paid.<br />
10.3 Change in trade<br />
receivables,<br />
inventories,<br />
trade payables<br />
This caption reports the cash absorbed or generated by the changes in net working capital, which<br />
comprises trade receivables, inventories and trade payables. The changes in trade payables relate<br />
solely to the supply of raw materials, goods and services, and exclude the changes in amounts due to<br />
suppliers of fixed assets, which are reported in the section of the cash flow statement that shows the<br />
cash flows generated (absorbed) by investing activities.<br />
10.4 Change in other<br />
assets and<br />
liabilities<br />
This caption reports the change in all other current and non-current assets and liabilities, net of the<br />
effect on them of provisions for non-monetary costs and income. This represents the changes in the<br />
related balances with a direct effect on the absorption or generation of cash.<br />
10.5 Acquisition/<br />
Proceeds from<br />
sale of property,<br />
plant and<br />
equipment<br />
The cash flows arising from additions to property, plant and equipment reflect investment for the<br />
development of new products at various plants throughout the Group. This caption also includes<br />
changes in payables, receivables and advances to suppliers of property, plant and equipment.<br />
The cash flows arising from the disposal of property, plant and equipment relate to the sale of plant no<br />
longer in use.<br />
10.6 Acquisition/<br />
Proceeds<br />
from sale of<br />
intangible<br />
assets<br />
The cash flows arising from investment in intangible assets relate to the purchase of licenses and<br />
software, and the capitalization of development costs, as explained in more detail in note 9.3.<br />
The cash flows generated (absorbed) by investing activities include the amounts capitalized since<br />
these involve payments for the related internal costs incurred (mainly payroll). These payments<br />
essentially reflect the costs capitalized during the year.<br />
89
Consolidated financial statements at 31 December <strong>2012</strong> – Notes<br />
10.7 Dividends paid<br />
The payment of dividends totaling 23.7 million euro was authorized at the Parent’s shareholders’<br />
meeting held to approve the <strong>2012</strong> financial statements, as also mentioned in note 9.11.<br />
10.8 Repayments of<br />
medium/longterm<br />
financial<br />
liabilities and<br />
bond issue<br />
The repayments of other medium/long-term financial payables relate to loans from banks and other<br />
providers of finance. The repayment of 9.5 million euro refers to the current portion of the above loans.<br />
10.9 Change in<br />
short, medium<br />
and longterm<br />
financial<br />
liabilities<br />
The change in current financial payables includes the change in short-term bank loans since this<br />
represents a technical form of short-term borrowing.<br />
No new loans were arranged during the year ended 31 December <strong>2012</strong>.<br />
90
Consolidated financial statements at 31 December <strong>2012</strong> – Notes<br />
11. Financial instruments<br />
11.1 Management<br />
of financial risks<br />
The Group is exposed to the following principal financial risks deriving from operations:<br />
• liquidity risk (availability and access to financial resources);<br />
• market risk (exchange rates, interest rates, commodity prices);<br />
• credit risk (with commercial and financial counterparts).<br />
Market risk<br />
Liquidity Risk<br />
Funding risk<br />
Competitive<br />
Currency risk<br />
Economic<br />
Market Risk<br />
Interest rate risk<br />
Translation<br />
Commodity price risk<br />
Credit Risk<br />
Financial counterpart<br />
Commercial<br />
counterpart<br />
Liquidity, market and financial counterpart credit risks are managed by the Central Treasury<br />
Department in accordance with the Group Treasury Policy approved by the Board of Directors. Group<br />
strategy is to minimize the exposure to risk and, accordingly, it is forbidden to take positions that<br />
might generate risks that are not strictly correlated with normal business activities (e.g. transactions in<br />
currencies other than the functional currencies).<br />
In this context and in order to appropriately segregate duties, the Group has allocated skills and<br />
responsibilities between the Treasury Front Office and the Treasury Back Office, which is functionally<br />
and hierarchically separated from the Front Office.<br />
The Front Office is mainly responsible for managing liquidity, identifying exposures to risk and<br />
negotiating hedges with financial counterparts.<br />
The Back Office checks compliance with Treasury Policy and is responsible for the accounting<br />
measurement and recognition of hedging instruments.<br />
91
Consolidated financial statements at 31 December <strong>2012</strong> – Notes<br />
Management of the credit risk with commercial counterparts is entrusted to the individual Country<br />
Managers working with the market Credit Controllers, who apply procedures for the evaluation and<br />
granting of credit limits that are specific to each geographical area or country in which the Group<br />
operates.<br />
As required by IFRS 7, the following qualitative and quantitative information is provided about the<br />
impact of these risks on the Group.<br />
With regard to the various market risks, the quantitative data from the sensitivity analyses has no value<br />
for forecasting purposes and cannot reflect the complexity of the market reactions correlated with<br />
each change in the assumptions made.<br />
11.1.1 Liquidity risk<br />
The Group defines liquidity risk as the risk that a Group company, or the Group as a whole, may be<br />
unable to meet its obligations on a timely basis. This risk has two components:<br />
Funding Risk: the risk of not being able to meet financial obligations on the due dates and/or being<br />
unable, on a timely basis, to obtain the necessary liquidity on market terms;<br />
Market Risk: the risk of not being able to realize financial investments on a timely basis and/or on<br />
market terms.<br />
Liquidity risk is contained by:<br />
• a capital structure that is balanced between own funds and borrowing;<br />
• diversifying the various sources of finance;<br />
• spreading the maturities of financial payables over an extended time horizon;<br />
• establishing limits for maturities and credit counterparts in the management of liquidity;<br />
• maintaining unused committed and uncommitted lines of credit.<br />
Available, undrawn committed lines of credit at 31 December <strong>2012</strong> amount to 400.0 million euro,<br />
comprising a syndicated line from banks arranged in July 2011 and expiring in 2016. At 31 December<br />
2011, the unused, committed lines of credit totaled 400.0 million euro.<br />
At 31 December <strong>2012</strong>, the Group has drawn down the amortizing line of credit for 75.0 million euro<br />
made available by the EIB and repayable by 2018, as well as the revolving line of credit from Bank<br />
Pekao S.A. for 80.0 million zloty, expiring in 2013. The Group has significant uncommitted lines of credit<br />
available at 31 December <strong>2012</strong>, of which only 49.5 million euro has been drawn down.<br />
During <strong>2012</strong>, the Group maintained the securitization program arranged in 2010 as part of its<br />
sources of funds. As required by IAS 39, the receivables sold via the securitization program are not<br />
derecognized and remain reported as trade receivables, while the related financial payables are<br />
reported as liabilities.<br />
No significant available lines of credit were revoked during the year.<br />
92
Consolidated financial statements at 31 December <strong>2012</strong> – Notes<br />
Financial liabilities<br />
(million euro)<br />
The following table analyzes by maturity the undiscounted contractual cash flows relating to financial<br />
liabilities, including trade payables and the derivative financial instruments with negative fair value at<br />
31 December <strong>2012</strong>. Loans have been included with reference to the first date on which repayment<br />
may be requested and those that may be revoked at any time have been treated as repayable upon<br />
demand.<br />
Carrying<br />
amount<br />
31.12.<strong>2012</strong><br />
Contractual<br />
cash<br />
flows not<br />
discounted<br />
Within<br />
1 month<br />
Between<br />
1 and 3<br />
months<br />
Between<br />
3 and 12<br />
months<br />
Between<br />
1 and 5<br />
years<br />
Beyond<br />
5 years<br />
Trade payables (844.8) (844.8) (256.3) (480.1) (108.4) 0.0 0.0<br />
Bonds (164.8) (168.6) 0.0 (4.5) (4.5) (159.7) 0.0<br />
Due to banks (241.3) (250.9) (147.7) (0.3) (37.3) (53.0) (12.7)<br />
Other financial payables (3.4) (3.4) (0.0) (1.4) (0.5) (1.2) (0.3)<br />
Derivative instruments (20.6) (19.0) (1.0) (1.1) (4.7) (12.2) 0.0<br />
Total (1,274.9) (1,286.6) (405.0) (487.3) (155.4) (226.0) (12.9)<br />
11.1.2 Market risk<br />
As defined in IFRS 7, the Group identifies as market risk the probability of fluctuations in the value of<br />
recognized assets or liabilities or its economic results, or in the fair value of a financial instrument, as a<br />
result of changes in:<br />
• currency exchange rates (exchange-rate risk);<br />
• interest rates (interest-rate risk);<br />
• commodity prices (commodity-price risk).<br />
Exchange-rate risk<br />
The Group identifies three types of exchange-rate risk:<br />
Competitive<br />
Changes in exchange rates may influence the strategic decisions and competitive positioning of the<br />
Group in its reference markets.<br />
Economic<br />
Changes in exchange rates between the date when a financial commitment between counterparts,<br />
in a currency other than the functional currency, is deemed to be highly probable and the actual<br />
settlement date of the commitment generate a difference between the expected cash flows and those<br />
that actually occur. The Group further analyzes economic risk between:<br />
• pre-transaction risk, represented by the risk of differences between the exchange rate used<br />
for forecasts and that applying when the financial commitment is recognized in the financial<br />
statements;<br />
• transaction risk, represented by the risk of differences between the exchange rate applying when<br />
the financial risk is recognized in the financial statements and that applying on the settlement date<br />
of the commitment.<br />
Translation<br />
Changes in the exchange rates alter the carrying amounts of assets and liabilities not denominated<br />
in euro, following their consolidation for reporting purposes and their translation into the functional<br />
93
Consolidated financial statements at 31 December <strong>2012</strong> – Notes<br />
currency of the Parent. These changes do not give rise to an immediate difference between expected<br />
and actual cash flows, but merely have an accounting effect on the Group’s consolidated equity. The<br />
effect on cash flows only arises in the event of equity transactions involving Group companies that<br />
prepare foreign currency financial statements (e.g. capital reductions, payment of dividends, corporate<br />
liquidations etc.).<br />
The Group is exposed to the following main currencies at 31 December <strong>2012</strong>: the British pound, the<br />
Polish zloty, the Russian ruble, the Turkish lira, the US dollar and the Ukrainian grivna.<br />
Exchange risk is managed by the Central Treasury Department, which systematically identifies<br />
outstanding exposures and those deriving from highly likely future transactions, and arranges the<br />
related hedges in compliance with the Treasury Policy.<br />
The principal Policy guidelines envisage:<br />
• the hedging of economic risk in accordance with the guidelines approved each year by the Board<br />
of Directors;<br />
• the hedging of translation risk only if there is a material risk of failure to comply with financial<br />
covenants and, in any case, subject to approval by the Chief Executive Officer;<br />
• identification of the derivative financial instruments that may be used.<br />
The instruments allowed by the Treasury Policy comprise foreign currency loans and investments, as<br />
well as forwards, options and collars traded over the counter or in regulated markets.<br />
Derivatives hedging pre-transaction risk are arranged with a time horizon of not more than one year<br />
and are managed using the rules applying to cash flow hedges. The year-end value of the hedging<br />
reserve relating to such derivatives is therefore released in full to the income statement in the following<br />
year.<br />
Derivatives hedging transaction risk generally do not have a duration of more than one month and are<br />
systematically renewed consistent with the level of the underlying exposure. In general, these financial<br />
instruments provide a natural hedge and are not managed using hedge accounting rules; accordingly,<br />
pursuant to IAS 39, any changes in fair value are recognized directly in the income statement.<br />
The Group manages and measures the exposure to exchange-rate risk using valuation methodologies<br />
(VaR, scenario analysis, stress tests etc.) that make reference to historical volatility parameters for the<br />
currencies concerned, as well as those observable in the market on the measurement date. These<br />
parameters are verified and updated at least every quarter, consistent with the Group’s budgeting<br />
cycles.<br />
94
Consolidated financial statements at 31 December <strong>2012</strong> – Notes<br />
Sensitivity<br />
of the value<br />
of derivatives<br />
With regard to the derivative contracts outstanding at 31 December <strong>2012</strong>, the effects on the Group’s<br />
income statement of hypothetical, 10% negative changes in the exchange rates of the principal<br />
currencies used by the Group have been estimated.<br />
Currency<br />
Sensitivity<br />
<strong>2012</strong><br />
Sensitivity<br />
2011 Change %<br />
EUR/GBP 15.4 11.6 -10%<br />
EUR/PLN (3.1) (8.5) -10%<br />
EUR/TRY (3.0) (1.0) -10%<br />
EUR/RUB (4.1) 0.0 -10%<br />
EUR/USD 0.1 n.a. -10%<br />
PLN/USD (0.6) n.a. -10%<br />
TRY/USD (0.4) (0.5) -10%<br />
Total 4.2 1.6<br />
Sensitivity<br />
of operating profit<br />
Considering the principal currencies to which the Group is exposed, a 10% increase (decrease) in each<br />
currency, with respect to their average exchange rates during <strong>2012</strong>, would have had an adverse effect<br />
on the Group’s operating profit (ignoring the tax effect) of about 66.5 million euro (positive effect of<br />
about 81.3 million euro), assuming no changes in other factors.<br />
The model assumes the same distribution of revenues and costs as in <strong>2012</strong>. The simulation does not<br />
include:<br />
• any external effects (e.g. market or competitive dynamics) or internal effects (behavior and actions<br />
taken by the Group) as a result of such changes in exchange rates;<br />
• the effects of hedging via the use of derivatives.<br />
Positive variation effect of 10% of currency on operating profit<br />
(million euro) GBP RUB TRY PLN USD Total<br />
Operating profit (51.5) (27.4) (6.5) 7.7 11.2 (66.5)<br />
% effect on total 77.3% 41.2% 9.8% -11.5% -16.8% 100.0%<br />
Negative variation effect of 10% of currency on operation profit<br />
(million euro) GBP RUB TRY PLN USD Total<br />
Operating profit 62.9 33.5 7.9 (9.4) (13.7) 81.3<br />
% effect on total 77.3% 41.2% 9.8% -11.5% -16.8% 100.0%<br />
95
Consolidated financial statements at 31 December <strong>2012</strong> – Notes<br />
Exposure<br />
to commercial cash<br />
flows<br />
The following table reports the exposure to economic risk deriving from expected commercial flows<br />
and the related hedges of pre-transaction risk at 31 December <strong>2012</strong>.<br />
The 2013 hedges on the exposure to economic risk deriving from expected commercial flows *<br />
Currency GBP PLN RUB USD TRY UAH<br />
Long/short exposure 408 (110) 263 (148) 75 68<br />
Hedges (258) 108 55<br />
Residual exposure 150 (2) 263 (94) 75 68<br />
* The amounts are in million euro equivalents.<br />
At the end of <strong>2012</strong>, no hedges have a duration of more than 12 months.<br />
The estimated exposures and expected flows used and shown in the above table are subject<br />
to possibly significant changes due to changes in demand, the different allocation of factors of<br />
production, the revision of forecast sales and purchases, changes in collection and payment terms and,<br />
more generally, to the operational and financial risks highlighted in the report on operations.<br />
Interest-rate risk<br />
The Group defines interest rate risk as the risk that adverse movements in the interest rate curve might<br />
have a negative effect on the cost of liabilities or the yield from financial assets and, in the final analysis,<br />
on the Group’s profit for the year.<br />
Interest-rate risk is managed centrally by the Group’s Treasury Department, in compliance with the<br />
Treasury Policy.<br />
In particular, it is Group policy to:<br />
• maintain borrowing at floating rates;<br />
• limit the conversion from floating rate to fixed rate within the notional, maturity (maximum rolling<br />
maturity of 5 years) and market limits defined by the policy.<br />
In addition, the policy also covers the types of hedging instrument that can be used (interest-rate<br />
swaps, forward-rate agreements, cross currency swaps, caps, floors, collars). Recourse to structured<br />
derivatives is not envisaged, unless expressly authorized by the CFO.<br />
Interest-rate risk:<br />
sensitivity<br />
A hypothetical upward shift in the interest-rate curve by 100 basis points (in parallel along the entire<br />
curve) would have the effects indicated below. The effects of a downward shift are not presented since<br />
they are not meaningful.<br />
The simulation is representative of the effects that would be generated in 2013 if the exposures to risk<br />
remained the same as those at 31 December <strong>2012</strong>, or the same as the normalized average exposures in<br />
the limited cases in which the situation at year end was not representative of that applying throughout<br />
the year.<br />
96
Consolidated financial statements at 31 December <strong>2012</strong> – Notes<br />
31.12.<strong>2012</strong><br />
Variation +100bps<br />
Variation -20bps<br />
(million euro)<br />
P&L effect Equity effect P&L effect Equity effect<br />
Net indebtedness of floating rate (3.4) 0.0 n.a. n.a.<br />
Derivative instrument hedging of fixed rate loans (1.3) 0.0 n.a. n.a.<br />
Derivative instrument hedging of floating rate loans 1.9 2.5 n.a. n.a.<br />
Total (2.7) 2.5 n.a. n.a.<br />
31.11.2011<br />
Variation +100bps<br />
Variation -20bps<br />
(million euro)<br />
P&L effect Equity effect P&L effect Equity effect<br />
Net indebtedness of floating rate (3.0) 0.0 0.6 0.0<br />
Derivative instrument hedging of fixed rate loans (1.3) 0.0 0.3 0.0<br />
Derivative instrument hedging of floating rate loans 0.0 5.9 0.0 (1.2)<br />
Total (4.3) 5.9 0.9 (1.2)<br />
Commodity-price risk<br />
The Group is subject to the risk that fluctuations in the prices for the commodities used in the<br />
production process might have an adverse effect on the results for the year.<br />
This risk is mainly managed in accordance with the Group’s procurement policies by the Supply Chain<br />
Department, which regularly assesses current and future exposures. Action involves the management<br />
of supply contracts and, occasionally, for amounts that are not significant, the use of derivative<br />
instruments.<br />
The following table indicates the costs incurred by the Group in <strong>2012</strong> for the consumption of raw<br />
materials, components and other materials.<br />
(million euro) 31.12.<strong>2012</strong> 31.12.2011<br />
Steel 229.0 236.7<br />
Plastic 261.3 244.2<br />
Components and transformations 1,067.8 1,037.5<br />
Other material 99.4 85.7<br />
Total 1,657.6 1,604.1<br />
Normally, with regard to the purchase of steel, the Group’s objective is to sign annual contracts at<br />
fixed prices for the materials requirement estimated when preparing the budget for the following<br />
year. These contracts are signed before the end of the fourth quarter each year. The 2013 objective of<br />
signing annual contracts at fixed prices with all steel vendors in the European market (including Service<br />
Centers and Steelworks) and to the Turkish market was achieved at the end of <strong>2012</strong>. For the Russian<br />
market, prices will again be fixed quarterly during 2013 due, in part, to normal contractual practice<br />
there; accordingly, the steel price for just the first quarter of 2013 was fixed at the end of <strong>2012</strong>.<br />
97
Consolidated financial statements at 31 December <strong>2012</strong> – Notes<br />
For non-ferrous metals (nickel, copper and aluminum), the supply agreements for 2013 are partly<br />
annual and partly six-monthly (nevertheless with the fixing of lower prices), depending on the<br />
strategies agreed with the various vendors.<br />
Lastly with regard to plastics, as usual the Group has signed fixed price contracts for 2013 covering<br />
about 30% of its requirement, while the prices for the remaining 70% are indexed to sector parameters.<br />
The duration of these supply contracts is either quarterly or half-yearly, depending on the negotiating<br />
strategies established with the vendors of the various commodities.<br />
Price risk: quantitative information<br />
The derivatives outstanding at 31 December <strong>2012</strong> hedge the prices of aluminum and copper.<br />
A hypothetical 10% decrease in the prices of the above commodities would reduce the fair value of the<br />
derivatives by 1.2 million euro, while a hypothetical 10% increase in the prices of these commodities<br />
would raise the fair value of the derivatives by 1.2 million euro.<br />
These increases/decreases would be reflected in full in the hedging reserve.<br />
Hierarchy of levels in the measurement of fair value<br />
With regard to financial instruments recognized at fair value in the statement of financial position, IFRS<br />
7 requires such values to be classified using a hierarchy of levels that reflect the meaningfulness of the<br />
input used for the determination of fair value. The following levels are identified:<br />
• Level 1 - prices quoted in an active market for the asset or liability to be measured;<br />
• Level 2 - input other than the quoted prices referred to above, which is directly (prices) or indirectly<br />
(derived from the prices) observable in the market;<br />
• Level 3 - input that is not based on observable market data.<br />
With regard to the derivative instruments outstanding at 31 December <strong>2012</strong>:<br />
• all the financial instruments measured at fair value are represented by Level 2 derivatives (same as<br />
in 2011);<br />
• there were no transfers from Level 1 to Level 2, or vice versa, during <strong>2012</strong>;<br />
• there were also no transfers from Level 3 to other levels, or vice versa, during <strong>2012</strong>.<br />
11.1.3 Credit risk<br />
Credit risk represents the Group’s exposure to potential losses deriving from the failure of commercial<br />
and financial counterparts to meet their obligations.<br />
Financial counterpart credit risk<br />
The Group invests its liquidity and enters into currency contracts and/or other derivative transactions<br />
with various financial institutions, which may give rise to credit risks.<br />
Group Treasury Policy establishes guidelines and limits to be followed by the Treasury Front Office in<br />
the management of financial applications of funds, in order to limit the credit risk in relation to financial<br />
counterparts.<br />
The Treasury Back Office checks compliance with these rules.<br />
In particular, Group policy covers:<br />
• minimum rating requirements for counterparts;<br />
98
Consolidated financial statements at 31 December <strong>2012</strong> – Notes<br />
• the maximum level of counterpart risk that the Group can accept, based on the risk profile (rating)<br />
of each counterpart;<br />
• the rules that specify how risk positions must be modified following a change in rating;<br />
• the rules and limits that apply in the case of exposure to counterparts without a rating.<br />
Transactions involving the employment of liquidity and the use of hedging instruments are arranged<br />
with leading domestic and international banks.<br />
Commercial counterpart credit risk<br />
The management of trade receivables, which represent the Group’s principal credit risk exposure, is the<br />
responsibility of the individual Country Managers working together with the market Credit Controllers,<br />
who evaluate counterparts and assign them credit limits.<br />
Credit risk is measured on a specific basis by allocating a risk rating to each customer, based on an<br />
assessment of creditworthiness that distinguishes between the various types of customer.<br />
The risk rating is assigned by the Credit Manager, on examination of the application for credit,<br />
following an assessment of creditworthiness that takes account of both subjective and objective<br />
information.<br />
The objective elements considered include:<br />
• analysis of financial statements;<br />
• competitive positioning of the company;<br />
• information about the potential customer obtained from databases.<br />
The subjective elements considered include:<br />
• accumulated experience;<br />
• network of relations.<br />
The credit rating of counterparts is reviewed periodically.<br />
The credit risk deriving from commercial transactions is mitigated by the use of various<br />
instruments, such as letters of credit, insurance policies and other forms of secured or unsecured<br />
guarantee.<br />
The Group policy is to impair receivables overdue by more than 60 days by 50% and those overdue by<br />
more than 120 days by 75%, while those overdue by more than 180 days are impaired in full, unless<br />
backed by insurance cover, bank guarantees or other forms of collateral.<br />
The credit risk associated with any doubtful or overdue positions is also monitored centrally on the<br />
basis of monthly reports received.<br />
Credit risk: quantitative information<br />
The Group’s maximum theoretical exposure to credit risk is represented by the carrying amount of<br />
the financial assets recognised in the statement of financial position, 639.0 million euro (697.3 million<br />
euro).<br />
Solely with regard to trade receivables at 31 December <strong>2012</strong>, the concentration of the ten largest<br />
customers (all major retail chains) is 19.9% (21.3%) of total gross performing receivables.<br />
99
Consolidated financial statements at 31 December <strong>2012</strong> – Notes<br />
11.2 Recognition<br />
of hedge<br />
transactions and<br />
categories of<br />
financial asset/<br />
liability<br />
Hedge accounting<br />
The Group carries out prospective and retrospective tests of the effectiveness of derivatives recognized<br />
for hedge accounting purposes<br />
The prospective effectiveness of a hedge is checked by stress testing, which involves comparing the<br />
changes in its fair value with those of the underlying hedged assets or liabilities. In particular, two<br />
distinct changes (positive and negative) in the market curves are simulated.<br />
The retrospective effectiveness of a hedge is checked, commencing from the date when the<br />
instrument was designated as a hedge, by comparing the cumulative changes in its fair value with<br />
those of the underlying hedged assets or liabilities.<br />
Effectiveness is assured if the relation between the change in the fair value of the hedging<br />
instrument and the change in the fair value of the underlying falls in the range between 80% and<br />
125%.<br />
The Group arranged both fair value hedges and cash flow hedges during <strong>2012</strong>. With regard to the<br />
latter, <strong>Indesit</strong> Company hedges its exposure to changes in cash flows attributable to a specific risk<br />
associated with a recognized asset or liability, as well as a planned transaction that is highly likely to<br />
take place.<br />
The Group regularly checks that hedged future transactions continue to be considered highly likely. No<br />
significant effects were recognised in <strong>2012</strong> due to hedges with notionals in excess of the underlying<br />
flows (overhedges).<br />
The ineffective cash flow hedges identified in <strong>2012</strong> resulted in the recognition of costs totalling<br />
1.2 million euro. With regard to the fair value hedges, the changes in the fair value of derivatives and<br />
the related underlyings are summarized in the table of transactions outstanding at year end.<br />
Fair value<br />
The Group uses the valuation techniques applied in established market practice and internationallyrecognized<br />
software to determine the fair value of derivatives for which there is no active market. These<br />
techniques establish the value that these instruments would have had at the measurement date in an<br />
arms’-length transaction between knowledgeable and willing parties.<br />
The valuation methodologies applied solely refer to market factors, ignoring any factors specific to the<br />
Group, in order to make a reasonable estimate of the market value of the financial instruments.<br />
When determining fair value, the following market factors are considered and identified at the<br />
measurement date: the exchange rates for foreign currencies, the yield curves of government<br />
securities, the prices of goods and their volatility.<br />
The market value obtained by applying these valuation techniques is periodically compared with the<br />
mark-to-market values provided by banking counterparts.<br />
In particular, the fair value of each instrument is calculated as follows:<br />
• the fair value of currency forwards is calculated considering the exchange rate and the interest rates<br />
in the two currencies at the reporting date;<br />
• the fair value of currency options is calculated using the Black-Scholes model and market<br />
parameters at the reporting date (exchange rates, interest rates and volatilities of the currencies);<br />
• the fair value of interest-rate swaps and forward-rate agreements is calculated considering the<br />
interest rates at the reporting date and using DCF techniques;<br />
• the fair value of cross currency swaps is calculated considering the exchange rate and the interest<br />
rates at the reporting date and using DCF techniques;<br />
100
Consolidated financial statements at 31 December <strong>2012</strong> – Notes<br />
31.12.<strong>2012</strong><br />
(million euro)<br />
• the fair value of commodity forwards is determined considering the forward price for the<br />
commodity and the interest rates at the reporting date (and the exchange rate at the reporting<br />
date, if the hedge includes the exchange rate).<br />
Categories of financial asset/liability<br />
The following tables present, for each of the categories identified in IAS 39, the carrying amount and<br />
corresponding fair value of the financial assets and liabilities recognised in the statement of financial<br />
position.<br />
Loans and<br />
receivables<br />
Financial assets<br />
measured at fair value<br />
through profit or loss<br />
Financial<br />
assets<br />
measured<br />
at fair value<br />
upon initial<br />
measurement<br />
Financial<br />
assets<br />
held for<br />
trading<br />
Financial<br />
assets<br />
available<br />
for sale<br />
Investments<br />
held to<br />
maturity<br />
Hedging<br />
Instruments<br />
Total<br />
carrying<br />
amount<br />
Total<br />
fair value<br />
Non-current financial assets 0.8 - - - - 0.8 1.5 1.5<br />
Trade receivables 465.3 - - - - - 465.3 465.3<br />
Current financial assets 11.0 - - - - 18.4 29.4 29.4<br />
Cash and cash equivalents 142.8 - - - - - 142.8 142.8<br />
Total 639.0 639.0<br />
31.12.2011<br />
(million euro)<br />
Loans and<br />
receivables<br />
Financial assets<br />
measured at fair value<br />
through profit or loss<br />
Financial<br />
assets<br />
measured<br />
at fair value<br />
upon initial<br />
measurement<br />
Financial<br />
assets<br />
held for<br />
trading<br />
Financial<br />
assets<br />
available<br />
for sale<br />
Investments<br />
held to<br />
maturity<br />
Hedging<br />
Instruments<br />
Total<br />
carrying<br />
amount<br />
Total<br />
fair value<br />
Non-current financial assets 0.3 - - - - 1.2 1.5 1.5<br />
Trade receivables 440.5 - - - - - 440.5 440.5<br />
Current financial assets 8.9 - - - - 12.0 20.9 20.9<br />
Cash and cash equivalents 234.4 - - - - - 234.4 234.4<br />
Total 697.3 697.3<br />
101
Consolidated financial statements at 31 December <strong>2012</strong> – Notes<br />
31.12.<strong>2012</strong><br />
(million euro)<br />
Financial liabilities<br />
measured at fair value<br />
through profit or loss<br />
Financial<br />
liabilities<br />
measured<br />
at fair value<br />
upon initial<br />
measurement<br />
Financial<br />
liabilities<br />
held for<br />
trading<br />
Other<br />
financial<br />
liabilities<br />
measured<br />
at amortised<br />
cost<br />
Hedging<br />
Instruments<br />
Total<br />
carrying<br />
amount<br />
Total<br />
fair value<br />
Medium/long-term financial liabilities - - 219.1 13.2 232.3 232.3<br />
Trade payables - - 844.8 - 844.8 844.8<br />
Banks and other medium/long-term financial<br />
liabilities - - 190.4 7.4 197.8 197.8<br />
Total 1,274.9 1,274.9<br />
31.12.2011<br />
(million euro)<br />
Financial liabilities<br />
measured at fair value<br />
through profit or loss<br />
Financial<br />
liabilities<br />
measured<br />
at fair value<br />
upon initial<br />
measurement<br />
Financial<br />
liabilities<br />
held for<br />
trading<br />
Other<br />
financial<br />
liabilities<br />
measured<br />
at amortised<br />
cost<br />
Hedging<br />
Instruments<br />
Total<br />
carrying<br />
amount<br />
Total<br />
fair value<br />
Medium/long-term financial liabilities - - 236.9 9.5 246.3 246.3<br />
Trade payables - - 788.8 - 788.8 788.8<br />
Banks and other medium/long-term financial<br />
liabilities - - 212.5 16.2 228.7 228.7<br />
Total 1,263.8 1,263.8<br />
102
Consolidated financial statements at 31 December <strong>2012</strong> – Notes<br />
Financial assets and liabilities measured at amortized cost<br />
Trade receivables and payables, restricted deposits, bank borrowing, loans, bonds and other assets and<br />
liabilities are measured at amortized cost (e.g. receivables sold and finance lease liabilities).<br />
Pursuant to IFRS 7, the fair value of these captions is reassessed by calculating the present value of<br />
the contractually-expected flows of principal and interest, based on the yield curve for government<br />
securities at the valuation date. In particular, the fair value of long-term financial liabilities is determined<br />
using the risk-free curve, as adjusted to take account of the Group’s credit rating.<br />
Although the US Private Placement bonds fall into the category of financial liabilities measured at<br />
amortized cost, they are actually recognised at fair value. This is determined with reference solely to<br />
the hedged risk factors, using the accounting rules applicable to fair value hedges. The interest rate<br />
and exchange rate risks associated with these bonds have in fact been hedged by the Group using the<br />
specific derivative instruments described in the note on financial instruments.<br />
The carrying value of trade receivables and payables is a reasonable approximation of their fair value.<br />
Financial assets and liabilities measured at fair value<br />
The financial instruments arranged for hedging and trading purposes (operational hedges) are<br />
measured at fair value. Information about the determination of fair value is provided in the section on<br />
“Derivative financial instruments outstanding at year end”.<br />
103
Consolidated financial statements at 31 December <strong>2012</strong> – Notes<br />
Notional amount<br />
Fair value of derivates<br />
(million euro) Nature of risk hedged<br />
31.12.<strong>2012</strong> 31.12.2011 31.12.<strong>2012</strong> 31.12.2011<br />
Cash flow hedges<br />
a) Currency options Currency 246.8 254.4 6.6 (2.7)<br />
b) IRS on loans short term Interest rate 350.0 350.0 (12.5) (11.6)<br />
c) Forward Price/currency 123.5 112.9 2.9 (4.1)<br />
Total 720.4 717.3 (3.0) (18.4)<br />
Fair value hedges<br />
d) CCS on bonds Currency/Interest rate 144.5 144.5 (0.1) 3.5<br />
e) IRS on bonds Interest rate 18.3 18.3 1.5 1.7<br />
Total 162.8 162.8 1.4 5.2<br />
Other hedges<br />
f) Forward Currency 273.3 278.0 0.3 0.7<br />
Total 273.3 278.0 0.3 0.7<br />
Grand total 1,156.4 1,158.1 (1.4) (12.5)<br />
The currency options recognized as cash flow hedges were purchased principally to hedge the risk of<br />
an appreciation of the euro against the British pound, the Polish zloty against the British pound, and<br />
the euro against the Russian ruble. The hedged currency risks mainly relate to highly probable future<br />
transactions expected to take place within one year, with the consequent release of the hedging<br />
reserve to profit or loss.<br />
The float-to-fix Interest Rate Swaps have been designated as cash flow hedges of the interest rate risk<br />
on part of the short-term loans, the use of which is expected to be equivalent to such Interest Rate<br />
Swaps in terms of their nominal value and maturities.<br />
The interest rate hedges outstanding at 31 December <strong>2012</strong> comprise IRS with a total notional of<br />
350.0 million euro. These hedge the interest rate risk on an average of about 200 million euro of<br />
underlying payables (short term) with the following maturities:<br />
• 150 million euro from 17 March <strong>2012</strong> to 17 March 2014;<br />
104
Consolidated financial statements at 31 December <strong>2012</strong> – Notes<br />
Change in<br />
fair value of<br />
derivatives at<br />
31.12.<strong>2012</strong><br />
vs 31.12.2011<br />
Change in<br />
fair value of<br />
underlyings at<br />
31.12.<strong>2012</strong><br />
vs 31.12.2011<br />
Change in<br />
fair value of<br />
underlyings at<br />
31.12.<strong>2012</strong><br />
vs inception<br />
date<br />
Change in<br />
fair value of<br />
derivatives at<br />
31.12.<strong>2012</strong><br />
vs inception<br />
date<br />
Other<br />
non-current<br />
financial<br />
assets<br />
Classification at 31 December <strong>2012</strong><br />
Current<br />
financial<br />
assets<br />
Medium/<br />
long-term<br />
financial<br />
payables<br />
Banks<br />
and other<br />
financial<br />
payables<br />
Total<br />
9.3 n.a. n.a. n.a. - 7.2 - (0.6) 6.6<br />
(0.9) n.a. n.a. n.a. - - (7.0) (5.5) (12.5)<br />
7.0 n.a. n.a. n.a. - 3.8 (0.9) 2.9<br />
15.3 - - - - 11.0 (7.0) (7.0) (3.0)<br />
(3.6) 4.1 (1.4) 0.0 - 6.1 (6.2) - (0.1)<br />
(0.2) 0.2 (1.6) 1.4 0.8 0.7 - - 1.5<br />
(3.8) 4.3 (3.0) 1.4 0.8 6.9 (6.2) - 1.4<br />
(0.4) n.a. n.a. n.a. - 0.6 - (0.3) 0.3<br />
(0.4) - - - - 0.6 - (0.3) 0.3<br />
11.1 4.3 (3.0) 1.4 0.8 18.4 (13.2) (7.4) (1.4)<br />
• 150 million euro from 17 March 2014 to 17 March 2015;<br />
• 50 million euro from 17 March <strong>2012</strong> to 17 March 2015.<br />
The forwards, designated as cash flow hedges, were arranged to hedge the currency risk on highly<br />
probable future transactions, and the price risk on highly probable future purchases of commodities<br />
and semi-finished products.<br />
The cross currency swap was arranged to hedge the interest-rate and currency risks deriving from<br />
commitments in relation to the US Private Placement of bonds. This transaction converted the<br />
fixed-rate US dollar bonds into floating-rate euro.<br />
The interest rate swap relates to the euro tranche of the US Private Placement, and was arranged to<br />
hedge the interest rate risk that was swapped from fixed to floating at the time the loan was arranged.<br />
The forwards not recognized as cash flow hedges were arranged to hedge currency risk.<br />
105
Consolidated financial statements at 31 December <strong>2012</strong> – Notes<br />
12. Information required by IAS 24 on the remuneration of management<br />
and on related parties<br />
Remuneration<br />
of management<br />
In addition to the executive and non-executive directors and the statutory auditors, from <strong>2012</strong> there<br />
are now 7 managers with strategic responsibility for operations, planning and control (5 through 2011).<br />
These are the Administration, Finance and Control Manager, the Manager of the Home Care Division,<br />
the Manager of the Food Treatment Division, the Manager of the Services & Consumer Care Division,<br />
the Sales Manager, the Human Resources Manager and the Supply Chain and IT Manager.<br />
The table below lists the expected gross remuneration of the above persons for <strong>2012</strong>, comprising all<br />
forms of compensation (gross pay, bonuses, fringe benefits etc.), and the bonuses accrued but not yet<br />
paid, since subject to the achievement of annual objectives and continued employment by the Group<br />
at the vesting date.<br />
Salaries and annual fees for the year <strong>2012</strong> due to directors, statutory auditors and executives<br />
with strategic responsibilities<br />
(million euro)<br />
Short-term<br />
benefits<br />
Long-term<br />
benefits<br />
Stock<br />
options<br />
Directors 4.6 1.2 -<br />
Statutory Auditors 0.2 - -<br />
Executives with strategic responsibilities 4.5 2.2 -<br />
Total 9.2 3.4 -<br />
Salaries and annual fees for the year 2011 due to directors, statutory auditors and executives<br />
with strategic responsibilities<br />
(million euro)<br />
Short-term<br />
benefits<br />
Long-term<br />
benefits<br />
Stock<br />
options<br />
Directors 4.0 1.3 -<br />
Statutory Auditors 0.2 - -<br />
Executives with strategic responsibilities 3.1 1.9 -<br />
Total 7.2 3.3 -<br />
The principal related parties (other than subsidiaries), as defined in IAS 24, with which commercial and<br />
financial transactions have been carried out, are listed below. All commercial and financial transactions<br />
with these entities were arranged on arms’-length terms and in the interests of the Group.<br />
106
Consolidated financial statements at 31 December <strong>2012</strong> – Notes<br />
List of the principal related parties with which transactions were carried out during the year<br />
List of related parties<br />
Cine District Entertainment S.r.l.<br />
Faber Factor S.r.l. in liquidation<br />
Fineldo S.p.A.<br />
Immobiliare Fineldo S.r.l.<br />
Merloni Progetti S.p.A.<br />
M P & S S.r.l.<br />
Solar COOL S.r.l.<br />
Solar STOCK S.r.l.<br />
Solar WASH S.r.l.<br />
Tecnosolare Carinaro S.r.l.<br />
TM NEWS S.p.A.<br />
Tradeplace B.V.<br />
<strong>Indesit</strong> Company UK Ltd. Group<br />
Personal Pension Plan<br />
Merloni Ireland Pension Plan<br />
Type of relationship<br />
Other related - Related to a member of the Board of Directors of Fineldo<br />
Other related - Controlled by Fineldo S.p.A., Group parent of <strong>Indesit</strong> Company<br />
Group parent - Belonging to Vittorio Merloni<br />
Other related - Controlled by Fineldo S.p.A., Group parent of <strong>Indesit</strong> Company<br />
Other related - Controlled by Fineldo S.p.A., Group parent of <strong>Indesit</strong> Company<br />
Other related - Related to a member of the Merloni family<br />
Other related - Controlled by Fineldo S.p.A., Group parent of <strong>Indesit</strong> Company<br />
Other related - Controlled by Fineldo S.p.A., Group parent of <strong>Indesit</strong> Company<br />
Other related - Controlled by Fineldo S.p.A., Group parent of <strong>Indesit</strong> Company<br />
Other related - Controlled by Fineldo S.p.A., Group parent of <strong>Indesit</strong> Company<br />
Other related - Related to a member of the Board of <strong>Indesit</strong> Company S.p.A.<br />
Associate<br />
Pension fund<br />
Pension fund<br />
<strong>Indesit</strong> Company UK Ltd and the employees concerned contribute to the <strong>Indesit</strong> Company UK Ltd.<br />
Group Personal Pension Plan and the Merloni Ireland Pension Plan under the pension rules applicable<br />
in the UK.<br />
In addition to the above companies, the following natural persons are also deemed to be related<br />
parties: members of the Board of Directors and the Board of Statutory Auditors, managers with<br />
strategic responsibility for management, planning and control activities, and the close family members<br />
of these parties, as defined in IAS 24.<br />
Schedules summarizing<br />
transactions with<br />
related parties<br />
The table on the next page summarizes balances and transactions with the related parties identified<br />
above, distinguishing between transactions with the Parent, associates and other related parties.<br />
In accordance with Consob Resolution no. 15519 dated 27 July 2006 and Consob Communication<br />
DEM/6064293 dated 28 July 2006, Attachments 3 and 4 present the consolidated income statement<br />
and statement of financial position showing transactions with related parties separately and indicating<br />
their percentage incidence with respect to each account caption.<br />
There have not been any significant, atypical and/or unusual transactions with related parties (except<br />
those with regard to the pension funds described above).<br />
107
Consolidated financial statements at 31 December <strong>2012</strong> – Notes<br />
Table summarizing the transactions with related parties - Income statement<br />
(million euro) 31.12.<strong>2012</strong> 31.12.2011<br />
Revenues 0.8 0.4<br />
Associates - -<br />
Parent 0.3 0.3<br />
Total 1.1 0.8<br />
Cost of sales<br />
Associates - -<br />
Other related parties (0.4) (0.5)<br />
Total (0.4) (0.5)<br />
Selling and distribution expenses<br />
Other related parties - -<br />
Associates - -<br />
Total 0.0 0.0<br />
General and administrative expenses<br />
Associates - -<br />
Other related parties (13.8) (11.2)<br />
Parent - -<br />
Total (13.8) (11.2)<br />
Net financial expenses<br />
Other related parties - -<br />
Parent - -<br />
Total - -<br />
Share of profits and (losses) of associates<br />
Other related parties - -<br />
Total 0.0 0.0<br />
The revenue and cost captions have essentially remained unchanged.<br />
108
Consolidated financial statements at 31 December <strong>2012</strong> – Notes<br />
Table summarizing the transactions with related parties - Statement of financial position<br />
(million euro) 31.12.<strong>2012</strong> 31.12.2011<br />
Property, plant and equipment<br />
Associates - -<br />
Other related parties - -<br />
Total - -<br />
Intangible assets with a finite life<br />
Associates - -<br />
Other related parties - -<br />
Total - -<br />
Current financial assets<br />
Other related parties - -<br />
Parent - -<br />
Associates - -<br />
Total - -<br />
Trade receivables<br />
Associates - -<br />
Other related parties 2.6 2.4<br />
Parent 0.3 0.2<br />
Total 2.9 2.6<br />
Trade payables<br />
Associates - -<br />
Other related parties 0.2 0.1<br />
Parent 0.0 0.0<br />
Total 0.2 0.1<br />
Other payables<br />
Parent - -<br />
Other related parties 0.0 0.0<br />
Total 0.0 0.0<br />
109
Consolidated financial statements at 31 December <strong>2012</strong> – Notes<br />
The amount due from Other related parties within Trade receivables mainly comprises 1.9 million<br />
euro due under a contract with Tecnosolare Carinaro S.r.l. that transferred land usage rights for<br />
the installation of solar panels at Carinaro and Teverola, and 0.6 million euro due from Merloni<br />
Progetti S.p.A.<br />
The cash flow absorbed by transactions with related parties was 0.1 million euro (0.5 million euro).<br />
110
Consolidated financial statements at 31 December <strong>2012</strong> – Attachments<br />
Attachments<br />
Attachment 1<br />
List of companies consolidated<br />
on a line-by-line basis<br />
Group interest (in %)<br />
Name Registered office Share capital Direct Indirect<br />
<strong>Indesit</strong> Argentina S.A. Argentina ARS 24,070,220 3.00 97.00<br />
<strong>Indesit</strong> Company Österreich Ges. mbH Österreich EUR 18,168.21 - 100.00<br />
<strong>Indesit</strong> Company Belgium S.A. Belgium EUR 150,000 - 100.00<br />
Wuxi <strong>Indesit</strong> Domestic Appliance Technology Co. Ltd. China EUR 900,000 - 100.00<br />
<strong>Indesit</strong> Company France S.A. France EUR 17,000,000 - 100.00<br />
FCT Cirano France - - -<br />
<strong>Indesit</strong> Company Deutschland GmbH Germany EUR 550,000 - 100.00<br />
Merloni Domestic Appliances Ltd. UK GBP 90,175,500 19.60 80.40<br />
<strong>Indesit</strong> Company UK Holdings Ltd. UK EUR 163,000,000 38.65 61.35<br />
General Domestic Appliances Holdings Ltd. UK GBP 26,000,000 - 100.00<br />
Airdum Ltd. UK GBP 15,000 - 100.00<br />
Cannon Industries Ltd. UK GBP 1.5 - 100.00<br />
General Domestic Appliances International Ltd. UK GBP 100,000 - 100.00<br />
Jackson Appliances Ltd. UK GBP 7.5 - 100.00<br />
<strong>Indesit</strong> Company UK Ltd. UK GBP 76,195,645 - 100.00<br />
Xpelair Ltd. UK GBP 8.25 - 100.00<br />
<strong>Indesit</strong> Ireland Ltd. Ireland EUR 100,000 - 100.00<br />
<strong>Indesit</strong> IP S.r.l. Italy EUR 10,000 100.00<br />
Aeradriatica S.p.A. Italy EUR 23,068,545 100.00 -<br />
Olympia Finance S.r.l. - Società Unipersonale Italy EUR 12,000 - -<br />
<strong>Indesit</strong> Company Luxembourg S.A. Luxembourg EUR 117,977,729 100.00 -<br />
<strong>Indesit</strong> Company International B.v. The Netherlands EUR 272,270 - 100.00<br />
<strong>Indesit</strong> Company Polska Sp.zo.o. Poland PLN 540,876,500 100.00 -<br />
<strong>Indesit</strong> Company Portugal Electrodomésticos S.A. Portugal EUR 1,144,100 - 99.44<br />
Fabrica Portugal S.A. Portugal EUR 11,250,000 - 96.40<br />
<strong>Indesit</strong> Company Ceská s.r.o. Czech Republic CZK 1,000,000 100.00 -<br />
Closed Joint Stock Company <strong>Indesit</strong> International ZAO Russia RUB 1,664,165,000 100.00 -<br />
<strong>Indesit</strong> Rus Llc Russia RUB 4,340,000 100.00 -<br />
<strong>Indesit</strong> Electrodomesticos S.A. Spain EUR 1,000,000 78.95 21.05<br />
<strong>Indesit</strong> Company Nordics AB Sweden SEK 50,000 100.00<br />
<strong>Indesit</strong> Company International Business S.A. Switzerland SFR 250,000 - 100.00<br />
<strong>Indesit</strong> Company Beyaz Esya Sanayi ve Ticaret A.S. Turkey TRY 134,038,073 36.16 63.84<br />
<strong>Indesit</strong> Company Beyaz Esya Pazarlama A.S. Turkey TRY 5,167,994 100.00 -<br />
<strong>Indesit</strong> Middle East FZE UAE AED 1,000,000 - 100.00<br />
<strong>Indesit</strong> Ukraine LLC Ukraine UAH 11,234,634 100.00 -<br />
<strong>Indesit</strong> Company Magyarország Kft Hungary HUF 25,000,000 - 100.00<br />
111
Consolidated financial statements at 31 December <strong>2012</strong> – Attachments<br />
Attachment 2<br />
List of other investments in<br />
subsidiaries and associates<br />
Group interest (in %)<br />
Name Registered office Share capital Direct Indirect<br />
<strong>Indesit</strong> Company Bulgaria S.r.l.u. Bulgary BGL 7,805,000 100.00 -<br />
<strong>Indesit</strong> Company Domestic Appliances Hellas Mepe Greece EUR 18,000 - 100.00<br />
<strong>Indesit</strong> Company Norge Ltd. Norway NOK 100,000 - 100.00<br />
Tradeplace B.V. The Netherlands EUR 30,000 20.00 -<br />
<strong>Indesit</strong> Company Singapore Pte. Ltd. Singapore SGD 100,000 - 100.00<br />
112
Consolidated financial statements at 31 December <strong>2012</strong> – Attachments<br />
Attachment 3<br />
Consolidated income<br />
statement for the year<br />
ended 31 December <strong>2012</strong>,<br />
prepared in accordance<br />
with Consob Resolution<br />
no. 15519 dated 27 July 2006<br />
and Consob Communication<br />
no. DEM/6064293 dated<br />
28 July 2006<br />
<strong>2012</strong> 2011<br />
Of which<br />
with related<br />
parties<br />
Of which<br />
with related<br />
parties<br />
Of which<br />
Of which<br />
(million euro)<br />
Balances non recurring<br />
Balances non recurring<br />
Revenue 2,886.0 - 1.1 2,825.3 - 0.8<br />
Cost of sales (2,177.5) 5.5 (0.4) (2,098.4) 4.8 (0.5)<br />
Selling and distribution expenses (466.6) 12.6 0.0 (462.9) 4.8 -<br />
General and administrative expenses (109.3) 4.4 (13.8) (113.6) (0.9) (11.2)<br />
Operating profit 132.6 150.3<br />
Interest expenses (25.8) - - (19.6) - -<br />
Interest income 2.9 - - 1.9 - -<br />
Exchange rate differences and other net financial<br />
expenses (7.9) - - (20.4) - -<br />
Share of profit (losses) of associates 0.3 - - 0.9 - -<br />
Profit before tax 102.3 113.2<br />
Income tax * (40.0) - n.a. (54.2) - n.a.<br />
Profit for the year 62.3 59.0<br />
<strong>2012</strong> 2011<br />
Of which<br />
with related<br />
parties<br />
Of which<br />
with related<br />
parties<br />
Percentage weight over consolidated income<br />
statement items<br />
Balances<br />
Of which<br />
non recurring<br />
Balances<br />
Of which<br />
non recurring<br />
Revenue 100% 0.0% 0.0% 100% 0.0% 0.0%<br />
Cost of sales 100% -0.3% 0.0% 100% -0.2% 0.0%<br />
Selling and distribution expenses 100% -2.7% 0.0% 100% -1.0% 0.0%<br />
General and administrative expenses 100% -4.1% 12.7% 100% 0.8% 9.9%<br />
Operating profit 100% 100%<br />
Interest expenses 100% 0.0% 0.0% 100% 0.0% 0.0%<br />
Interest income 100% 0.0% 0.0% 100% 0.0% 0.0%<br />
Exchange rate differences and other net financial<br />
expenses 100% 0.0% 0.0% 100% 0.0% 0.0%<br />
Share of profit (losses) of associates 100% 0.0% 0.0% 100% 0.0% 0.0%<br />
Profit before tax 100% 100%<br />
Income tax * 100% 0% n.a. 100% 0.0% n.a.<br />
Profit for the year 100% 100%<br />
* Tax effects calculated referring to the tax rate of the countries in which the transaction took place.<br />
113
Consolidated financial statements at 31 December <strong>2012</strong> – Attachments<br />
Attachment 4<br />
Consolidated statement<br />
of financial position<br />
at 31 December <strong>2012</strong>,<br />
prepared in accordance<br />
with Consob Resolution<br />
no. 15519 dated 27 July 2006<br />
and Consob Communication<br />
no. DEM/6064293 dated<br />
28 July 2006<br />
Million euro and percentage weight<br />
over consolidated balance sheet items<br />
Assets<br />
Balances<br />
31.12.<strong>2012</strong> 31.12.2011<br />
Of which<br />
with related<br />
parties Weight % Balances<br />
Of which<br />
with related<br />
parties Weight %<br />
Property, plant and equipment 673.1 - - 623.2 - -<br />
Goodwill and other intangible assets with an indefinite<br />
useful life 242.2 - - 236.5 - -<br />
Other intangible assets with a finite life 103.8 - - 100.1 - -<br />
Investments in associates 0.5 - - 0.5 - -<br />
Other non-current assets 92.0 - - 41.0 - -<br />
Deferred tax assets 77.7 - - 64.3 - -<br />
Other non-current financial assets 1.5 - - 1.5 - -<br />
Total non-current assets 1,190.8 - 1,067.0 -<br />
Inventories 331.8 - - 323.2 - -<br />
Trade receivables 465.3 2.9 0.6% 440.5 2.6 0.6%<br />
Current financial assets 29.4 - - 20.9 - -<br />
Tax receivables 20.3 - - 12.9 - -<br />
Other receivables and current assets 75.4 - - 67.8 - -<br />
Cash and cash equivalents 142.8 234.4 - -<br />
Assets held for sale 20.4 - - 11.8 - -<br />
Total current assets 1,085.4 1,111.4<br />
Total assets 2,276.1 2,178.5<br />
114
Consolidated financial statements at 31 December <strong>2012</strong> – Attachments<br />
Million euro and percentage weight<br />
over consolidated balance sheet items<br />
Equity<br />
Balances<br />
31.12.<strong>2012</strong> 31.12.2011<br />
Of which<br />
with related<br />
parties Weight % Balances<br />
Of which<br />
with related<br />
parties Weight %<br />
Share capital 92.8 - - 92.8 - -<br />
Reserves (24.1) - - (67.2) - -<br />
Retained earnings 504.8 - - 469.7 - -<br />
Profit attributable to owners of the Parent 62.3 - - 58.8 - -<br />
Equity attributable to owners of the Parent 635.8 - 554.1 -<br />
Non-controlling interests 0.0 - - 0.0 - -<br />
Total equity 635.8 - 554.2 -<br />
Liabilities<br />
Non-current loans and borrowings 232.3 - - 246.3 - -<br />
Employee benefits 44.7 - - 45.4 - -<br />
Provisions for risks and charges 50.1 - - 48.6 - -<br />
Deferred tax liabilities 50.2 - - 38.4 - -<br />
Other non-current liabilities 29.9 - - 34.9 - -<br />
Total non-current liabilities 407.1 - 413.6 -<br />
Banks and other loans and borrowings 197.8 - - 228.7 - -<br />
Provisions for risks and charges 64.4 - - 58.6 - -<br />
Trade payables 844.8 0.2 0.0% 788.8 0.1 0.0%<br />
Tax payables 23.6 - - 27.6 - -<br />
Other payables 102.7 - - 107.2 - -<br />
Total current liabilities 1,233.1 1,210.7<br />
Total liabilities 1,640.3 1,624.3<br />
Total equity and liabilities 2,276.1 2,178.5<br />
115
Consolidated financial statements at 31 December <strong>2012</strong> – Attachments<br />
Attachment 5<br />
Summary of the fees charged<br />
by the audit company and the<br />
network for services provided<br />
to the Group during the year,<br />
prepared pursuant to<br />
art. 149-duodecies of Issuers’<br />
Regulation no. 11971 dated<br />
14 May 1999 and subsequent<br />
amendments<br />
Services Service Supplier Beneficiary<br />
Fees<br />
(thousand euro)<br />
Audit KPMG S.p.A. Parent 1,151<br />
KPMG S.p.A. * Subsidiaries 372<br />
KPMG network Subsidiaries 1,000<br />
Other services<br />
- Agreed-upon procedures KPMG S.p.A. Parent 75<br />
- Agreed-upon procedures KPMG S.p.A. Subsidiaries 9<br />
- Agreed-upon procedures KPMG network Subsidiaries 14<br />
- Tax and advisory services KPMG network Parent 90<br />
- Tax and advisory services KPMG network Subsidiaries 72<br />
Total 2,783<br />
* The audit has been carried out by KPMG S.p.A. with the assistance of the KPMG network, present in the countries where the<br />
subsidiaries operate.<br />
Milan, 21 March 2013<br />
For the Board of Directors<br />
The Chairman<br />
(signed on the original)<br />
Andrea Merloni<br />
116
Consolidated financial statements at 31 December <strong>2012</strong> – Attachments<br />
Statement of compliance of the Consolidated financial statements<br />
at 31 December <strong>2012</strong> pursuant to art. 81-ter of Consob Regulation no. 11971<br />
dated 14 May 1999 and subsequent amendments and additions<br />
The Chief Executive Officer Marco Milani and the Manager in charge of financial reporting, Stefano<br />
Cavacini, pursuant to paras. 3 and 4 of art. 154-bis of Legislative Decree no. 58 dated 24 February 1998,<br />
hereby confirm:<br />
––<br />
the adequacy with respect to the Company’s structure, and<br />
––<br />
the effective application<br />
throughout <strong>2012</strong> of the administrative and accounting procedures applied for the preparation of the<br />
Consolidated financial statements.<br />
The undersigned also confirm that the <strong>2012</strong> Consolidated financial statements:<br />
––<br />
have been prepared in accordance with International Financial <strong>Report</strong>ing Standards, as endorsed<br />
by the European Union pursuant to Regulation (EC) no. 1606/2002 of the European Parliament and<br />
of the Council, dated 19 July 2002;<br />
––<br />
agree with the company books and accounting records;<br />
––<br />
are suitable for the purpose of providing a true and fair view of the financial position and results of<br />
operations of the Issuer and the Group as a whole.<br />
The report on operations includes a reliable analysis of the performance, results of operations and<br />
financial position of the Issuer and the Group as a whole, as well as a description of the principal risks and<br />
uncertainties to which they are exposed.<br />
21 March 2013<br />
The Chief Executive Officer<br />
(signed on the original)<br />
Marco Milani<br />
The Manager in charge of financial reporting<br />
(signed on the original)<br />
Stefano Cavacini<br />
117
Consolidated financial statements at 31 December <strong>2012</strong> – Attachments<br />
<strong>Report</strong> of the independent auditors<br />
118
Consolidated financial statements at 31 December <strong>2012</strong> – Attachments<br />
119
Separate financial statements at 31 December <strong>2012</strong>
Separate financial statements at 31 December <strong>2012</strong> – Contents<br />
Contents<br />
122 Separate financial<br />
statements<br />
122 Separate income statement<br />
123 Separate statement of comprehensive income<br />
124 Separate statement of financial position<br />
125 Separate cash flow statement<br />
126 Statement of changes in separate equity<br />
127 Notes<br />
127 Company structure and activities<br />
Approval of the separate financial statements at 31 December <strong>2012</strong><br />
Significant subsequent events<br />
Statement of compliance with international accounting standards and basis<br />
of presentation<br />
128 Principal accounting policies<br />
143 Notes to the separate income statement<br />
154 Notes to the separate statement of financial position<br />
178 Notes to the separate cash flow statement<br />
180 Financial instruments<br />
184 Information required by IAS 24 on the remuneration of management and on related<br />
parties<br />
189 Attachments<br />
189 List of direct and indirect companies<br />
190 Separate income statement the year ended 31 December <strong>2012</strong>, prepared in<br />
accordance with Consob Resolution no. 15519 dated 27 July 2006 and Consob<br />
Communication no. DEM/6064293 dated 28 July 2006<br />
192 Separate statement of financial position at 31 December <strong>2012</strong>, prepared in accordance<br />
with Consob Resolution no. 15519 dated 27 July 2006 and Consob Communication no.<br />
DEM/6064293 dated 28 July 2006<br />
193 Separate income statement for the year ended 31 December <strong>2012</strong> classified by function<br />
194 List of investments in subsidiaries and associates<br />
196 Summary of the availability of reserves<br />
197 Summary of the fees charged by the audit company and the members of its network<br />
for services provided to the Company during the year, prepared pursuant to<br />
art. 149-duodecies of Issuers’ Regulation no. 11971 dated 14 May 1999 and subsequent<br />
amendments<br />
198 Statement of compliance of the Separate financial statements at 31 December <strong>2012</strong><br />
pursuant to art. 154-bis of Legislative Decree 58/1998<br />
199 <strong>Report</strong> of the independent auditors<br />
121
Separate financial statements at 31 December <strong>2012</strong> – Separate financial statements<br />
Separate financial statements at 31 December <strong>2012</strong><br />
Separate financial statements<br />
<strong>Indesit</strong> Company S.p.A.<br />
Separate income statement for the year ended 31 December <strong>2012</strong> 1<br />
(million euro) Note Year <strong>2012</strong> Year 2011<br />
Revenue from sales and services 6.1 1,017.5 1,108.1<br />
Change in work in progress, semi-finished and finished products 6.2 (12.6) 0.8<br />
Other revenue and income 6.3 100.9 91.1<br />
Purchase of raw materials, services, leases and rentals 6.4 (838.4) (921.3)<br />
Payroll costs 6.5 (206.7) (212.7)<br />
Depreciation, amortisation and impairment losses 6.6 (59.0) (59.3)<br />
Change in raw materials, components and consumables 6.7 (4.7) 0.2<br />
Provisions and other operating expenses 6.8 (28.2) (10.4)<br />
Operating profit 6.9 (31.2) (3.5)<br />
Dividends from subsidiaries, associates and others 6.10 109.2 51.0<br />
Interest income from subsidiaries and associates 6.11 1.9 2.8<br />
Interest income from third parties 6.12 0.0 0.0<br />
Interest expenses from subsidiaries and associates 6.13 (10.1) (8.6)<br />
Interest expenses from third parties and the Parent 6.14 (15.0) (13.2)<br />
Exchange rate differences 6.15 0.1 (0.4)<br />
Reversal of impairment losses on investments 6.16 0.0 0.0<br />
Impairment losses on investments 6.17 (9.2) (0.9)<br />
Net financial income and expenses 76.9 30.7<br />
Profit before tax 45.7 27.2<br />
Income tax expense 6.18 0.2 (16.7)<br />
Profit for the year 45.9 10.4<br />
1. Pursuant to Consob Resolution no. 15519 dated 27 July 2006, the effects of related-party and non-recurring<br />
transactions on the separate income statement are reported in Attachment 2 and in note 6.9.<br />
122
Separate financial statements at 31 December <strong>2012</strong> – Separate financial statements<br />
Separate statement of comprehensive income for the year ended 31 December <strong>2012</strong><br />
(million euro) Note Year <strong>2012</strong> Year 2011<br />
Profit for the year (A) 45.9 10.4<br />
Losses on cash flow hedges, net of tax 7.10 (0.5) (4.3)<br />
Total Other comprehensive losses, net of tax (B) (0.5) (4.3)<br />
Total Comprehensive income (A + B) 45.4 6.1<br />
123
Separate financial statements at 31 December <strong>2012</strong> – Separate financial statements<br />
Separate statement of financial position at 31 December <strong>2012</strong>2 2<br />
(million euro) Note 31.12.<strong>2012</strong> 31.12.2011<br />
Assets<br />
Property, plant and equipment 7.1 179.6 190.7<br />
Goodwill and other intangible assets with an indefinite life - -<br />
Other intangible assets with a finite life 7.2 72.6 69.8<br />
Investments in associates 7.3 0.5 0.5<br />
Other non-current assets 7.4 667.3 455.6<br />
Deferred tax assets 7.5 32.4 24.0<br />
Other non-current financial assets 7.11.4 0.4 50.0<br />
Total non-current assets 952.9 790.5<br />
Inventories 7.6 90.3 107.6<br />
Trade receivables 7.7 418.3 406.0<br />
Current financial assets 7.11.1 37.3 137.5<br />
Tax receivables 7.8 5.2 1.4<br />
Other receivables and current assets 7.9 19.8 26.2<br />
Cash and cash equivalents 7.11.2 10.2 9.1<br />
Assets held for sale - 7.1<br />
Total current assets 581.1 695.0<br />
Total assets 1,534.0 1,485.6<br />
Equity<br />
Share capital 92.8 92.8<br />
Reserves 46.2 46.7<br />
Retained earnings 324.4 337.7<br />
Profit for the year 45.9 10.4<br />
Total equity 7.10 509.3 487.7<br />
Liabilities<br />
Medium and long-term loans and borrowings 7.11.5 232.4 248.1<br />
Employee benefits 7.12 35.2 38.1<br />
Provisions for risks and charges 7.13 23.4 18.7<br />
Deferred tax liabilities 7.14 - -<br />
Other non-current liabilities 7.15 14.6 15.8<br />
Total non-current liabilities 305.6 320.7<br />
Banks and other short-term loans and borrowings 7.11.3 233.3 181.4<br />
Provisions for risks and charges 7.13 37.9 36.2<br />
Trade payables 7.16 391.6 400.2<br />
Tax payables 7.17 8.3 12.5<br />
Other payables 7.18 48.0 46.9<br />
Total current liabilities 719.1 677.2<br />
Total liabilities 1,024.6 997.9<br />
Total equity and liabilities 1,534.0 1,485.6<br />
2. Pursuant to Consob Resolution no. 15519 dated 27 July 2006, the effects of related-party transactions on the<br />
separate statement of financial position are reported in Attachment 3 and in note 10.3. In addition, the financial<br />
effects of non-recurring transactions are described in note 6.9.<br />
124
Separate financial statements at 31 December <strong>2012</strong> – Separate financial statements<br />
Separate cash flow statement for the year ended 31 December <strong>2012</strong> 3<br />
(million euro) Note Year <strong>2012</strong> Year 2011<br />
Profit for the year 8.1 45.9 10.4<br />
Income taxes 8.1 (0.2) 16.7<br />
Impairment losses on investments and other financial assets 8.1 1.3 0.9<br />
Depreciation and amortisation 8.1 59.0 59.3<br />
Other non-monetary expenses, net 8.2 (93.1) (16.1)<br />
Change in trade receivables 8.3 (12.3) 59.4<br />
Change in inventories 8.3 17.4 (0.9)<br />
Change in trade payables 8.3 (4.9) (86.4)<br />
Change in other assets and liabilities 8.4 11.7 (47.4)<br />
Income taxes 8.1 (10.9) (9.3)<br />
Interest paid 8.2 (12.9) (14.8)<br />
Interest received 8.2 2.2 2.6<br />
Cash flows from (used in) operating activities 3.2 (25.5)<br />
Acquisition of property, plant and equipment 8.5 (34.4) (32.0)<br />
Proceeds from sale of property, plant and equipment 8.5 6.6 7.6<br />
Acquisition of intangible assets 8.6 (27.6) (25.4)<br />
Proceeds from sale of intangible assets 8.6 0.8 0.9<br />
Acquisition of non-current financial assets 8.7 (109.0) (2.8)<br />
Proceeds from sale of non-current financial assets 8.7 0.0 0.0<br />
Cash flows from (used in) investing activities (163.6) (51.5)<br />
Change in hedging reserve on derivatives 8.8 (0.5) (4.3)<br />
Dividends paid 8.8 (23.7) (31.0)<br />
Dividends received 8.9 104.8 28.8<br />
New short/medium/long-term loans and borrowings 8.10 0.0 75.0<br />
Repayments of short/medium/long-term loans and borrowings 8.10 (15.7) (2.3)<br />
Change in short, medium and long-term financial liabilities/assets 8.11 96.6 11.5<br />
Cash flows from (used in) financing activities 161.4 77.6<br />
Net cash flows 1.1 0.6<br />
Cash and cash equivalents, start of year 7.11 9.1 8.5<br />
Cash and cash equivalents, end of year 7.11 10.2 9.1<br />
Total change in cash and cash equivalents 1.1 0.6<br />
3. Pursuant to Consob Resolution no. 15519 dated 27 July 2006, the financial effects of related-party transactions are<br />
reported in note 10.3. In addition, the financial effects of non-recurring transactions are described in note 7.13.<br />
125
Separate financial statements at 31 December <strong>2012</strong> – Separate financial statements<br />
Statement of changes in separate equity for year ended 31 December <strong>2012</strong> and 2011<br />
(million euro)<br />
Opening balances<br />
Other losses, net of taxation<br />
Profit for the year<br />
Statement of changes in separate equity<br />
at 31 December <strong>2012</strong><br />
Share capital 92.8 - - - - - - - 92.8<br />
Share premium reserve 35.9 - - - - - - - 35.9<br />
Legal reserve 22.7 - - - - - - - 22.7<br />
Other reserves (11.9) (0.5) - (0.5) - - - - (12.4)<br />
Retained earnings 337.7 - - - (23.7) - 10.4 (13.3) 324.4<br />
Profit for the year 10.4 - 45.9 45.9 - - (10.4) (10.4) 45.9<br />
Total equity 487.7 (0.5) 45.9 45.4 (23.7) - - (23.7) 509.3<br />
Total comprehensive income<br />
(Losses)<br />
Dividends paid<br />
Exercise of stock option rights<br />
Allocation of profit for the year<br />
Total effects of transactions<br />
with owners of Parent<br />
Closing balances<br />
Statement of changes in separate equity<br />
at 31 December 2011<br />
Share capital 92.8 - - - - - - - 92.8<br />
Share premium reserve 35.9 - - - - - - - 35.9<br />
Legal reserve 22.7 - - - - - - - 22.7<br />
Other reserves (7.6) (4.3) 0.0 (4.3) - - - - (11.9)<br />
Retained earnings 312.8 - 0.0 - (31.0) - 55.9 24.9 337.7<br />
Profit for the year 55.9 - 10.4 10.4 - - (55.9) (55.9) 10.4<br />
Total equity 512.5 (4.3) 10.4 6.1 (31.0) - - (31.0) 487.7<br />
126
Separate financial statements at 31 December <strong>2012</strong> – Notes<br />
Separate financial statements at 31 December <strong>2012</strong><br />
Notes<br />
1. Company structure and activities<br />
<strong>Indesit</strong> Company S.p.A., Parent of the <strong>Indesit</strong> Company Group, is an Italian company based in Fabriano<br />
(near Ancona) that is active in the production and sale of white goods, namely household appliances<br />
for the cooking sector (cookers, ovens and hobs), the cooling sector (refrigerators and freezers) and<br />
the washing sector (washing machines, dryers, combined washer-dryers and dishwashers). <strong>Indesit</strong><br />
Company S.p.A. carries out the following functions:<br />
• commercialization of household appliances (produced in Italy and elsewhere) and supply of<br />
ancillary services to the Italian market and other minor markets abroad;<br />
• supply of goods produced at Italian factories or purchased in Italy and, to a lesser extent, of related<br />
services to other Group companies;<br />
• normal holding company functions for the benefit of Group companies.<br />
The household appliances sector is highly seasonal, which affects all the main economic and financial<br />
parameters. The segment information required by IFRS 8 is provided in the consolidated financial<br />
statements published together with these separate financial statements for <strong>Indesit</strong> Company S.p.A.<br />
2. Approval of the separate financial statements at 31 December <strong>2012</strong><br />
The separate financial statements at 31 December <strong>2012</strong> were approved by the Board of Directors on<br />
21 March 2013 and have been audited. The Shareholders’ Meeting called to approve the separate<br />
financial statements has the right to make changes to them.<br />
The Board of Directors also approved the consolidated financial statements of the <strong>Indesit</strong> Company<br />
Group on the same date.<br />
3. Significant subsequent events<br />
No significant events or transactions have taken place subsequent to year end.<br />
4. Statement of compliance with international accounting standards and basis of<br />
presentation<br />
The separate financial statements of <strong>Indesit</strong> Company S.p.A. have been prepared in accordance with<br />
the International Financial <strong>Report</strong>ing Standards - IFRSs TM (hereafter referred to as IFRS or IAS) issued<br />
by the International Accounting Standards Board (IASB) as interpreted by the International Financial<br />
<strong>Report</strong>ing Interpretations Committee (IFRIC) and endorsed by the European Union.<br />
The separate financial statements at 31 December <strong>2012</strong> have also been prepared in accordance with<br />
Consob’s instructions regarding the format of financial statements, in application of art. 9 of Decree<br />
38/2005 and other Consob regulations and instructions concerning financial statements.<br />
127
Separate financial statements at 31 December <strong>2012</strong> – Notes<br />
The separate financial statements at 31 December <strong>2012</strong> are presented on a comparative basis and<br />
comprise the statement of financial position, the income statement, the statement of comprehensive<br />
income, the cash flow statement, the statement of changes in equity and these explanatory notes. The<br />
income statement format adopted by the Company classifies costs by type of expenditure, while the<br />
statement of financial position distinguishes between current and non-current assets and liabilities. The<br />
cash flow statement is presented using the indirect method.<br />
In addition, for consistency with the income statement format adopted for the consolidated financial<br />
statements (classification by purpose of expenditure), the separate income statement reclassified by<br />
purpose of expenditure is also attached to these financial statements.<br />
The report on operations during <strong>2012</strong>, prepared on a combined basis, provides information about the<br />
results of both the Group and the Parent.<br />
5. Principal accounting policies<br />
5.1 Basis<br />
of preparation<br />
and accounting<br />
policies adopted<br />
Basis of preparation<br />
The currency of presentation of the separate financial statements is the euro, and the financial<br />
statement balances are stated in millions of euro (except where stated otherwise). The separate<br />
financial statements are prepared on an historical cost basis, except with regard to derivative<br />
financial instruments, financial assets held for sale and financial instruments classified as available<br />
for sale, which are stated at their fair value. The financial statements are also prepared on a goingconcern<br />
basis.<br />
There are no financial assets held to maturity. Financial transactions are recognised with reference to<br />
the trade date.<br />
The accounting policies adopted for the preparation of the separate financial statements at 31<br />
December <strong>2012</strong> have also been applied on a consistent basis to all the comparative financial<br />
information.<br />
Reclassifications<br />
Accounting estimates<br />
In order to improve the presentation of financial information, from 1 January <strong>2012</strong> revenue<br />
from the recharge of costs to other Group companies has been reclassified to reflect<br />
the composition of such costs within the income statement. In particular, general and<br />
administrative expenses have been reclassified down to 32.2 million while the cost of sales and<br />
selling and distribution expenses were reclassified to increase to, respectively, 15.2 million euro<br />
and 17.1 million euro.<br />
The preparation of separate financial statements involves making assumptions and estimates that<br />
affect the value of assets and liabilities and the related explanatory information, as well as the value<br />
of contingent assets and liabilities at the reference date. These estimates are used to measure the<br />
property, plant and equipment and intangible assets subject to impairment, as well as to recognize<br />
provisions for doubtful accounts, inventory obsolescence, depreciation and amortization and the<br />
write-down of assets, employee benefits, taxation, and risks and charges. The estimates and underlying<br />
assumptions are based on historical experience and various other factors believed reasonable at the<br />
time of making them.<br />
128
Separate financial statements at 31 December <strong>2012</strong> – Notes<br />
Estimates and assumptions are reviewed regularly and, if later estimates differ from those made initially,<br />
the effects - which obviously cannot be estimated or forecast at this time - are immediately reflected<br />
in the income statement. If the changes in estimate relate to both the current and future periods, their<br />
effects are reflected in the income statements for the periods concerned.<br />
The principal measurement processes and the key assumptions used by management in applying the<br />
accounting policies in relation to the future are summarized below. These processes and assumptions<br />
may have a significant effect on the amounts reported in the separate financial statements, or may give<br />
rise to the risk of significant adjustments in the next accounting period to the carrying amount of assets<br />
and liabilities.<br />
Allowance for doubtful accounts<br />
The allowance for doubtful accounts reflects management’s estimate of the losses that may be<br />
incurred on trade receivables. Provisions to the allowance for doubtful accounts by the Company are<br />
determined with reference to the ageing of receivables, taking account of specific circumstances if this<br />
is more prudent, and available guarantees.<br />
Provision for inventory obsolescence<br />
The provision for inventory obsolescence reflects management’s estimate of the losses to be incurred<br />
on raw materials, semi-finished and finished products, determined with reference to the life-cycle of<br />
each product and stock rotation statistics that take account of both past and forecast consumption.<br />
Recoverable value of non-current assets<br />
Non-current assets comprise property, plant and equipment, intangible assets and other financial<br />
assets. Management reviews the carrying amounts of the non-current assets held and used, and of<br />
any assets due to be retired. This work is performed whenever events and circumstances require such<br />
review, and at least each year for intangible assets with an indefinite life. The review makes reference<br />
to the results of independent appraisals and/or to the cash flows expected from the use or sale of the<br />
assets concerned, applying suitable discount rates for the determination of their present value. When<br />
the carrying amount of a non-current asset is impaired, the Company recognizes as a writedown<br />
the difference between its carrying amount and the lower value recoverable from its use or sale, as<br />
determined by reference to the most recent business plans.<br />
Defined-benefit plans<br />
The Company maintains defined benefit plans for certain employees. Management uses various<br />
statistical assumptions and measurement factors to anticipate future events and calculate the related<br />
charges, as well as the present value of liabilities. The assumptions made relate to the discount rate,<br />
the rate of future pay increases, demographic trends, the inflation rate and the forecast cost of medical<br />
care. In addition, the Company’s consulting actuaries consider such subjective factors as mortality and<br />
termination rates.<br />
Realizability of deferred tax assets<br />
The Company recognizes deferred tax assets and the theoretical tax benefit of carried-forward tax<br />
losses. Management records deferred tax assets to the extent that their recoverability is considered<br />
likely. In the determination of values were considered the results of budgets and forecasts for future<br />
years declined for the main lines of the income statement of the company (on the basis of the<br />
guidelines of the Strategic Plan), through the use of a new management application.<br />
129
Separate financial statements at 31 December <strong>2012</strong> – Notes<br />
Contingent liabilities<br />
The Company is exposed to the risk of having to meet obligations deriving from legal and other<br />
disputes, without being able to predict with certainty the extent of the related outflows. This inability is<br />
often associated with the variety, proliferation and complexity of the jurisdictions and laws concerned,<br />
that may be subject to uncertain interpretations, as well as with the varying levels of predictability<br />
surrounding the facts and circumstances relating to each dispute. The Company makes reference to<br />
economists, consultants and legal experts in order to monitor appropriately the related risks, and tackle<br />
and assess the contingencies concerned. If, as a consequence, a financial outflow is deemed probable<br />
and the amount can reasonably be estimated, the Company records a related provision for risks and<br />
charges. If a financial outflow is considered possible or, in extremely rare circumstances, probable<br />
without being able to determine the amount, the situation is reported in the explanatory notes.<br />
Treatment of foreign<br />
currency transactions<br />
Foreign currency transactions<br />
All transactions are recognised in euro. Transactions not carried out in euro are translated using the<br />
exchange rates ruling at the time they take place. Monetary assets and liabilities (defined as assets and<br />
liabilities held for collection or payment, whose amount is fixed or determinable - IAS 21) are translated<br />
using the exchange rates applying at the reporting date and any exchange rate differences are<br />
recognized in the income statement. Non-monetary assets and liabilities recognised at historical cost<br />
in currencies other than the euro are translated using the historical rates applying at the time of the<br />
related transactions. Non-monetary assets and liabilities measured at fair value in currencies other than<br />
the euro are translated using the exchange rates ruling at the time that their fair value was determined.<br />
Derivative financial instruments<br />
If the conditions established in IAS 39 regarding the formal designation of derivative financial<br />
instruments as hedges are met and these instruments are shown to be highly effective, both ex ante<br />
when the transaction is arranged and ex post during subsequent accounting periods, then they are<br />
recognised on a hedge accounting basis, as described below.<br />
Fair Value Hedges (hedges of assets and liabilities)<br />
If a derivative financial instrument is designated to hedge the risk of changes in the fair value of a<br />
recognized asset or liability (the underlyings), the gain or loss from subsequent fair-value adjustments<br />
to the hedging instrument is recognized in the income statement together with the gain or loss<br />
deriving from the measurement of the related underlyings.<br />
Cash Flow Hedges<br />
If a derivative financial instrument is designated as a hedge of the risk of variability in the cash flows<br />
of a recognized asset or liability or a highly probable forecast transaction, the effective part of gains<br />
or losses on such financial instrument is recognized in the hedging reserve, within equity, while the<br />
ineffective portion (if any) is taken to the income statement. If the hedge of a forecast transaction<br />
subsequently results in the recognition of a non-financial asset or liability, the hedging reserve is<br />
removed from equity and included in the initial cost of such non-financial asset or liability. If the<br />
hedge of a forecast transaction subsequently results in the recognition of a financial asset or liability,<br />
the hedging reserve is released to the income statement in the period when the asset acquired or<br />
recognized liability has an effect on the income statement. In other cases, the hedging reserve is<br />
released to the income statement in a manner consistent with the hedged transaction i.e. when its<br />
economic effects are recognized. If a hedging instrument expires, is sold or is terminated early with<br />
respect to the timing of the hedged transaction and the latter is no longer expected to take place,<br />
130
Separate financial statements at 31 December <strong>2012</strong> – Notes<br />
the related hedging reserve is released immediately to the income statement. If however the hedged<br />
transaction is still expected to take place, the accumulated gain or loss is retained in equity until the<br />
event occurs.<br />
Hedge of a net investment in a foreign operation<br />
If a derivative financial instrument is designated to hedge a net investment in a foreign operation, the<br />
gains or losses deriving from the related measurement of fair value are recognized directly in equity, to<br />
the extent that the hedge is deemed to be effective, while the ineffective portion (if any) is recognized<br />
in the income statement.<br />
Financial instruments not covered by hedge accounting<br />
If financial instruments do not meet the requirements for the application of hedge accounting methodology,<br />
they are stated at fair value and the related effects are recognized directly in the income statement.<br />
Property, plant<br />
and equipment<br />
Owned assets<br />
Property, plant and equipment are stated at purchase cost or, if self-constructed, at production cost,<br />
comprising the cost of materials, labor and a reasonable portion of overheads and related charges.<br />
They are stated net of accumulated depreciation and any impairment of value determined on the basis<br />
described below. If necessary and significant, the cost of property, plant and equipment includes an<br />
initial estimate of dismantling and removal costs. Ordinary maintenance expenses are charged to the<br />
income statement, while the costs of replacing certain parts of property, plant and equipment and<br />
extraordinary maintenance costs are capitalized when it is probable that they will generate measurable<br />
economic benefits in the future.<br />
Any borrowing costs incurred on the acquisition or construction of capitalized assets that normally<br />
require time before they become available for use or for sale, are also capitalized and amortized over<br />
the useful life of the asset class concerned. All other borrowing costs are charged to the income<br />
statement for the year to which they relate.<br />
Finance leasing of fixed assets<br />
Property, plant and equipment held under finance leases, in relation to which <strong>Indesit</strong> Company S.p.A. has<br />
assumed substantially all the risks and rewards of ownership, are recognized at fair value at inception of<br />
the lease or, if lower, at the present value of the minimum lease payments. They are depreciated over their<br />
estimated useful lives and adjusted for any impairment loss determined on the basis described below. The<br />
liability to the lessor is classified among financial payables in the statement of financial position.<br />
Depreciation<br />
Property, plant and equipment are depreciated on a straight-line basis over their estimated<br />
useful lives. Significant parts of plant and machinery with different useful lives are depreciated<br />
separately. Useful lives are monitored on a constant basis, having regard for changes in the<br />
intensity with which these assets are used. Any changes in the depreciation schedules are applied<br />
on a prospective basis.<br />
Carrying amount is verified with reference to the estimated present value of expected future cash flows<br />
and adjusted, where necessary, every time events suggest that the carrying amount of property, plant<br />
and equipment may be impaired, or when there is a marked decrease in their market value, significant<br />
technological changes or evidence of significant obsolescence. Such write-downs are reversed if the<br />
reasons for recording them cease to apply. Land, whether or not used for the construction of civil or<br />
131
Separate financial statements at 31 December <strong>2012</strong> – Notes<br />
industrial buildings, is not depreciated since it is deemed to have an indefinite useful life.<br />
The useful lives of tangible fixed assets are grouped into the following categories:<br />
Category<br />
Useful lives<br />
Buildings and temporary constructions<br />
from 10 to 33 years<br />
Plant and machinery<br />
from 7 to 20 years<br />
Industrial and commercial equipment<br />
from 4 to 20 years<br />
Other assets:<br />
- vehicles and internal transport from 4 to 5 years<br />
- furniture, EDP and office machines from 5 to 10 years<br />
Intangible assets<br />
Intangible assets are stated at cost, determined on the basis described for property, plant and equipment,<br />
when it is likely that the use of such assets will generate economic benefits and their cost can be<br />
determined reliably. Intangible assets with a finite useful life are amortized and stated net of both the related<br />
accumulated amortization, provided on a straight-line basis over their estimated useful lives, having regard<br />
for the period during which they are expected to generate economic benefits, and any impairment in their<br />
value. Intangible assets with an indefinite useful life, comprising certain brand names and goodwill, are not<br />
amortized but their recoverability is tested for impairment at least once each year. Subsequent expenditure<br />
on recognized intangible assets is capitalized only if it increases the future economic benefits embodied in<br />
the specific asset to which it relates; otherwise, it is charged to the income statement as incurred.<br />
Any borrowing costs incurred on the acquisition or construction of capitalized assets that normally<br />
require time before they become available for use or for sale, are also capitalized and amortized over<br />
the useful life of the asset class concerned. All other borrowing costs are charged to the income<br />
statement for the year to which they relate.<br />
Goodwill<br />
Goodwill is an intangible asset with an indefinite life, deriving from a business combination recognized<br />
using the purchase method of accounting, and is recognised to reflect the positive difference between<br />
purchase cost and the value of the Company’s equity interest at the time of acquisition, after having<br />
recognised all assets, liabilities and identifiable contingent liabilities attributable to both the Company<br />
and third parties at their full fair value. This method of accounting applies to all acquisitions made<br />
subsequent to 31 December 2002. The value of goodwill deriving from earlier acquisitions was<br />
determined by using the amount recognised in accordance with Italian GAAP.<br />
The value of goodwill is verified with reference to the cash generating units (CGUs) that benefit<br />
from the synergies deriving from the acquisition. The expected cash flows are discounted at the<br />
cost of capital, having regard for the specific risks associated with the unit concerned. Impairment is<br />
recognized if the recoverable amount of the CGU, represented by the discounted cash flows, is less<br />
than the related carrying amount. Such impairment is deducted first from the value of goodwill.<br />
The gains and losses arising on the disposal of businesses or lines of business that were acquired with<br />
the payment of goodwill are determined having regard for the residual value of such goodwill. Any<br />
impairment losses in goodwill charged to the income statement are not reversed even if the related<br />
reasons cease to apply.<br />
132
Separate financial statements at 31 December <strong>2012</strong> – Notes<br />
Research and development expenses<br />
Expenditure on research activities undertaken to acquire new knowledge is charged to the income<br />
statement as incurred. Expenditure on development activities incurred to create new products or<br />
improve existing products, or to develop and improve production processes, are capitalized if the<br />
innovations made result in technically feasible processes and/or commercially salable products, on<br />
condition that there is an intention to complete the development project, sufficient resources are<br />
available for such completion, and the economic costs and benefits deriving from such innovations<br />
can be measured reliably. Capitalized expenditure includes both internal and external design costs<br />
(including payroll and materials used) and the portion of general manufacturing costs reasonably<br />
attributable to the projects concerned. Capitalized development expenditure is treated as an<br />
intangible asset with a finite life and is amortized over the expected period of economic benefit, which<br />
is generally taken to be 5 years. Adjustments are recognised to reflect any impairment losses arising<br />
subsequent to initial recognition.<br />
Other development expenditures are charged to the income statement in the year incurred.<br />
Other intangible assets<br />
Other intangible assets expected to generate measurable economic benefits are deemed to have<br />
a finite life and are recognised at cost. They are amortized on a straight-line basis over the period of<br />
expected economic benefit. This period is between 5 and 10 years. Adjustments are recognised to<br />
reflect any impairment losses arising subsequent to initial recognition.<br />
Equity investments<br />
Investments in subsidiaries, associates and other companies that are not classified as held for sale are<br />
stated at cost, as adjusted for any impairment, and translated to euro using the historical exchange<br />
rates in the case of investments in foreign companies whose financial statements are prepared in<br />
currencies other than the euro.<br />
The positive differences between the purchase price of equity investments and the corresponding<br />
interest in their shareholders’ equity are retained as part of the carrying amount of the investments<br />
concerned. Amounts relating to the purchase or disposal of equity investments, lines of business or<br />
businesses under joint control are recognised at their historical values, without recognizing any gains<br />
or losses.<br />
If there is evidence that equity investments may have suffered a loss in value, they are subjected to<br />
impairment testing and, if necessary, written down. Impairment is only recognized in the income<br />
statement if there is objective evidence that events have taken place which will affect the estimated<br />
future cash flows of the investments concerned. In the presence of a legal or constructive obligation<br />
to cover any losses that exceed the carrying amounts of equity investments, the related liability is<br />
recognized by recording a provision for risks and charges.<br />
The original value is reinstated in subsequent years if the reasons for such write-downs cease to apply.<br />
Dividends are recognized as financial income from investments when the right to collect them is<br />
established, which generally coincides with the shareholders’ resolution.<br />
Subsidiaries<br />
Subsidiary companies are those over which <strong>Indesit</strong> Company S.p.A. exercises control by virtue of the<br />
power to determine, directly or indirectly, their financial and operating policies and to obtain benefits<br />
133
Separate financial statements at 31 December <strong>2012</strong> – Notes<br />
from their activities. In general, companies in which <strong>Indesit</strong> Company S.p.A. holds more than 50% of the<br />
voting rights, considering any potential voting rights that may be exercised at the time, are deemed to<br />
be subsidiaries.<br />
Associates<br />
Associates are those entities over which <strong>Indesit</strong> Company S.p.A. exercises significant influence, but<br />
does not control their operations or have the power to determine their financial and operating<br />
policies or obtain benefits from their activities. In general, companies in which <strong>Indesit</strong> Company<br />
S.p.A. holds directly or indirectly between 20% and 50% of the share capital or voting rights,<br />
considering any potential voting rights that may be exercised or converted, are deemed to be<br />
associates.<br />
Trade receivables<br />
When first recognised, trade receivables are stated at the fair value of the initial consideration, as<br />
increased by the related transaction costs. Receivables normally fall due within one year and arise<br />
in the context of market interest rates that are not particularly high. Accordingly, if the receivables<br />
were generated as a result of the sales invoicing process, the invoiced amount is generally deemed<br />
to represent fair value. In the case of advances, fair value is represented by the amount of the cash<br />
movement or equivalent transaction.<br />
Subsequent to initial recognition, receivables are measured at amortized cost, being their initiallyrecognized<br />
amount, net of any payments or services received and any impairment losses. Impairment<br />
losses are estimated by determining the allowance for doubtful accounts, as described in the<br />
accounting policies adopted for the preparation of the separate financial statements.<br />
If the above criterion (nominal value) is not used at the time of initial recognition, amortized cost also<br />
takes account of the amortization accumulated using the effective interest method.<br />
If the impairment loss decreases in a later period, the loss previously recognised is partly or fully<br />
reversed and the value of the receivable is restored to an amount that does not exceed the amortized<br />
cost that would have been reported had the loss not been recognized.<br />
Trade receivables sold with or without recourse, for which all the conditions established in IAS 39<br />
for the derecognition of financial assets do not apply, continue to be reported in the statement of<br />
financial position, while receivables sold without recourse which satisfy all the conditions of IAS 39<br />
for the derecognition of financial assets are eliminated from the financial statements at the time of<br />
disposal.<br />
Other current<br />
and non-current<br />
financial assets<br />
Held-to-maturity securities are initially measured at cost, as increased by the transaction costs incurred<br />
to acquire them. Subsequently, they are measured at amortized cost using the effective interest<br />
method, net of any impairment losses.<br />
Financial assets held for trading are classified as current assets and measured at fair value, with the<br />
recognition of any gains or losses in the income statement.<br />
Securities and other financial assets classified as available for sale are stated at their fair value. Gains and<br />
losses deriving from fair-value measurement are recognized directly in equity, except for impairment<br />
losses and exchange rate losses which are charged to the income statement. The deferred gains and<br />
losses recognized in equity are released to the income statement at the time of sale.<br />
Receivables maturing beyond one year that do not earn interest or which earn interest at below market<br />
134
Separate financial statements at 31 December <strong>2012</strong> – Notes<br />
rates are discounted using market rates.<br />
The interest earned on financial assets, determined using the effective interest method, is credited to<br />
the income statement. The fair value of financial assets held for trading and those available for sale is<br />
represented by their market price at the reporting date.<br />
Inventories<br />
Cash and cash<br />
equivalents<br />
Impairment of assets<br />
Inventories are stated at the lower of cost or net realizable value. Cost is determined on a weightedaverage<br />
cost basis and includes purchasing-related expenses, inclusive of indirect charges, and<br />
the costs of converting products and bringing them to their present location and condition. Net<br />
realizable value is determined with reference to market prices after deducting completion costs and<br />
selling expenses. Obsolete and slow-moving materials and finished products are written down with<br />
reference to their life-cycles and stock rotation statistics that take account of both past and forecast<br />
consumption.<br />
Cash and cash equivalents, recognised at nominal value, comprise cash on hand, bank and postal<br />
deposits and equivalent assets that can be liquidated in the very-short term (three months) and are not<br />
subject to significant fluctuations in value.<br />
At each reporting date, the carrying amounts of the Company’s assets with an indefinite life, goodwill<br />
and intangible assets in progress are tested for impairment on the basis described in the relevant<br />
paragraphs. With the exclusion of inventories and deferred tax assets and except as discussed in<br />
relation to property, plant and equipment, other assets are tested for impairment if events suggest<br />
that they may have incurred an impairment loss. If the test shows that the recognised assets of a cashgenerating<br />
unit (CGU) have suffered a loss in value, their recoverable value is estimated and any excess<br />
carrying value is charged to the income statement. The loss in value of a CGU is allocated first against<br />
the related goodwill, if any, and then against the value of its other assets.<br />
The recoverable value of CGUs to which goodwill and intangible assets with an indefinite useful life<br />
have been allocated is verified by determining their value in use, being the value of expected cash<br />
flows discounted using a rate that reflects the specific risks of the individual CGUs at the measurement<br />
date. In applying this method, management uses many assumptions, including estimates for the<br />
changes in sales, gross profit, operating costs, the growth rate for terminal values, capital investment,<br />
the changes in operating capital and the weighted-average cost of capital (discount rate), which<br />
contribute to the preparation of a medium-term plan specifically for the purpose of carrying out<br />
impairment tests. This plan is updated annually and approved by the Board of Directors.<br />
The recoverable value of investments in securities held to maturity and receivables recognised at<br />
amortized cost is represented by the present value of future cash flows, discounted using the effective<br />
interest rate determined at the time of initial recognition. The recoverable amount of other assets is<br />
represented by the greater of their net selling price or their value in use, determined by discounting<br />
estimated future cash flows using a market rate.<br />
Losses in the value of goodwill are not reversed. Any impairment losses on securities held to maturity<br />
and receivables stated at amortized cost are reversed if any subsequent increases in their recoverable<br />
amount can be determined on an objective basis.<br />
If the impairment loss associated with an individual asset cannot be determined, the Group identifies<br />
the loss in value of the CGU to which it belongs.<br />
With reference to the Group, the value of intangible assets with an indefinite life is subjected to<br />
135
Separate financial statements at 31 December <strong>2012</strong> – Notes<br />
impairment testing at least once every year. The last two tests, performed as of 31 December <strong>2012</strong> and<br />
31 December 2011, did not identify any need to adjust the carrying amount.<br />
The recoverable value of the CGUs deemed significant for impairment testing purposes is based on<br />
their value in use, determined by applying DCF techniques over a five-year period considering the<br />
forecasts prepared by management and approved by the directors. The principal assumptions made in<br />
relation to the CGUs deemed significant for impairment testing purposes are set out in note 9.10 to the<br />
consolidated financial statements, to which reference is made.<br />
The impairment tests on the UK CGU and the Group CGU were carried out internally and approved by<br />
the directors. An independent, third-party expert has issued a report on the fairness of the valuation<br />
methods and parameters used in the impairment testing process. The impairment tests carried out<br />
are also deemed to be significant for the purpose of verifying the recoverability of the Company’s own<br />
fixed assets and equity investments.<br />
Share capital<br />
Financial liabilities<br />
Share capital, including the portion represented by savings shares, is stated at nominal value. The<br />
buy-back of treasury shares, stated at cost including related charges, is recognised as a change in<br />
shareholders’ equity; the nominal value of treasury shares is classified as a reduction of share capital,<br />
while the difference between cost and nominal value is deducted from the equity reserves. Dividends<br />
to shareholders are recognized as a liability in the year in which they are declared.<br />
Financial liabilities are initially recognized at their fair value, net of related charges, and subsequently<br />
measured at amortized cost using the effective interest method. The difference between amortized<br />
cost and repayment value is recognized in the income statement over the life of the liability in<br />
proportion to the related interest accrued. Where hedge accounting applies, the financial liabilities<br />
hedged by derivative instruments are measured on a basis consistent with the hedging instrument.<br />
If <strong>Indesit</strong> Company S.p.A. agrees to reimburse a third party on the insolvency of a specified debtor, this<br />
guarantee is initially recognised at the fair value of the consideration received and, subsequently, at<br />
the amount determined in accordance with IAS 37 or, if greater, at the amount initially recognized less<br />
the amount released on a straight-line basis to the income statement in accordance with IAS 18, where<br />
applicable.<br />
Guarantees given without charge to subsidiaries are measured at fair value and added to the carrying<br />
amount of the equity investment.<br />
Trade payables<br />
and other payables<br />
Employee benefits<br />
Trade payables and other payables due on normal commercial terms, generally within one year, are<br />
recognised at the fair value of the initial consideration, as increased by the related transaction costs.<br />
Following initial recognition, they are measured at amortized cost and any differences are reflected in<br />
the income statement over the life of the liability using the effective interest method. Trade payables<br />
and other payables, generally due within one year, are not discounted.<br />
Obligations for employee pensions and other benefits deemed to represent defined contribution<br />
plans are charged to the income statement on an accruals basis. The net liability to employees under<br />
defined benefit plans, principally represented by severance indemnities in Italy, is recognised at the<br />
expected future value of the benefits to be received by employees and accrued by them in the current<br />
and prior years. These benefits are discounted and the resulting obligation is stated net of the fair value<br />
of any pension plan assets. The net obligation is determined separately for each plan using actuarial<br />
assumptions and is calculated each year, or more frequently, with the support of an independent<br />
136
Separate financial statements at 31 December <strong>2012</strong> – Notes<br />
actuary using the projected unit credit method. The benefits are discounted using the rate for a bond<br />
with an AA rating and a maturity date that is consistent with the timing of the related payments to<br />
employees. The actuarial gains and losses arising subsequent to 1 January 2004, the IFRS transition<br />
date, are recognised in the income statement on a straight-line basis over the residual working lives<br />
of employees, to the extent that their cumulative net value exceeds by more than 10% the greater of:<br />
the total liability arising under defined benefit plans or the fair value of the assets servicing these plans<br />
(corridor method) at the end of the prior year.<br />
As a result of the reform of supplementary pensions, the TFR accrued from 1 January 2007 is treated as<br />
a defined contribution plan, while that accrued up to 31 December 2006 continues to be treated as a<br />
defined benefit plan.<br />
Stock options<br />
Provisions for risks<br />
and charges<br />
The remuneration recognized to employees and directors by the granting of stock options is charged<br />
to the income statement with a matching entry in equity. Such cost is determined with reference to<br />
the fair value of the options at the time they are granted. The cost of stock options, determined on<br />
the above basis, is charged to the income statement over the related vesting period. The fair value of<br />
the options at the grant date is determined using financial models that take account of the terms and<br />
conditions under which such options were granted.<br />
The provisions for risks and charges are recognised to cover obligations, of a legal or constructive<br />
nature (under contracts or for other reasons), deriving from past events. Provisions for risks and charges<br />
are recognized if it is probable that the related obligations will crystallize and the amounts concerned<br />
can be estimated reliably. If the settlement of such obligations is expected to take place after more<br />
than one year and the effects of this are significant, they are discounted using a rate that takes account<br />
of the cost of money and the specific risks associated with the liabilities concerned. Any changes in<br />
the estimated amount of provisions are reflected in the income statement in the year identified. In the<br />
event of discounting, the increase in the provision due to the passage of time and the effect of any<br />
changes in the discounting rate are recognised as a financial charge.<br />
The principal liabilities covered by provisions are described below.<br />
Warranties<br />
Provisions for legally-required and voluntary warranty costs are recognised at the time the related<br />
products are sold. The provision is determined with reference to the call rate for the products still<br />
under warranty cover, the period of time between the sale of the finished products to distributors and<br />
the start of the warranty period (sell in - sell out), and the average unit cost of the work performed.<br />
Restructuring work<br />
The costs of a restructuring plan are recognised at the time a constructive obligation arises, such as<br />
when the Company informs interested parties about the restructuring plan or makes sufficiently specific<br />
announcements which induce interested parties to believe that the related obligations will be met.<br />
Onerous contracts<br />
Provisions for onerous contracts are recognized when the expected benefits are lower than the related<br />
costs. They are recognised in the year in which the related losses become known and measurable.<br />
Product disposal (WEEE)<br />
The European Union adopted the WEEE (Waste Electrical and Electronic Equipment) Directive in<br />
137
Separate financial statements at 31 December <strong>2012</strong> – Notes<br />
December 2002, which makes manufacturers responsible at a European level for the recovery and<br />
disposal of waste products.<br />
At the start, the Directive established different regimes of responsibility, for products put on the market<br />
up to 13 August 2005 (old waste) and for those put on the market subsequently (new waste).<br />
For the first (old waste), manufacturers were required to incur the related disposal costs on a collective<br />
basis. Compliance with this obligation involved:<br />
• the creation of consortiums dedicated to the collection and disposal of waste products;<br />
• the reallocation of the related consortium costs in proportion to the market share of each<br />
manufacturer in the year in which such costs were incurred;<br />
• the possibility of financing disposal activities, for a transitional period of 8 years (from 2005), by<br />
uplifting the selling prices of products by a so-called visible fee.<br />
For the second (new waste), the principle of individual responsibility was applied, making each<br />
manufacturer responsible for the cost of disposing of the products that it put on the market.<br />
On implementing the WEEE Directive, the regulations governing the treatment of new waste in<br />
numerous EU countries maintained the principle of individual responsibility established in the<br />
Directive, but allowed compliance via a system of collective disposal using a mechanism that is<br />
essentially consistent with that applied for the disposal of old waste. Accordingly, manufacturers have<br />
been allowed to delegate the collection and disposal of new waste to consortiums, that allocate<br />
their costs using criteria in line with those mentioned above in relation to old waste. Italian legislation<br />
imposes individual responsibility for the collection and disposal of new waste, allowing manufacturers<br />
to comply with their obligations by registering with a collective system.<br />
The Company has taken advantage of this opportunity by electing to manage its collection and<br />
disposal activities via the collective system operated by the ECODOM consortium.<br />
Other provisions<br />
Provisions are recognised for other future charges deriving from court cases, disputes and other<br />
obligations when the requirements for the recognition of a liability are met, being in the accounting<br />
period in which such charges become known and measurable reliably.<br />
Income<br />
Revenue<br />
Revenue from the sale of goods is recognized when the significant risks and rewards of ownership<br />
are transferred to the buyer. Revenue from the sale of goods is generally recognized when they are<br />
handed over to the transport firms which, under the terms of current contracts, marks the time when<br />
the above risks and rewards are transferred. Revenue is not recognized if its recoverability is considered<br />
to be uncertain.<br />
Revenue is stated net of discounts, allowances, rebates, returns and expenses incurred on promotional<br />
actions that, in substance, represent commercial discounts. This caption does not include proceeds<br />
from the disposal of raw materials and scrap. Revenue from services is recognised in the income<br />
statement based on their stage of completion at the reporting date, determined with reference to the<br />
work performed or, alternatively, to the percentage of completion with respect to the total.<br />
Dividends<br />
Collectible dividends are recognized as revenue when they are declared at the related shareholders’<br />
meeting.<br />
138
Separate financial statements at 31 December <strong>2012</strong> – Notes<br />
Grants<br />
Grants from the Government or other bodies, recognized in the form of direct payments or tax<br />
benefits, are recognized as deferred income in the statement of financial position, among other<br />
liabilities, at the time their collection become reasonably certain and when compliance with all the<br />
requirements to obtain them is assured. They are recognized as revenue in the income statement on a<br />
systematic basis in order to match the accounting recognition of the costs for which such grants were<br />
made (capital grants).<br />
Operating grants are taken to the income statement at the time the requirements for their recognition<br />
are met, and when it becomes certain that they will be recognized in order to offset the eligible costs.<br />
Other revenues and income<br />
Other income includes all forms of non-financial revenue not covered above and is recognized on<br />
the basis described in relation to revenue from goods sold and services rendered. This includes<br />
the capitalization of internally-incurred development costs, where appropriate, and any internal<br />
construction costs.<br />
Expenses<br />
The costs of purchasing goods and services are recognized when the amounts concerned can<br />
be determined reliably. The costs of purchasing goods are recognized on delivery which, under<br />
the terms of current contracts, marks the time when the related risks and rewards are transferred.<br />
The costs of services are recognized on an accruals basis with reference to the time they are<br />
received.<br />
Materials, services, leases and rentals<br />
This caption comprises the cost of purchasing raw materials, components, outsourced direct and<br />
indirect processing, and production, commercial, distribution and administrative services.<br />
Payroll costs<br />
Payroll costs comprise remuneration, social security charges, charges in relation to defined benefit and/<br />
or defined contribution plans - principally represented by the provision for severance indemnities -<br />
benefits, and the cost of leaving and redundancy incentives.<br />
Depreciation and impairment<br />
This caption comprises the charges for the depreciation and amortization of property, plant and<br />
equipment and intangible assets over their useful lives, and the related impairment write-downs<br />
determined on the basis described in the Impairment of assets paragraph.<br />
Provisions and other operating expenses<br />
This caption comprises the provisions for specific risks and doubtful accounts, as well as such<br />
other expenses as indirect taxation, general expenses, losses of the disposal of property, plant and<br />
equipment and donations.<br />
Financial income<br />
and expenses<br />
Financial income<br />
Financial income includes the interest income earned on all forms of loan, cash discounts allowed by<br />
suppliers for early payment with respect to the agreed terms of purchasing, financial income from cash<br />
and cash equivalents, exchange gains and the economic effects recognised in the income statement<br />
of measuring the transactions that hedge interest-rate and exchange-rate risks.<br />
139
Separate financial statements at 31 December <strong>2012</strong> – Notes<br />
Financial expenses<br />
Financial expenses include the interest charged on all forms of borrowing, cash discounts allowed<br />
to customers for early payment with respect to the agreed terms of sale, exchange losses and the<br />
economic effects recognised in the income statement of measuring the transactions that hedge<br />
interest-rate and exchange-rate risks.<br />
Income tax<br />
Income tax is recognized in the income statement, except for that relating to transactions recognized<br />
directly in equity, in which case it is also recognized in equity. Income tax includes current taxes and<br />
the changes in deferred tax assets and liabilities. Current taxes are based on an estimate of the amount<br />
that <strong>Indesit</strong> Company S.p.A. expects will be paid, determined by applying the tax rate in force on the<br />
accounting reference date.<br />
Deferred tax is provided using the liability method, considering all the temporary differences that<br />
emerge between the tax value of assets and liabilities and their carrying amounts in the Company’s<br />
separate financial statements. Deferred tax assets and liabilities are not recognized in respect of<br />
goodwill or those assets and liabilities that do not affect taxable income.<br />
Income taxes deriving from the distribution of dividends are recognized at the time the related payable<br />
is recognized. The recoverability of deferred tax assets is verified at each reporting date and any<br />
amounts for which recovery is no longer likely are charged to the income statement.<br />
Deferred taxation is recognized using the tax rates expected to be in force in the tax periods when the<br />
related temporary differences are forecast to reverse or expire.<br />
Deferred tax assets are recognized to the extent it is probable that sufficient future taxable income will<br />
be available to recover them. Current and deferred tax assets and liabilities are offset when due to the<br />
same tax authority, if the periods of reversal are the same and a legal right of offset exists.<br />
Deferred taxation is recognised in relation to the distributable retained earnings of subsidiaries if there<br />
is an intention to distribute such profits.<br />
Deferred tax liabilities are recognized on the distributable profits of subsidiaries if the Parent intends to<br />
distribute such profits in the foreseeable future.<br />
Non-current assets<br />
held for sale<br />
and discontinued<br />
operations<br />
Earnings per share<br />
Assets held for sale are measured at the lower of their carrying value at the time their sale was<br />
decided or their fair value, net of estimated selling costs. All costs, income and write-downs, if any, are<br />
recognised in the income statement and reported separately.<br />
Operating activities that represent a separate major line of business or geographical area of operations<br />
are classified separately in the income statement and the statement of financial position at the time of<br />
disposal, or when they meet the conditions for classification as assets held for sale.<br />
Earnings per share is calculated and presented at Group level. See note 9.11 to the consolidated<br />
financial statements.<br />
140
Separate financial statements at 31 December <strong>2012</strong> – Notes<br />
5.2 Amendments<br />
and revised<br />
accounting<br />
standards applied<br />
for the first time<br />
by the Company<br />
5.3 Amendments<br />
and revised<br />
accounting<br />
standards<br />
effective from<br />
1 January 2013<br />
onwards<br />
Revised accounting standards and amendments are the following<br />
IAS 12 - Income taxes<br />
The amendment introduced a presumption that deferred tax on investment property measured at fair<br />
value in accordance with IAS 40 should be determined taking into account that the carrying amount<br />
will be recovered through sale. A consequence of this amendment, SIC 21 - Income taxes - Recovery of<br />
revalued non-depreciable asset, will no longer apply. The amendment must be applied retrospectively<br />
from 1 January <strong>2012</strong>. It should be noted that this case is not regulated by the amendment in the<br />
Company.<br />
IAS 1 - Presentation of Financial Statements<br />
The amendments to IAS 1 are intended to clarify the presentation of those captions representing<br />
other components of comprehensive income. This will help users of the accounts to distinguish<br />
between the individual captions that subsequently may, or may not, be reclassified to the income<br />
statement.<br />
The standard, which will be applied from 1 January 2013, will have no effect on the results of the<br />
Company or on shareholders’ equity.<br />
IAS 19 - Employee Benefits<br />
The amended standard requires the Company to determine the present value of its defined benefit<br />
obligations and the fair value of plan assets, and to recognize in the statement of financial position the<br />
net liability for defined benefits.<br />
The amended standard eliminates the opportunity to apply the corridor method.<br />
The standard also requires the discount rate on net payables to be applied to defined benefits (assets),<br />
in order to calculate the net interest expense (income). In this way, the standard eliminates the use of<br />
an expected yield on plan assets.<br />
The changes to the net liability for defined benefits (assets) will be recognized as follows:<br />
• the service cost and net interest in the income statement, and<br />
• subsequent measurement in the statement of comprehensive income.<br />
The standard will have the following impact on the presentation of financial results and equity of<br />
the Company: all gains and losses are included in the measurement of historical net defined benefit<br />
liabilities. This will increase the liabilities of <strong>Indesit</strong> and reduce shareholders’ equity (net of deferred tax).<br />
Future changes in net liabilities from defined benefit changes, for example, the discount rate and the<br />
mortality rate will be presented in other comprehensive income.<br />
The impact of the amendments to the standard will provide for a decrease (net of tax of latent<br />
approximately 1.5 million euro) in net assets for approximately 4.0 million euro and an increase in<br />
liabilities for employee benefits for approximately 5.5 million euro.<br />
IFRS 7 - Financial Instruments: Disclosures<br />
The amendment requires information on the effects or potential effects of the rights to offsetting<br />
financial assets and financial liabilities on the balance sheet. This amendment shall be applied for<br />
financial years beginning on or after 1 January 2013 and interim periods subsequent to that date. The<br />
information must be provided retrospectively. It is believed that the adoption of this standard did not<br />
have a material impact on the financial statements of the Company.<br />
141
Separate financial statements at 31 December <strong>2012</strong> – Notes<br />
IFRS 10 - Consolidated financial statements<br />
This standard identifies control as the basis for consolidation in all types of company. It replaces<br />
IAS 27 - Consolidated and separate financial statements and SIC 12 - Consolidation - Special purpose<br />
entities.<br />
IFRS 11 - Joint Arrangements<br />
Establishes the disclosures required by parties to joint arrangements.<br />
This standard replaces IAS 31 - Interests in Joint Ventures and SIC 13 - Jointly Controlled Entities -<br />
Non-monetary Contributions by Venturers.<br />
The revised versions of IFRS 10 and IFRS 11, despite not having immediate impact on the financial<br />
result and equity of the Company, could affect the logic for the purpose of consolidation.<br />
They will be in force from January 2014 in the European Union.<br />
IFRS 13 - Fair Value Measurement<br />
The principle clarifies how to determine fair value for accounting purposes and applies to all IFRS that<br />
require or permit fair value measurements or the presentation of information based on fair value. The<br />
principle is to be applied prospectively from 1 January 2013. It is believed that the adoption of this<br />
standard did not have a material impact on the financial statements of the Company.<br />
IFRS 9 - Financial Instruments<br />
This standard relates to the classification and measurement of financial instruments. The Company will<br />
evaluate the effect of its application on the accounting presentation of financial assets and liabilities.<br />
The IASB has recently modified IFRS 9 and deferred its obligatory effective date to 1 January 2015,<br />
although early adoption is allowed.<br />
142
Separate financial statements at 31 December <strong>2012</strong> – Notes<br />
6. Notes to the separate income statement<br />
6.1 Revenue from<br />
sales and services<br />
Revenue from the sale of goods and the provision of services is analyzed as follows:<br />
(million euro) <strong>2012</strong> 2011<br />
Revenue from sale of finished products and spare parts 996.8 1,087.2<br />
Revenue from provision of services 20.8 20.9<br />
Total 1,017.5 1,108.1<br />
of which: - -<br />
- intercompany 582.2 620.8<br />
- third parties 435.4 487.3<br />
Revenue from Italian customers was 367.6 million euro (420.7 million euro), while revenue from foreign<br />
customers was 650.0 million euro (687.5 million euro), of which 582.2 million euro (620.8 million euro)<br />
was from subsidiaries.<br />
Revenue from sales to subsidiaries is analyzed as follows:<br />
(million euro) <strong>2012</strong> 2011<br />
Sales revenue from subsidiaries<br />
<strong>Indesit</strong> Company International Business S.A. 80.2 82.7<br />
<strong>Indesit</strong> Company Deutschland GmbH 5.3 10.1<br />
<strong>Indesit</strong> Electrodomesticos S.A. 13.6 15.3<br />
<strong>Indesit</strong> Company France S.A. 109.2 125.9<br />
<strong>Indesit</strong> Company UK Ltd. 154.6 170.5<br />
<strong>Indesit</strong> Company Magyarország Kft 14.0 11.4<br />
<strong>Indesit</strong> Company International BV 19.0 23.2<br />
<strong>Indesit</strong> Company Polska Sp.zo.o. 45.3 45.6<br />
<strong>Indesit</strong> Company Portugal Electrodomésticos S.A. 9.3 12.4<br />
<strong>Indesit</strong> Company Beyaz Esya Sanayi ve Ticaret A.S. 26.0 27.9<br />
<strong>Indesit</strong> Argentina S.A. 0.9 2.1<br />
<strong>Indesit</strong> Osterreich GmbH 19.6 19.5<br />
<strong>Indesit</strong> Company Rus Ltd. 84.3 74.2<br />
<strong>Indesit</strong> Ukraine LLC 0.7 -<br />
Total subsidiaries 582.2 620.8<br />
As in prior years, the Group’s transfer prices were determined using the cost-plus method, which<br />
envisages the application of an uplift with respect to production cost. The fairness of such transfer<br />
prices was checked by applying the Transactional Net Margin Method (TNMM), as required by the<br />
regulations, normal practice in Italy and the OECD Guidelines (or Directives).<br />
Invoicing to Group companies is denominated in euro.<br />
The volume of Group sales to third parties of household appliances produced in Italian factories fell<br />
by 12.9% in <strong>2012</strong>. The weighting of production at Italian locations with respect to the total sales of<br />
finished products fell from 35.1% in 2011 to 30.0% in <strong>2012</strong>.<br />
143
Separate financial statements at 31 December <strong>2012</strong> – Notes<br />
This reduction was mainly due to lower market demand, not least in Italy where industry shipments<br />
dropped by 9.3% with respect to 2011.<br />
Revenue from the provision of services relates to services provided to customers (transport) and to<br />
end consumers (after-sales maintenance), and to the sale of extended warranties beyond the legal<br />
minimum period.<br />
6.2 Change in work<br />
in progress,<br />
semi-finished and<br />
finished products<br />
The change in inventories of semi-finished and finished products and spare parts is summarized below:<br />
(million euro) <strong>2012</strong> 2011<br />
Semi-finished products 0.2 0.1<br />
Finished products and spare parts (12.8) 0.7<br />
Total (12.6) 0.8<br />
The change in inventories of raw materials, semi-finished and finished products, and spare parts is<br />
reported net of the change in the provision for obsolescence, which has decreased by 1.8 million<br />
euro (decreased by 2.1 million euro). The higher costs reflect the reduction in inventories and the<br />
impairment of residual stocks of products that do not comply with the new energy labeling directives<br />
(see the <strong>Report</strong> on operations for further information).<br />
6.3 Other revenue<br />
and income<br />
Other revenues and income are analyzed as follows:<br />
(million euro) <strong>2012</strong> 2011<br />
Increase in intangible assets for internal work 15.0 15.8<br />
Insurance reimbursement 1.0 0.1<br />
Recharge of services and royalties 27.1 24.4<br />
Capital gains 0.0 0.1<br />
Operating grants 2.0 4.1<br />
Capital grants 0.9 1.1<br />
Steel grants for export 0.7 0.7<br />
Other income 4.3 5.1<br />
Revenues from cost sharing 49.9 39.7<br />
Total 100.9 91.1<br />
The increase in intangible assets by internal work principally relates to the capitalization of<br />
development costs.<br />
The Operating grants caption reflects grants received from European organizations and other entities 4 .<br />
The recharge of services and royalties relates to the reallocation of the cost of IT, commercial and<br />
logistical services incurred by the Company on behalf of Group companies (cost sharing), as well as<br />
to income deriving from the concession of rights to use the brands and its technological know-how<br />
(royalties).<br />
144
Separate financial statements at 31 December <strong>2012</strong> – Notes<br />
The Recharge of services, cost sharing and royalties caption is analyzed by company in the following<br />
table.<br />
(million euro) <strong>2012</strong> 2011<br />
Recharge of services and royalties to subsidiaries<br />
<strong>Indesit</strong> Company Portugal Electrodomésticos S.A. 0.7 0.7<br />
<strong>Indesit</strong> Electrodomesticos S.A. 1.0 0.9<br />
<strong>Indesit</strong> Company France S.A. 5.3 5.4<br />
<strong>Indesit</strong> Company Deutschland GmbH 0.4 0.4<br />
<strong>Indesit</strong> Company International B.V. 0.5 0.5<br />
<strong>Indesit</strong> Company Polska Sp.zo.o. 27.9 20.6<br />
<strong>Indesit</strong> Company International Business S.A. 2.8 2.6<br />
<strong>Indesit</strong> Company Beyaz Esya Sanayi ve Ticaret A.S. 11.9 9.9<br />
<strong>Indesit</strong> Company Magyarország Kft 1.3 1.2<br />
<strong>Indesit</strong> Company UK Ltd. 14.4 12.4<br />
Closed Joint Stock Company <strong>Indesit</strong> International 10.6 9.4<br />
<strong>Indesit</strong> Ukraine LLC 0.2 0.2<br />
Total subsidiaries 77,0 64,1<br />
The increase with respect to the prior year primarily reflects recharges made to <strong>Indesit</strong> Company Polska<br />
Sp.zo.o., 7.2 million euro, and to <strong>Indesit</strong> Company Beyez Esyaz Sanayi ve Ticaret A.S., 2.0 million euro. This<br />
effect is attributable to the divisional structure adopted by the Group, which has resulted in a different<br />
allocation of charges, compared with 2011, to manufacturing locations that are undergoing expansion.<br />
6.4 Purchase<br />
of raw materials,<br />
services, leases<br />
and rentals<br />
This caption comprises:<br />
(million euro) <strong>2012</strong> 2011<br />
Purchase of raw materials, components and goods (708.4) (775.7)<br />
Maintanance (10.3) (9.5)<br />
Distribution expenses (63.2) (67.6)<br />
Advertising (24.2) (31.3)<br />
Technical assistance (7.4) (7.4)<br />
Services (18.7) (21.4)<br />
Statutory auditors fees (0.2) (0.2)<br />
Utilities (9.7) (9.9)<br />
Use of third parties (11.2) (8.7)<br />
Insurance (3.8) (2.3)<br />
Other expenses (30.8) (37.5)<br />
Revenue from the sale of raw materials 36.1 38.9<br />
Revenue from the recharge of expenses 13.4 11.2<br />
Total (838.4) (921.3)<br />
This caption includes the cost of purchasing finished products and, to a lesser extent, raw materials and<br />
services from subsidiaries.<br />
The reduction in sourcing costs is principally attributable to the decline in the volume of production<br />
145
Separate financial statements at 31 December <strong>2012</strong> – Notes<br />
and sales. In addition, the reduction in volumes transported has resulted in lower distribution costs,<br />
down by 4.4 million euro. Further savings, about 7.1 million euro, were made in relation to advertising<br />
and promotion costs.<br />
Other costs decreased after the containment of costs related to travel expenses, expenses for<br />
outsourcing and types of residual cost to the companies of the Group.<br />
The costs of purchasing finished products, raw materials and services from subsidiaries are analyzed as<br />
follows:<br />
(million euro) <strong>2012</strong> 2011<br />
Purchase of finished products, raw materials and services to subsidiaries<br />
<strong>Indesit</strong> Company International Business S.A. (0.7) (0.8)<br />
<strong>Indesit</strong> Company Deutschland GmbH (0.3) (0.8)<br />
<strong>Indesit</strong> Electrodomesticos S.A. (0.1) (0.2)<br />
<strong>Indesit</strong> Company France S.A. (0.5) (1.4)<br />
<strong>Indesit</strong> Company UK Ltd. (15.2) (22.7)<br />
<strong>Indesit</strong> Company International B.V. (0.1) (0.1)<br />
<strong>Indesit</strong> Company International B.V. - rep. office - (0.0)<br />
<strong>Indesit</strong> Company Polska Sp.zo.o. (113.4) (101.5)<br />
<strong>Indesit</strong> Company Portugal Electrodomésticos S.A. (0.7) (0.9)<br />
<strong>Indesit</strong> Company Beyaz Esya Pazarlama A.S. (36.0) (28.3)<br />
<strong>Indesit</strong> Company Beyaz Esya Sanayi ve Ticaret A.S. (0.8) (0.7)<br />
<strong>Indesit</strong> Osterreich GmbH (2.1) (1.6)<br />
<strong>Indesit</strong> Company IP S.r.l. (0.0) (0.1)<br />
Aeradriatica S.p.A. (2.2) (2.3)<br />
<strong>Indesit</strong> Company Rus Ltd. (0.2) (0.3)<br />
Closed Joint Stock Company <strong>Indesit</strong> International (0.2) (0.2)<br />
Wuxi <strong>Indesit</strong> Domestic Appliance Technology Co. Ltd. (1.3) (1.1)<br />
<strong>Indesit</strong> Company Bulgaria Ltd. (1.2) (1.2)<br />
<strong>Indesit</strong> Company Appliances Hellas Mepe (1.7) (1.9)<br />
<strong>Indesit</strong> Company Norge Ltd. (0.8) (2.1)<br />
<strong>Indesit</strong> Company Nordics A.B. (0.4) -<br />
Total subsidiaries (178.0) (168.3)<br />
Raw materials and the recovery of costs, part of the Materials, services, leases and rentals caption,<br />
include the recharges made to subsidiaries.<br />
146
Separate financial statements at 31 December <strong>2012</strong> – Notes<br />
The sales of raw materials to Group companies are analyzed in the following table.<br />
(million euro) <strong>2012</strong> 2011<br />
Revenue from the sale of raw materials to subsidiaries<br />
<strong>Indesit</strong> Company UK Ltd. 0.0 0.0<br />
<strong>Indesit</strong> Company Polska Sp.zo.o. 4.7 3.7<br />
<strong>Indesit</strong> Company Beyaz Esya Sanayi ve Ticaret A.S. 0.1 0.1<br />
<strong>Indesit</strong> Company Rus Ltd 0.0 0.0<br />
Closed Joint Stock Company <strong>Indesit</strong> International 0.5 0.2<br />
Total subsidiaries 5.3 4.0<br />
The Revenue from the recharge of expenses caption relates to amounts, other than cost sharing and<br />
royalties, recharged to Group companies and to the Parent.<br />
These are analyzed by subsidiary and Parent in the following table:<br />
(million euro) <strong>2012</strong> 2011<br />
Revenue from the recharge of expenses to subsidiaries - -<br />
<strong>Indesit</strong> Company Belgium S.A. 0.0 -<br />
<strong>Indesit</strong> Company International Business S.A. 0.6 0.6<br />
<strong>Indesit</strong> Company Ceská S.r.o. 0.1 0.0<br />
<strong>Indesit</strong> Company Deutschland GmbH 0.1 0.1<br />
<strong>Indesit</strong> Electrodomesticos S.A. 0.4 0.4<br />
<strong>Indesit</strong> Company France S.A. 2.3 1.1<br />
<strong>Indesit</strong> Company UK Ltd. 1.0 1.4<br />
<strong>Indesit</strong> Company Magyarország Kft 1.6 1.8<br />
<strong>Indesit</strong> Company Luxembourg S.A. 0.0 -<br />
<strong>Indesit</strong> Company International B.V. 0.2 0.2<br />
<strong>Indesit</strong> Company International B.V. - rep. office - 0.0<br />
<strong>Indesit</strong> Company Polska Sp.zo.o. 1.4 0.7<br />
<strong>Indesit</strong> Company Portugal Electrodomésticos S.A. 0.2 0.3<br />
<strong>Indesit</strong> Company Beyaz Esya Pazarlama A.S. 0.4 0.3<br />
<strong>Indesit</strong> Company Beyaz Esya Sanayi ve Ticaret A.S. 0.2 0.1<br />
<strong>Indesit</strong> Osterreich GmbH 0.1 0.0<br />
<strong>Indesit</strong> Company IP S.r.l. 0.0 0.0<br />
Aeradriatica S.p.A. 0.1 0.1<br />
<strong>Indesit</strong> Company Rus Ltd. 2.7 2.3<br />
Closed Joint Stock Company <strong>Indesit</strong> International 1.7 1.6<br />
<strong>Indesit</strong> Ukraine LLC 0.1 -<br />
<strong>Indesit</strong> Company Nordics A.B. 0.0 -<br />
Total subsidiaries 13.4 11.1<br />
Parent<br />
Revenues from Fineldo 0.0 0.0<br />
Total parent 0.0 0.0<br />
Total subsidiaries and parent 13.4 11.2<br />
147
Separate financial statements at 31 December <strong>2012</strong> – Notes<br />
The increase in this caption by 2.2 million euro mainly relates to the recharges made to <strong>Indesit</strong><br />
Company France S.A.<br />
6.5 Payroll costs<br />
Payroll costs are analyzed as follows:<br />
(million euro) <strong>2012</strong> 2011<br />
Wages and salaries (148.4) (149.8)<br />
Social security and pension contributions (44.6) (45.3)<br />
Post-employment benefits TFR (10.1) (10.5)<br />
Other expenses (3.6) (7.1)<br />
Total (206.7) (212.7)<br />
The decrease in payroll costs reflects the cost control measures implemented during the year, which<br />
resulted in a reduction in employment and a decrease in the variable element of remuneration.<br />
The Social security and pension contributions caption principally comprises payroll contributions<br />
amounting to 44.6 million euro (45.3 million euro).<br />
The Other expenses caption comprises employee insurance, 1.3 million euro (1.3 million euro),<br />
temporary workers, 1.8 million euro (4.7 million euro), accident and illness costs, 1.0 million euro (1.0<br />
million euro), other payroll costs, 2.3 million euro (2.6 million euro) and amounts recharged to Group<br />
companies, 2.8 million euro (2.5 million euro).<br />
Employees are analyzed by category below:<br />
Employees 31.12.<strong>2012</strong> Employees 31.12.2011<br />
Monthly<br />
Qualification<br />
Permanent Temporary Permanent Temporary average <strong>2012</strong><br />
Executives 116 0 115 0 116<br />
Managerial staff 304 0 274 0 301<br />
Clerical staff 991 47 979 70 1,017<br />
Factory workers 3,032 1 3,177 3 3,104<br />
Total 4,443 48 4,545 73 4,538<br />
6.6 Depreciation,<br />
amortisation<br />
and impairment<br />
losses<br />
(million euro) Year <strong>2012</strong> Year 2011<br />
Depreciation of property, plant and equipment (35.1) (33.6)<br />
Depreciation, amortisation of intangible assets (23.9) (25.6)<br />
Total (59.0) (59.3)<br />
6.7 Change in raw<br />
materials,<br />
components<br />
and consumables<br />
The change in inventories of raw materials is reported net of the change in the provision for<br />
obsolescence. The net provision for the year was 0.2 million euro (net utilizations of 0.5 million euro).<br />
148
Separate financial statements at 31 December <strong>2012</strong> – Notes<br />
6.8 Provisions and<br />
other operating<br />
expenses<br />
Provisions and other operating expenses are analyzed in the following table.<br />
(million euro) <strong>2012</strong> 2011<br />
Provision for doubtful accounts (1.8) (2.7)<br />
Liberal disbursement (0.5) (0.6)<br />
IMU (local property tax) (1.0) (0.7)<br />
Associative contribution (0.9) (1.0)<br />
Expenses for licences and brands (4.4) (4.9)<br />
Provisions and other operating expenses (19.5) (0.4)<br />
Total (28.2) (10.4)<br />
The cost of licences, trademarks and patents comprises the related filing expenses, as well as the cost<br />
of purchasing materials and carrying out studies and tests as part of research projects.<br />
The caption accruals and other operating income/expenses includes accruals to and utilizations of the<br />
provisions for risks, as well as all residual income and expenses.<br />
The increase was mainly due to risk provisions for restructuring (about 10 million euro), redundancies<br />
(approximately 4.0 million euro) and litigation and other operating expenses (around 5.0 million euro).<br />
6.9 Operating<br />
profit and<br />
non-recurring<br />
items<br />
As required by Consob Communication DEM/6064293 dated 28 July 2006, significant non-operating<br />
income and expenses are detailed in the following table.<br />
(million euro) <strong>2012</strong> 2011<br />
Redundancies charges (4.7) (0.9)<br />
Restructuring charges (11.3) (2.7)<br />
Benefits for earthquake grants Law no. 103/2008 - -<br />
Environmental clean-up (2.2) 0.5<br />
Other non-recurring income (expenses) 2.4 (0.2)<br />
Total (15.9) (3.4)<br />
The increase in net non-recurring charges was mainly due to the higher restructuring cost and<br />
redundancy incentives relating to the closure of the None factory.<br />
These increases were partially offset by the release of the residual provision for environmental clean up.<br />
149
Separate financial statements at 31 December <strong>2012</strong> – Notes<br />
The non-recurring items included in the various income statement captions are detailed below:<br />
(million euro)<br />
Balances<br />
Redundancies<br />
Restructuring<br />
charges<br />
<strong>2012</strong><br />
Benefits for<br />
earthquake<br />
grants Law<br />
no. 103/2008<br />
Other<br />
non-recurring<br />
income<br />
(expenses)<br />
Environmental<br />
clean up<br />
Total<br />
non-recurring<br />
items<br />
Revenue from sales and services 1,017.5 - - - - - -<br />
Change in work in progress, semi-finished<br />
and finished products (12.6) - - - (1.9) - (1.9)<br />
Other income and expenses 100.9 - - - - - -<br />
Purchase of raw materials, services and costs<br />
for utilization of third party assets (838.4) - (0.4) - (0.2) - (0.5)<br />
Payroll costs (206.7) - (0.5) - (0.2) - (0.7)<br />
Depreciation, amortization and impairment losses (59.0) - (0.5) - - - (0.5)<br />
Change in raw materials, auxiliary<br />
and components (4.7) - - - - - -<br />
Provisions and other operating charges (28.2) (4.7) (10.0) - (0.0) 2.4 (12.4)<br />
Operating profit (31.2) (4.7) (11.3) - (2.2) 2.4 (15.9)<br />
Isolating the effect of recognizing non-recurring items, the operating profit from continuing activities is<br />
indicated below:<br />
(million euro) <strong>2012</strong> 2011<br />
Revenue 1,017.5 1,108.1<br />
Operating profit (loss) (31.2) (3.5)<br />
Operating margin % -3.1% -0.3%<br />
Non-recurring items (15.9) (3.4)<br />
Operating profit of recurring activities (15.3) (0.2)<br />
Operating margin of recurring activities % -1.5% 0.0%<br />
The operating loss (EBIT) was negative for 31.2 million euro (negative for 3.5 million euro), representing<br />
-3.1% of revenue (-0.3%).<br />
Net non-recurring charges amounted to 15.9 million euro (3.4 million euro).<br />
Before non-recurring items, the operating loss was 15.3 million euro (0.2 million euro).<br />
The change in operating loss is analyzed in the <strong>Report</strong> on operations.<br />
Attachment 2 (Income statement for the year ended 31 December <strong>2012</strong>, prepared pursuant to Consob<br />
Decision 15519 dated 27 July 2006 and Consob Communication DEM/6064293 dated 28 July 2006) to<br />
these notes summarizes the overall effect of non-recurring charges on the income statement.<br />
Non-recurring items have an immediate cash flow effect, except for redundancy and restructuring<br />
costs whose cash flow effect is spread over a number of years consistent with the release of the related<br />
provisions in accordance with the matching principle and accruals basis of accounting.<br />
150
Separate financial statements at 31 December <strong>2012</strong> – Notes<br />
6.10 Dividends from<br />
subsidiaries,<br />
associates and<br />
others<br />
The dividends collected by the Company are detailed in the following table:<br />
(million euro) <strong>2012</strong> 2011<br />
Subsidiaries, associates and others<br />
<strong>Indesit</strong> Company Ceská S.r.o. - 0.7<br />
<strong>Indesit</strong> Company UK Holdings Ltd. 19.3 -<br />
<strong>Indesit</strong> Company Luxembourg S.A. - 20.0<br />
<strong>Indesit</strong> Argentina S.A. - 0.1<br />
<strong>Indesit</strong> Company Rus Ltd. 63.0 30.2<br />
Closed Joint Stock Company <strong>Indesit</strong> International 26.9 -<br />
Total subsidiaries, associates and others 109.2 51.0<br />
6.11 Interest<br />
income from<br />
subsidiaries<br />
The other financial income deriving from subsidiaries is detailed in the following table.<br />
(million euro) <strong>2012</strong> 2011<br />
Subsidiaries<br />
<strong>Indesit</strong> Company International Business S.a. 0.1 0.6<br />
<strong>Indesit</strong> Company Deutschland GmbH 0.0 0.0<br />
<strong>Indesit</strong> Electrodomesticos S.a. - 0.0<br />
<strong>Indesit</strong> Company France S.a. 0.1 1.0<br />
<strong>Indesit</strong> Company UK Ltd. 0.1 0.1<br />
General Domestic Appliances Holdings Ltd. 0.1 0.1<br />
<strong>Indesit</strong> Company Magyarország Kft 0.0 0.0<br />
<strong>Indesit</strong> Company Luxembourg S.a. 0.1 0.1<br />
<strong>Indesit</strong> Company International B.V. - 0.0<br />
<strong>Indesit</strong> Company Polska Sp.zo.o. 0.3 0.2<br />
<strong>Indesit</strong> Company Portugal Electrodomésticos S.a. - 0.0<br />
<strong>Indesit</strong> Company Beyaz Esya Pazarlama A.S. 0.0 0.0<br />
<strong>Indesit</strong> Company Beyaz Esya Sanayi ve Ticaret A.S. 1.0 0.7<br />
<strong>Indesit</strong> Ukraine LLC 0.0 0.0<br />
<strong>Indesit</strong> Company Nordics A.B. 0.0 -<br />
Total subsidiaries 1.9 2.8<br />
6.12 Interest income<br />
from third<br />
parties<br />
There was no financial income from third parties in <strong>2012</strong> or 2011.<br />
151
Separate financial statements at 31 December <strong>2012</strong> – Notes<br />
6.13 Interest<br />
expenses from<br />
subsidiaries<br />
and associates<br />
The financial expenses from subsidiaries and associates are detailed in the following table.<br />
(million euro) <strong>2012</strong> 2011<br />
Subsidiaries and associates<br />
<strong>Indesit</strong> Company International Business S.A. (4.2) (1.9)<br />
<strong>Indesit</strong> Electrodomesticos S.A. (0.0) (0.0)<br />
<strong>Indesit</strong> Company France S.A. (0.1) -<br />
<strong>Indesit</strong> Company UK Ltd. (0.1) (0.1)<br />
<strong>Indesit</strong> Company Magyarország Kft - (0.0)<br />
<strong>Indesit</strong> Company Luxembourg S.A. (5.7) (6.5)<br />
<strong>Indesit</strong> Company International B.V. (0.0) -<br />
<strong>Indesit</strong> Company Portugal Electrodomésticos S.A. (0.0) (0.0)<br />
<strong>Indesit</strong> Company Beyaz Esya Pazarlama A.S. (0.0) (0.1)<br />
<strong>Indesit</strong> Company Beyaz Esya Sanayi ve Ticaret A.S. (0.0) (0.0)<br />
Total subsidiaries and associates (10.1) (8.6)<br />
Financial expenses from <strong>Indesit</strong> Company International Business S.A. have increased, principally due to<br />
the effect of the interest-rate swap that hedges short-term borrowing.<br />
6.14 Interest<br />
expenses from<br />
third parties<br />
and the Parent<br />
The interest expense incurred in relation to the various sources of finance is analyzed in the following<br />
table.<br />
(million euro) <strong>2012</strong> 2011<br />
Interest on medium/long-term bank loans and borrowings (1.7) (0.9)<br />
Interest on short-term borrowing (5.1) (2.9)<br />
Other interest and expenses (8.2) (9.4)<br />
Total (15.0) (13.2)<br />
Interest on short-term borrowing includes charges relating to hot money amounting to 5.1 million<br />
euro (2.9 million euro).<br />
Other interest and expenses include expenses relating to the securitization program, 1.7 million euro<br />
(3.5 million euro); financial expenses associated with the discounting of post-employment benefits,<br />
1.7 million euro (1.8 million euro) and the effect of discounting other non-current provisions, 1.1 million<br />
euro (1.3 million euro); other interest and commission charges, 3.0 million euro (1.7 million euro);<br />
charges from use of the revolving line of credit, 0.2 million euro (0.5 million euro); and current account<br />
interest expense, 0.5 million euro (0.6 million euro).<br />
6.15 Exchange rate<br />
differences<br />
The following table analyzes exchange/rate fluctuations, identifying both realized and unrealized gains<br />
and losses.<br />
(million euro) <strong>2012</strong> 2011<br />
Realized exchange rate fluctuations, net (0.1) (0.3)<br />
Unrealized exchange rate fluctuations, net 0.1 (0.0)<br />
Total 0.1 (0.4)<br />
152
Separate financial statements at 31 December <strong>2012</strong> – Notes<br />
6.16 Reversal of<br />
impairment<br />
losses on<br />
investments<br />
No equity investments were revalued in <strong>2012</strong> or 2011.<br />
6.17 Impairment<br />
losses on<br />
investments<br />
The impairment losses on equity investments reflect the impairment loss on the investments in <strong>Indesit</strong><br />
Electrodomesticos S.A., 3.9 million euro, and <strong>Indesit</strong> Ukraine, 5.0 million euro. Further information is<br />
provided in note 7.4.<br />
6.18 Income tax<br />
expense<br />
The taxation charged to the income statement is analyzed below.<br />
(million euro) <strong>2012</strong> 2011<br />
Deferred tax assets, net 8.1 1.9<br />
IRES (6.7) (3.0)<br />
IRAP (4.1) (5.6)<br />
Prior year taxes 2.9 (8.7)<br />
Other income taxes (0.1) (1.3)<br />
Total 0.2 (16.7)<br />
The following table reconciles the theoretical tax charge, determined using the reference tax rate, with<br />
the reported tax charge.<br />
(million euro) <strong>2012</strong> 2011<br />
Profit before tax 45.7 27.2<br />
Theoretical tax charge (12.6) (7.5)<br />
Actual tax charge 0.2 (16.7)<br />
Total difference (12.8) (9.3)<br />
Irap (current and deferred) (4.3) (5.6)<br />
Dividends 22.8 9.3<br />
Other (5.7) (12.9)<br />
Total difference 12.8 (9.3)<br />
The difference between the theoretical and reported tax charges is mainly due to the positive effect of<br />
the higher dividends received in <strong>2012</strong>.<br />
The lower negative impact of other effects in <strong>2012</strong> mainly reflects the liability of about 8.4 million euro<br />
recognised in 2011 to settle transfer pricing matters raised by the Tax Authorities in relation to the<br />
2006-2010 tax years.<br />
153
Separate financial statements at 31 December <strong>2012</strong> – Notes<br />
7. Notes to the separate statement of financial position<br />
7.1 Property, plant<br />
and equipment<br />
The changes in property, plant and equipment are analyzed in the tables presented on the following<br />
page.<br />
The change in property, plant and equipment reflects additions of 30.7 million euro linked to the<br />
investment in new products, and retirements, net of the related accumulated depreciation, of 6.8<br />
million euro.<br />
The depreciation and impairment losses for the year was 35.1 million euro (33.6 million euro). No<br />
impairment losses were recognised in <strong>2012</strong> or 2011.<br />
Unfulfilled orders placed for the supply of property, plant and equipment amount to 3.0 million euro.<br />
The ownership of property is not restricted by liens and charges and there are no significant finance<br />
lease commitments.<br />
The changes in historical cost are presented below:<br />
(million euro) 31.12.2011 Additions<br />
Depreciation<br />
and<br />
impairment<br />
losses Decreases<br />
Reclassifications<br />
Other<br />
movements 31.12.<strong>2012</strong><br />
Land and buildings 126.6 1.3 - (0.9) 1.5 0.2 128.6<br />
Plant and machinery 344.0 7.8 - (15.6) 4.1 - 340.2<br />
Industrial and commercial equipment 280.0 5.8 - (17.9) 7.8 0.0 275.8<br />
Assets under construction 14.6 15.2 - - (14.0) 0.0 15.8<br />
Other assets 38.2 0.7 - (2.0) 0.5 - 37.4<br />
Total 803.3 30.7 - (36.5) (0.0) 0.2 797.7<br />
(million euro) 31.12.2010 Additions<br />
Depreciation<br />
and<br />
impairment<br />
losses Decreases<br />
Reclassifications<br />
Other<br />
movements 31.12.2011<br />
Land and buildings 135.8 1.9 - (14.2) 3.0 (0.0) 126.6<br />
Plant and machinery 338.7 13.9 - (19.6) 10.9 (0.0) 344.0<br />
Industrial and commercial equipment 280.5 11.5 - (26.0) 14.0 (0.0) 280.0<br />
Assets under construction 29.0 13.7 - - (28.1) (0.0) 14.6<br />
Other assets 38.7 0.6 - (1.4) 0.2 0.0 38.2<br />
Total 822.8 41.7 - (61.1) (0.0) (0.0) 803.3<br />
154
Separate financial statements at 31 December <strong>2012</strong> – Notes<br />
The change in accumulated depreciation is presented below:<br />
(million euro) 31.12.2011 Additions<br />
Depreciation<br />
and<br />
impairment<br />
losses<br />
Decreases<br />
Other<br />
movements 31.12.<strong>2012</strong><br />
Land and buildings (52.0) - (3.4) 0.8 - (0.0) (54.5)<br />
Plant and machinery (278.5) - (14.9) 10.8 - - (282.6)<br />
Industrial and commercial equipment (246.6) - (15.8) 16.1 - 0.0 (246.3)<br />
Other assets (35.7) - (1.0) 2.0 - 0.1 (34.7)<br />
Total (612.7) - (35.1) 29.7 - 0.0 (618.1)<br />
(million euro) 31.12.2010 Additions<br />
Depreciation<br />
and<br />
impairment<br />
losses<br />
Decreases<br />
Other<br />
movements 31.12.2011<br />
Land and buildings (55.2) - (3.7) 7.0 - (0.0) (52.0)<br />
Plant and machinery (284.0) - (13.9) 19.4 - 0.0 (278.5)<br />
Industrial and commercial equipment (257.4) - (14.8) 25.6 - 0.0 (246.6)<br />
Other assets (35.8) - (1.2) 1.3 - (0.0) (35.7)<br />
Total (632.5) - (33.6) 53.4 - 0.0 (612.7)<br />
The change in net carrying amount is presented below:<br />
(million euro) 31.12.2011 Additions<br />
Depreciation<br />
and<br />
impairment<br />
losses<br />
Decreases<br />
Other<br />
movements 31.12.<strong>2012</strong><br />
Land and buildings 74.6 1.3 (3.4) (0.1) 1.5 0.1 74.0<br />
Plant and machinery 65.5 7.8 (14.9) (4.8) 4.1 - 57.7<br />
Industrial and commercial equipment 33.5 5.8 (15.8) (1.8) 7.8 0.0 29.4<br />
Assets under construction 14.6 15.2 - - (14.0) 0.0 15.8<br />
Other assets 2.5 0.7 (1.0) (0.1) 0.5 0.1 2.7<br />
Total 190.7 30.7 (35.1) (6.8) (0.0) 0.2 179.6<br />
(million euro) 31.12.2010 Additions<br />
Depreciation<br />
and<br />
impairment<br />
losses<br />
Decreases<br />
Reclassifications<br />
Reclassifications<br />
Reclassifications<br />
Reclassifications<br />
Other<br />
movements 31.12.2011<br />
Land and buildings 80.5 1.9 (3.7) (7.1) 3.0 (0.0) 74.6<br />
Plant and machinery 54.7 13.9 (13.9) (0.1) 10.9 0.0 65.5<br />
Industrial and commercial equipment 23.1 11.5 (14.8) (0.4) 14.0 (0.0) 33.5<br />
Assets under construction 29.0 13.7 - - (28.1) (0.0) 14.6<br />
Other assets 2.9 0.6 (1.2) (0.0) 0.2 0.0 2.5<br />
Total 190.3 41.7 (33.6) (7.6) (0.0) (0.0) 190.7<br />
155
Separate financial statements at 31 December <strong>2012</strong> – Notes<br />
7.2 Other intangible<br />
assets with<br />
a finite life<br />
The changes in historical cost are presented below:<br />
(million euro) 31.12.2011 Increases<br />
Amortization<br />
and<br />
impairment<br />
losses<br />
Decreases<br />
Other<br />
movements 31.12.<strong>2012</strong><br />
Development costs 79.3 11.7 - (0.2) 4.3 (5.6) 89.5<br />
Licences and software 66.3 5.5 - (0.4) 3.2 (8.4) 66.2<br />
Brands with a finite life 0.1 - - - - (0.0) 0.1<br />
Intangible assets under construction 8.3 10.4 - - (7.5) - 11.1<br />
Other intangible assets 0.2 0.0 - - - (0.2) -<br />
Total 154.3 27.6 - (0.7) 0.0 (14.2) 167.0<br />
(million euro) 31.12.2010 Increases<br />
Amortization<br />
and<br />
impairment<br />
losses<br />
Decreases<br />
Other<br />
movements 31.12.2011<br />
Development costs 65.7 11.8 - (0.1) 12.5 (10.6) 79.3<br />
Licences and software 62.8 5.9 - (0.9) 2.4 (3.8) 66.3<br />
Brands with a finite life 0.1 - - - - - 0.1<br />
Intangible assets under construction 15.6 7.6 - - (14.8) 0.0 8.3<br />
Other intangible assets 0.1 0.1 - - - (0.0) 0.2<br />
Total 144.3 25.4 - (0.9) 0.0 (14.4) 154.3<br />
The change in accumulated depreciation is presented below:<br />
(million euro) 31.12.2011 Increases<br />
Amortization<br />
and<br />
impairment<br />
losses<br />
Decreases<br />
Other<br />
movements 31.12.<strong>2012</strong><br />
Development costs (45.1) - (13.7) - 0.0 5.6 (53.3)<br />
Licences and software (39.2) - (10.2) - (0.0) 8.4 (41.0)<br />
Brands with a finite life (0.1) - - - - 0.0 (0.1)<br />
Other intangible assets (0.1) - - - - 0.1 -<br />
Total (84.5) - (23.9) - - 14.1 (94.4)<br />
(million euro) 31.12.2010 Increases<br />
Amortization<br />
and<br />
impairment<br />
losses<br />
Decreases<br />
Reclassification<br />
Reclassification<br />
Reclassification<br />
Reclassification<br />
Other<br />
movements 31.12.2011<br />
Development costs (40.3) - (15.4) - - 10.6 (45.1)<br />
Licences and software (32.8) - (10.2) - - 3.8 (39.2)<br />
Brands with a finite life (0.1) - (0.0) - - - (0.1)<br />
Other intangible assets (0.1) - (0.0) - - 0.0 (0.1)<br />
Total (73.3) - (25.6) - - 14.4 (84.5)<br />
156
Separate financial statements at 31 December <strong>2012</strong> – Notes<br />
The change in net carrying amount is presented below:<br />
(million euro) 31.12.2011 Additions<br />
Amortization<br />
and<br />
impairment<br />
losses<br />
Decreases<br />
Other<br />
movements 31.12.<strong>2012</strong><br />
Development costs 34.2 11.7 (13.7) (0.2) 4.3 - 36.3<br />
Licences and software 27.1 5.5 (10.2) (0.4) 3.2 - 25.2<br />
Brands with a finite life - - - - - - -<br />
Intangible assets under construction 8.3 10.4 - - (7.5) - 11.1<br />
Other intangible assets 0.1 0.0 - - - (0.1) -<br />
Total 69.8 27.6 (23.9) (0.7) 0.0 (0.1) 72.6<br />
(million euro) 31.12.2010 Additions<br />
Amortization<br />
and<br />
impairment<br />
losses<br />
Decreases<br />
Reclassifications<br />
Reclassifications<br />
Other<br />
movements 31.12.2011<br />
Development costs 25.4 11.8 (15.4) (0.1) 12.5 - 34.2<br />
Licences and software 30.0 5.9 (10.2) (0.9) 2.4 0.0 27.1<br />
Brands with a finite life 0.0 - (0.0) - - - -<br />
Intangible assets under construction 15.6 7.6 - - (14.8) 0.0 8.3<br />
Other intangible assets 0.0 0.1 (0.0) - - - 0.1<br />
Total 71.0 25.4 (25.6) (0.9) 0.0 0.0 69.8<br />
Capitalized Development costs amounted to 11.7 million euro (11.8 million euro), mainly in relation to<br />
the work on new products.<br />
Development costs have enabled the acquisition of a greater know-how in industrial or commercial<br />
matters.<br />
The elimination of the historical values resulting from the impairment loss of fully amortized<br />
development costs amounted to 5.6 million euro (10.6 million euro).<br />
The amortization charge for the year was 13.7 million euro (15.4 million euro).<br />
The increases in the Licenses and software caption include 4.8 million euro (5.2 million euro) incurred<br />
to develop and enhance software programs, and 0.7 million euro (0.7 million euro) relating to IT user<br />
licences (SAP, Microsoft etc.).<br />
The capitalized licences, totaling a historical cost of 11.3 million euro, mainly relating to the rights to<br />
use the brand Ariston, for 6.7 million euro (total amortized at 31 December <strong>2012</strong> to 4.2 million euro),<br />
and the rights of use of computer programs for 4.6 million euro.<br />
The elimination of fully amortized software and licences resulted in the cancellation of historical costs<br />
totaling 6.7 million euro (2.7 million euro) and 1.7 million euro (1.1 million euro) respectively.<br />
The amortization charges for software and licences totaled 8.9 million euro (8.9 million euro) and<br />
1.2 million euro (1.4 million euro) respectively.<br />
157
Separate financial statements at 31 December <strong>2012</strong> – Notes<br />
The Group’s principal brands, Hotpoint and <strong>Indesit</strong>, are not recognised in the financial statements.<br />
The right to use the Hotpoint name in the UK and Ireland is owned by <strong>Indesit</strong> Company UK Ltd, while<br />
the right to use it in all other countries where the Group owns the name is held by <strong>Indesit</strong> Company<br />
Luxembourg S.A. The Hotpoint brand is used under licence by <strong>Indesit</strong> Company S.p.A.<br />
Although the right to use the <strong>Indesit</strong> name is owned by <strong>Indesit</strong> Company S.p.A., it was removed from<br />
the financial statements in 2005, on the transition to international financial reporting standards, since<br />
it had already been fully amortized. The only recognised brands is therefore the Star brand, acquired<br />
on the merger of that company in 2003. The historical cost recognized, 0.1 million euro, has been fully<br />
amortized.<br />
Intangible assets consist primarily of ongoing development costs of 7.8 million euro (5.0 million euro)<br />
and software and licences for 3.3 million euro (3.3 million euro).<br />
The other intangible assets relates multiannual expenditure made on rental properties.<br />
7.3 Investments<br />
in associates<br />
Investments in associates are analyzed below:<br />
Company name (million euro) % 31.12.<strong>2012</strong> 31.12.2011<br />
Trade Place B.V. 20 0.5 0.5<br />
Total associates 0.5 0.5<br />
7.4 Investments<br />
in subsidiaries<br />
and other<br />
non-current<br />
assets<br />
Investments in subsidiaries and other non-current assets comprise investments in subsidiaries,<br />
investments in companies which generally represent less than 20% of their equity capital or voting<br />
rights, and other non-current financial assets.<br />
158
Separate financial statements at 31 December <strong>2012</strong> – Notes<br />
Investments in directly and indirectly-held subsidiaries and other companies are analyzed in the table<br />
below, which indicates the direct interest held.<br />
Companies (million euro) % 31.12.<strong>2012</strong> 31.12.2011<br />
Subsidiaries<br />
<strong>Indesit</strong> Company Ceská S.r.o. 100.00 0.0 0.0<br />
<strong>Indesit</strong> Electrodomesticos S.A. 79.00 0.0 0.0<br />
Merloni Domestic Appliances Ltd. 19.60 13.6 13.6<br />
<strong>Indesit</strong> Company UK Holdings Ltd. 38.70 136.7 0.0<br />
<strong>Indesit</strong> Company Luxembourg S.A. 100.00 105.2 68.1<br />
<strong>Indesit</strong> Company Polska Sp.zo.o. 100.00 221.7 182.7<br />
<strong>Indesit</strong> Company Portugal Electrodomésticos S.A. 0.00 0.0 0.0<br />
<strong>Indesit</strong> Company Beyaz Esya Pazarlama A.S. 100.00 3.8 3.8<br />
<strong>Indesit</strong> Company Beyaz Esya Sanayi ve Ticaret A.S. 36.20 22.1 22.1<br />
<strong>Indesit</strong> Argentina S.A. 3.00 0.2 0.2<br />
<strong>Indesit</strong> Company IP S.r.l. 100.00 0.0 0.0<br />
Aeradriatica S.p.A. 100.00 20.3 20.3<br />
<strong>Indesit</strong> Company Rus Ltd. 100.00 0.1 0.1<br />
Closed Joint Stock Company <strong>Indesit</strong> International 100.00 143.2 143.2<br />
<strong>Indesit</strong> Ukraine LLC 100.00 0.0 1.1<br />
<strong>Indesit</strong> Company Bulgaria Ltd. 100.00 0.0 0.0<br />
<strong>Indesit</strong> Company Nordics A.B. 100.00 0.0 0.0<br />
Total subsidiaries 667.0 455.2<br />
Other companies<br />
Consorzio CONAI 0.07 0.0 0.0<br />
Partecipation to Consorzio ECODOM 4.81 0.0 0.0<br />
Consorzio delle Dennie - Investment 14.28 0.0 0.0<br />
Distretto elettrodomestico S.c.ar.l. 6.45 0.0 0.0<br />
Unifabriano S.c.ar.l. - Investments 10.41 0.0 0.0<br />
Emittente Titoli S.p.A. - c/Investments 1.09 0.1 0.1<br />
Consorzio Calef - c/Investments n,a 0.0 0.0<br />
Consorzio CO - ENV c/Investments 8.33 0.0 0.0<br />
E&A Soc. Serv. Energ. Ambiente S.r.l. c/Investments 7.14 0.0 0.0<br />
Radio A Korasidis AE c/Investments 0.08 0.0 0.0<br />
SPES S.p.A. c/Investments 15.40 0.2 0.2<br />
PROPLAST c/Investments n.a. 0.0 0.0<br />
HOMELAB c/Investments n.a. 0.0 0.0<br />
Total other companies 0.3 0.3<br />
Total investments in subsidiaries and other investments 667.3 455.6<br />
The companies listed as subsidiaries despite being less than 50% owned are, via other subsidiaries,<br />
subject to the indirect control of the majority of their voting rights.<br />
159
Separate financial statements at 31 December <strong>2012</strong> – Notes<br />
Further information about the overall control percentages is provided in Attachment 1 (List of<br />
companies consolidated on a line-by-line basis) to the consolidated financial statements.<br />
The equity investments held by <strong>Indesit</strong> Company S.p.A. in other companies relate to unlisted<br />
companies whose securities are not traded in a regulated market. Accordingly, their fair value cannot<br />
be determined reliably since there were no transactions involving these securities during the past year.<br />
The composition of and changes in equity investments are analyzed below:<br />
(million euro) 31.12.2011 Increases<br />
Impairment<br />
losses Decreases<br />
Reclassification<br />
Other<br />
movements 31.12.<strong>2012</strong><br />
<strong>Indesit</strong> Company Ceská S.r.o. 0.0 - - - - - 0.0<br />
<strong>Indesit</strong> Electrodomesticos S.A. - 0.2 (0.2) - - - -<br />
Merloni Domestic Appliances Ltd. 13.6 - - - - - 13.6<br />
<strong>Indesit</strong> Company Uk Holdings Ltd. - 136.7 - - - - 136.7<br />
<strong>Indesit</strong> Company Luxembourg S.A. 68.1 37.1 - - - - 105.2<br />
<strong>Indesit</strong> Company Polska Sp.zo.o. 182.7 39.9 - - - (0.9) 221.7<br />
<strong>Indesit</strong> Company Portugal Electrodomésticos S.A. 0.0 - - - - - 0.0<br />
<strong>Indesit</strong> Company Beyaz Esya Pazarlama A.S. 3.8 - - - - - 3.8<br />
<strong>Indesit</strong> Company Beyaz Esya Sanayi ve Ticaret A.S. 22.1 - - - - (0.0) 22.1<br />
<strong>Indesit</strong> Argentina S.A. 0.2 - - - - - 0.2<br />
<strong>Indesit</strong> Company IP S.r.l. 0.0 - - - - - 0.0<br />
Aeradriatica S.p.A. 20.3 - - - - - 20.3<br />
<strong>Indesit</strong> Company Rus Ltd. 0.1 - - - - - 0.1<br />
Closed Joint Stock Company <strong>Indesit</strong> International 143.2 - - - - (0.0) 143.2<br />
<strong>Indesit</strong> Ukraine LLC 1.1 - (1.1) - - - -<br />
<strong>Indesit</strong> Company Bulgaria Ltd. 0.0 - - - - - 0.0<br />
<strong>Indesit</strong> Company Nordics A.B. - 0.0 - - - - 0.0<br />
Total 455.2 214.0 (1.3) - - (1.0) 667.0<br />
<strong>Indesit</strong> S.p.A. purchased 38.65% of <strong>Indesit</strong> Company UK Holdings Ltd. for 136.7 million euro and<br />
increased its investment in <strong>Indesit</strong> Company Luxembourg S.A. by 37.1 million euro. These changes<br />
reflect the reorganization of the chain of ownership within the Group.<br />
The increase in equity investments reflects a payment on capital account made to <strong>Indesit</strong> Company<br />
Electrodomesticos, 0.2 million euro. This investment was impaired by 0.2 million euro at the same time.<br />
In addition, following the impairment losses reported, a provision for risks of 3.9 million euro has also<br />
been recognised.<br />
<strong>Indesit</strong> Ukraine was similarly impaired by 1.1 million euro and, following the impairment losses<br />
reported, a provision for risks of 4.0 million euro has been recognised.<br />
The increase of 39.9 million euro in relation to <strong>Indesit</strong> Company Polska Sp.zo.o. reflects a payment<br />
made on capital account.<br />
160
Separate financial statements at 31 December <strong>2012</strong> – Notes<br />
Other movements include the net effect, 0.9 million euro, resulting from the inclusion in <strong>2012</strong> of a<br />
financial guarantee of <strong>Indesit</strong> Company S.p.A. for <strong>Indesit</strong> Company Polska Sp.zo.o., to that already<br />
recognised in 2011.<br />
The cumulative impairment losses recognised are analyzed in the following table.<br />
Company name (million euro) 31.12.<strong>2012</strong> 31.12.2011<br />
<strong>Indesit</strong> Electrodomesticos S.A. (45.2) (45.0)<br />
Merloni Domestic Appliances Ltd. (10.6) (10.6)<br />
<strong>Indesit</strong> Company Beyaz Esya Pazarlama A.S. (4.3) (4.3)<br />
Aeradriatica S.p.A. (0.2) (0.2)<br />
<strong>Indesit</strong> Ukraine LLC (1.1) -<br />
Radio A Korasidis AE (0.7) (0.7)<br />
Total (62.1) (60.8)<br />
There is no basis for the reinstatement of these impairment losses at the reporting date.<br />
The carrying amount of equity investments is compared with their equity value in Attachment 5. The<br />
negative differences emerging from this comparison mainly relate to <strong>Indesit</strong> Company UK Holdings.<br />
Its recoverable amount has therefore been verified by testing for impairment the UK CGU, as discussed<br />
in the analyses of intangible assets with an indefinite useful life and goodwill, presented in note<br />
9.10 to the consolidated financial statements. Taking account of the results of these analyses, the<br />
difference between the carrying amount of the investments in <strong>Indesit</strong> Company UK Holdings and their<br />
measurement using the equity method is deemed to be recoverable.<br />
Similar differences with respect to their carrying amounts also apply to Merloni Domestic Appliances,<br />
3.5 million euro, and <strong>Indesit</strong> Company Rus Ltd, 4.3 million euro. With regard to Merloni Domestic<br />
Appliances, the recoverable amount of the entities active in the UK market is tested annually for<br />
impairment. The losses relating to <strong>Indesit</strong> Company Rus are not deemed permanent.<br />
7.5 Deferred tax<br />
assets<br />
Deferred tax assets at 31 December <strong>2012</strong> amount to 32.4 million euro (24.0 million euro).<br />
The analysis of deferred taxation and information about the deferred tax assets offset against deferred<br />
tax liabilities are provided in the note on deferred taxation.<br />
161
Separate financial statements at 31 December <strong>2012</strong> – Notes<br />
7.6 Inventories<br />
Inventories are analyzed as follows:<br />
(million euro) 31.12.<strong>2012</strong> 31.12.2011<br />
Raw materials 30.8 35.4<br />
Obsolescence provision (1.0) (0.8)<br />
Total raw materials 29.8 34.6<br />
Finished and semi-finished products 54.3 64.2<br />
Obsolescence provision (6.1) (4.8)<br />
Total finished and semi-finished products 48.3 59.4<br />
Spare parts 13.8 14.8<br />
Obsolescence provision (1.6) (1.1)<br />
Total spare parts 12.2 13.7<br />
Total inventories 90.3 107.6<br />
The provision for obsolescence totals 8.7 million euro (6.7 million euro) and the net increase during the<br />
year was 1.9 million euro (1.6 million euro).<br />
7.7 Trade receivables<br />
Trade receivables comprise amounts due from customers as a result of commercial transactions<br />
and the provision of services, 418.3 million euro (406.0 million euro), stated net of the allowance for<br />
doubtful accounts of 15.2 million euro (17.3 million euro).<br />
As part of its policy to diversify the sources of finance, the <strong>Indesit</strong> Group has devised a securitization<br />
program for the Parent and <strong>Indesit</strong> Company France S.A.<br />
The securitization involves the without-recourse sale of trade receivables, on a revolving basis, by the<br />
Parent and by <strong>Indesit</strong> Company France S.A. The receivables are acquired by vehicle companies, which<br />
are financed by the issue of securities whose repayment is guaranteed by the cash flows generated<br />
by the portfolio of receivables sold (asset-backed securities). There are two classes of asset-backed<br />
security: the senior securities are placed in the market and subscribed for by financial investors; the<br />
junior securities, whose repayment is subordinated to that of the senior securities, are taken up by<br />
<strong>Indesit</strong> Company International Business S.A., a subsidiary.<br />
Control over the receivables is not transferred in full to the vehicle companies (the vehicle company<br />
that acquires the receivables of <strong>Indesit</strong> Company S.p.A. is Olympia Finance S.r.l.), since their use of<br />
them is restricted by the fact that they represent collateral for the redemption of the asset-backed<br />
securities issued to finance the securitization program. Accordingly, the trade receivables sold are not<br />
derecognized as an asset and, at 31 December <strong>2012</strong>, they total 64.4 million euro (76.9 million euro).<br />
Other financial payables include the liability to Olympia Finance S.r.l., 89.5 million euro (102.9 million<br />
euro). The financial liability at 31 December <strong>2012</strong> exceeds the amount of receivables sold but not<br />
derecognized, since it includes about 25.1 million euro (26 million euro) received almost entirely from<br />
customers of <strong>Indesit</strong> Company S.p.A. but not yet paid over to Olympia Finance S.r.l. This amount was<br />
paid to Olympia Finance S.r.l. in early 2013.<br />
162
Separate financial statements at 31 December <strong>2012</strong> – Notes<br />
Advances to suppliers at 31 December <strong>2012</strong> amount to 1.5 million euro (1.7 million euro).<br />
The movements in the allowance for doubtful accounts are analyzed in the following table:<br />
(million euro) 31.12.<strong>2012</strong> 31.12.2011<br />
Opening balance 17.3 16.3<br />
Provision 1.8 2.7<br />
Utilisation (3.9) (1.8)<br />
Closing balance 15.2 17.3<br />
Amounts due from subsidiaries are detailed below:<br />
(million euro) 31.12.<strong>2012</strong> 31.12.2011<br />
Trade receivables from subsidiaries<br />
Fabrica Portugal S.a. 0.4 0.4<br />
<strong>Indesit</strong> Company UK Ltd. 54.3 67.1<br />
<strong>Indesit</strong> Company Portugal Electrodomésticos S.a. 4.2 5.2<br />
<strong>Indesit</strong> Electrodomesticos S.a. 7.9 6.9<br />
<strong>Indesit</strong> Company France S.a. 28.0 35.4<br />
<strong>Indesit</strong> Company Deutschland GmbH 0.8 2.1<br />
<strong>Indesit</strong> Company International B.V. 4.6 6.6<br />
<strong>Indesit</strong> Company International B.V. - rep. office 0.0 0.1<br />
<strong>Indesit</strong> Company Bulgaria Ltd. 0.0 0.0<br />
<strong>Indesit</strong> Company International Business S.a. 33.3 33.1<br />
<strong>Indesit</strong> Company Ceská S.r.o. 0.1 0.0<br />
<strong>Indesit</strong> Company Magyarország Kft 9.7 4.7<br />
<strong>Indesit</strong> Company Polska Sp.zo.o. 44.3 35.3<br />
<strong>Indesit</strong> Company Beyaz Esya Sanayi ve Ticaret A.S. 53.5 40.7<br />
<strong>Indesit</strong> Company Beyaz Esya Pazarlama A.S. 1.7 1.1<br />
<strong>Indesit</strong> Company Norge Ltd. 0.2 0.2<br />
<strong>Indesit</strong> Company Appliances Hellas Mepe 0.1 0.1<br />
<strong>Indesit</strong> Argentina S.a. 0.8 0.4<br />
Closed Joint Stock Company <strong>Indesit</strong> International 11.4 6.1<br />
Wuxi <strong>Indesit</strong> Home Appliance Co. Ltd. - -<br />
General Domestic Appliances Holdings Ltd. 0.3 0.1<br />
<strong>Indesit</strong> Osterreich GmbH 4.3 4.6<br />
<strong>Indesit</strong> Company Rus Ltd. 15.1 11.0<br />
<strong>Indesit</strong> Company Belgium S.a. 0.0 -<br />
<strong>Indesit</strong> Company IP S.r.l. 0.0 -<br />
Aeradriatica S.p.A. 0.1 0.1<br />
Wuxi <strong>Indesit</strong> Domestic Appliance Technology Co. Ltd. - 0.0<br />
<strong>Indesit</strong> Ukraine LLC 0.3 0.2<br />
<strong>Indesit</strong> Company Luxembourg S.a. 0.2 0.3<br />
<strong>Indesit</strong> Company Nordics A.B. 0.1 -<br />
Total subsidiaries 275.7 261.8<br />
163
Separate financial statements at 31 December <strong>2012</strong> – Notes<br />
With regard to the analysis by geographical area, the amounts receivable from non-Group counterparts<br />
in Italy and abroad (including the portfolio of notes not yet collected, net of the allowance for doubtful<br />
accounts and credit notes to be issued) total respectively 130.3 million euro (140.1 million euro) and<br />
12.4 million euro (4.0 million euro).<br />
7.8 Tax receivables<br />
Tax receivables are due from the tax authorities in relation to advance taxation. These amounts are<br />
analyzed below.<br />
(million euro) 31.12.<strong>2012</strong> 31.12.2011<br />
IRPEF on advances of post-employment benefits - 0.2<br />
Advance taxation 0.9 1.0<br />
IRES 3.0 -<br />
IRAP 1.4 0.2<br />
Total 5.2 1.4<br />
The increase is primarily due to the IRES claim for refund of tax in accordance with the recent<br />
regulatory changes that have introduced business tax deduction on the cost of personnel.<br />
7.9 Other receivables<br />
and current<br />
assets<br />
Other receivables and current assets are analyzed as follows:<br />
(million euro) 31.12.<strong>2012</strong> 31.12.2011<br />
Due from employees 0.7 0.8<br />
Grants due from public bodies 3.8 3.6<br />
Due from social security and pension institutions 3.1 4.3<br />
Other VAT receivables 4.4 9.5<br />
Other receivables v/state administrators 7.3 7.3<br />
Other receivables 0.4 0.8<br />
Total 19.8 26.2<br />
Grants receivable from public administrations include 1.5 million euro in reimbursements for steel<br />
exports (1.3 million euro) and 2.3 million euro in start-up grants to be collected (2.3 million euro).<br />
The income-related grants were received for the application of innovative technology to new products<br />
and products that are already on sale.<br />
164
Separate financial statements at 31 December <strong>2012</strong> – Notes<br />
7.10 Total equity<br />
The statement of changes in equity is presented in a separate schedule.<br />
Share capital comprises ordinary shares and savings shares, as analyzed below.<br />
31.12.<strong>2012</strong> 31.12.2011<br />
Description<br />
Number Euro Number Euro<br />
Ordinary shares 113,665,684 102,299,116 113,665,684 102,299,116<br />
Savings shares 511,282 460,154 511,282 460,154<br />
Total 114,176,966 102,759,270 114,176,966 102,759,270<br />
During the year are expired 102,500 options granted in 2002 to 7.9258 euro and 2,500 options granted<br />
in 2003 to 12.6479 euro. During the year there were granted stock options.<br />
The number of shares shown in the table is inclusive of treasury shares. Net of treasury shares held<br />
directly by <strong>Indesit</strong> Company S.p.A., 11,039,750, common shares amounted to 102,625,934.<br />
The amount of treasury stock as a reduction of shareholders’ equity, and in particular the share capital<br />
and the share premium reserve shares, amounted to 33.0 million euro.<br />
The nominal value of the ordinary and savings shares is 0.90 euro.<br />
The holders of ordinary shares and savings shares enjoy the ownership and participation rights granted<br />
under Italian law and the articles of association of <strong>Indesit</strong> Company S.p.A.<br />
In addition to the right to participate in the division of profits and the return of capital, the ordinary<br />
shares also carry the right to vote at ordinary and extraordinary shareholders’ meetings. The savings<br />
shares, on the other hand, have greater ownership rights but reduced administrative rights.<br />
The greater ownership rights comprise:<br />
• the right to an allocation of net profit for the year (after allocating 5% to the legal reserve)<br />
representing up to 5% of the nominal value of the savings shares;<br />
• the right, if a dividend of less than 5% of nominal value was paid in a given year, to collect this<br />
shortfall in the preference dividend in the following two years;<br />
• the right, if a dividend is declared at the shareholders’ meeting, to receive a total dividend that is<br />
higher than that paid on the ordinary shares by 2% of the nominal value of the savings shares.<br />
In addition, in the event of a capital reduction to cover losses, the nominal value of the savings shares is<br />
only reduced by the amount of the losses that exceed the total nominal value of the other shares.<br />
165
Separate financial statements at 31 December <strong>2012</strong> – Notes<br />
The lesser administrative rights with respect to the ordinary shares consist of the absence of voting<br />
rights at ordinary and extraordinary shareholders’ meetings.<br />
The outstanding stock options granted are 147,000 and 3,002,500 not yet granted.<br />
Considering the amounts reported in the statement of comprehensive income, the decrease in cash<br />
flow hedges during <strong>2012</strong> by 0.5 million euro relates entirely to transactions that are still outstanding at<br />
31 December <strong>2012</strong>.<br />
The description of, changes in and restrictions applying to the principal equity reserves are described<br />
below. The detailed analysis of these changes is presented in a separate schedule.<br />
Retained earnings (comprising the extraordinary reserve) have decreased by 13.3 million euro.<br />
The profit for 2011 of 10.4 million euro was used in full for the payment of dividends totaling<br />
23.7 million euro.<br />
Reserves<br />
The share premium reserve amounts to 35.9 million euro.<br />
Legal reserve: this reserve, 22.7 million euro, reflects allocation of 5% of the net profit earned each year.<br />
The reserve has exceeded the legal threshold of one fifth of the nominal value of share capital.<br />
Other negative reserves, 12.4 million euro. Other reserves are analyzed as follows:<br />
(million euro) 31.12.<strong>2012</strong> 31.12.2011<br />
Hedging reserve - derivatives (8.9) (8.4)<br />
Retained earnings 1.4 1.4<br />
Stock option reserve 0.4 0.4<br />
Grants Law no. 488/92 11.2 11.2<br />
Reserve par. 21 Law no. 219 of 14/5/81 4.0 4.0<br />
Reserve under par. 14 Law no. 64/86 2.2 2.2<br />
Adjustment to plant costs (CASMEZ) 0.7 0.7<br />
Grants Law 29/05/82 no. 308 0.1 0.1<br />
Grants Law no. 19/84 0.0 0.0<br />
Reserve par. 13 Law no. 124/96 c. 6 0.0 0.0<br />
Grants under regional Law no. 29/1982 0.0 0.0<br />
Other reserves (23.5) (23.5)<br />
Total (12.4) (11.9)<br />
The reserve for derivative financial instruments recognized as cash flow hedges reflects the change in<br />
fair value of these instruments. This negative reserve amounts to 8.9 million euro.<br />
The merger surplus reserve, 1.4 million euro, was formed on the merger of Merloni Brembate S.p.A. in<br />
2003 and Wrap S.p.A. in 2007.<br />
166
Separate financial statements at 31 December <strong>2012</strong> – Notes<br />
The reserve established in relation to investment required at the Comunanza factory, under the terms<br />
of a territorial agreement, includes 5.3 million euro that is restricted. A further 13.0 million euro has also<br />
been restricted in order to obtain industrial investment grants for the Albacina site pursuant to Law<br />
488/92. This reserve amounts to 11.2 million euro.<br />
The reserve pursuant to art. 21 of Law 219/81, 4.0 million euro, represents the (tax-free) capital grants<br />
received for investment to repair and make functional improvements to the factories situated in<br />
Southern Italy that were damaged in the 1980 earthquake.<br />
The reserve pursuant to art. 14 of Law 64/86 reflects grants from the Ministry for Industry following<br />
the final acceptance testing of investment at the Comunanza factory. This reserve, 2.2 million euro, is<br />
unchanged.<br />
The reserve pursuant to Law 218/78 (investment in Southern Italy) relates to capital grants collected<br />
for investment at the Comunanza and Acerra factories. This reserve is unchanged and amounts to<br />
0.7 million euro.<br />
The grants under Regional Law 308/82 relate to investment in energy saving and recycling. This<br />
reserve, 0.1 million euro, is unchanged.<br />
The dividends paid on the ordinary shares in <strong>2012</strong> amounted to 23.7 million euro (31.0 million euro),<br />
while those paid on the savings shares in accordance with the articles of association amounted to<br />
0.1 million euro (0.2 million euro).<br />
The Board of Directors meeting held on 21 March 2013 approved these separate financial statements<br />
and recommended to the shareholders’ meeting the declaration of a dividend of 0.20 euro per<br />
ordinary share and 0.218 euro per savings share.<br />
The way the reserves can be utilized is analyzed in Attachment 6.<br />
7.11 Net financial<br />
position<br />
The net financial position and net borrowing of the Company are analyzed below.<br />
Non-current financial assets have been included in the calculation of net borrowing in order to<br />
represent fairly the overall exposure.<br />
(million euro) Note 31.12.<strong>2012</strong> 31.12.2011<br />
Current financial assets 7.11.1 37.3 137.5<br />
Cash and cash equivalents 7.11.2 10.2 9.1<br />
Banks and other short-term loans and borrowings 7.11.3 233.3 181.4<br />
Net financial indebtedness - short-term (185.8) (34.9)<br />
Medium and long-term loans and borrowings 7.11.5 232.4 248.1<br />
Net financial position * (418.2) (282.9)<br />
Other non-current financial assets 7.11.4 0.4 50.0<br />
Net financial indebtedness (417.7) (232.9)<br />
* As defined in Consob Communication DEM/6064293 dated 28 July 2006, applying the CESR recommendations dated 10<br />
February 2005.<br />
167
Separate financial statements at 31 December <strong>2012</strong> – Notes<br />
For the analysis of the dynamics of financial year, please refer to the sections listed below.<br />
7.11.1 Current<br />
financial<br />
assets<br />
7.11.2 Cash and cash<br />
equivalents<br />
7.11.3 Banks<br />
and other<br />
short-term<br />
loans and<br />
borrowings<br />
Current financial assets comprise the intercompany current accounts with <strong>Indesit</strong> Company<br />
International Business S.A. totaling 28.6 million euro (24.3 million euro), together with amounts due<br />
from factoring companies, 7.1 million euro (6.8 million euro), and other receivables, 1.6 million euro<br />
(1.4 million euro). The change compared to 2011 is due to the elimination of credit (approximately<br />
105.0 million euro) to <strong>Indesit</strong> Company Luxembourg S.A. as a result of reorganization within the Group.<br />
Cash and cash equivalents, 10.2 million euro (9.1 million euro) comprise bank and postal deposits, and<br />
cash and cash equivalents on hand.<br />
Current financial payables comprise amounts due within one year.<br />
(million euro) 31.12.<strong>2012</strong> 31.12.2011<br />
Short-term advances from banks 59.8 6.3<br />
Short-term advances for factoring of receivables 89.5 102.9<br />
Current portion of loans MCC 14.4 10.2<br />
Current portion of other medium/long-term loans 0.5 0.8<br />
Liability from the measurement of derivative instruments 5.5 3.2<br />
Financial payables due to <strong>Indesit</strong> Company International Business S.A. 0.0 0.0<br />
Financial payables due to <strong>Indesit</strong> Company Luxembourg S.A. 63.7 58.0<br />
Total 233.3 181.4<br />
The increase in Short-term advances from banks relates to use of the uncommitted line of credit.<br />
Short-term advances for factoring of receivables reflect the payable arising in relation to the<br />
securitization program. Further information about the securitization program is provided in note 7.7 on<br />
Trade receivables.<br />
The increase in the amount payable to <strong>Indesit</strong> Company Luxembourg S.A. mainly reflects the interest<br />
charged on loans.<br />
7.11.4 Other<br />
non-current<br />
financial<br />
assets<br />
Other non-current financial assets include 0.4 million euro (50.0 million euro) due from <strong>Indesit</strong><br />
Company Luxembourg S.A. The reduction reflects redemption of the profit participating bonds<br />
subscribed for in prior years.<br />
168
Separate financial statements at 31 December <strong>2012</strong> – Notes<br />
7.11.5 Medium<br />
and long-term<br />
loans and<br />
borrowings<br />
Medium and long-term interest-bearing loans and borrowings are analyzed as follows:<br />
(million euro) 31.12.<strong>2012</strong> 31.12.2011<br />
Loans and borrowings from <strong>Indesit</strong> Company Luxembourg S.A. 162.2 162.2<br />
Due to banks 61.5 74.8<br />
Due to other financial payables 1.8 2.8<br />
Liability from the measurement of derivative instruments 7.0 8.4<br />
Total 232.4 248.1<br />
Amounts due to banks have decreased on reclassification as short term of the installments due in 2013<br />
on the loan from the European Investment Bank.<br />
<strong>Indesit</strong> Company S.p.A. has an unused, syndicated revolving line of credit for 268.0 million euro that<br />
expires in 2016.<br />
The principal medium and long-term interest-bearing loans and borrowings are subject to certain<br />
financial covenants and other obligations linked to the consolidated financial statements. The<br />
parameters for these covenants, which are checked at 30 June and 31 December each year, are set out<br />
below:<br />
Revolving facility<br />
Covenant<br />
limit at<br />
31 December<br />
Covenant<br />
limit at<br />
30 June<br />
Net financial indebtedness/EBITDA ≤ 3.0 ≤ 4.0<br />
EBITDA/Net financial expenses ≥ 3.5 ≥ 3.5<br />
EIB financing<br />
Covenant<br />
limit at<br />
31 December<br />
Covenant<br />
limit at<br />
30 June<br />
Net financial indebtedness/EBITDA ≤ 3.0 na<br />
EBITDA/Net financial expenses ≥ 3.5 ≥ 3.5<br />
Equity ≥ 320<br />
million euro<br />
≥ 320<br />
million euro<br />
Securitization<br />
Covenant<br />
limit at<br />
31 December<br />
Covenant<br />
limit at<br />
30 June<br />
Net financial indebtedness/EBITDA ≤ 3.0 ≤ 3.5<br />
169
Separate financial statements at 31 December <strong>2012</strong> – Notes<br />
In addition to the financial covenants, the above lines of credit require <strong>Indesit</strong> Company S.p.A. and, in<br />
certain cases, a number of Group companies to comply with other affirmative and negative covenants<br />
that are consistent with market standards for transactions of a similar nature, amount, maturity and risk<br />
profile.<br />
Failure to comply with these financial covenants would, following the elapse of a given period of time<br />
available to correct such non-compliance, give the counterpart a right to the early repayment of the<br />
related borrowings.<br />
The above covenants are monitored constantly by the Group. All covenants are met at 31 December<br />
<strong>2012</strong>.<br />
Medium and long-term payables are analyzed by maturity in the following table.<br />
Medium/long-term financial liabilities<br />
(million euro)<br />
Total 2014 2015 2016 2017 2018 Total<br />
Loans and borrowings from <strong>Indesit</strong> Company<br />
Luxembourg S.A. 162.2 141.4 0.0 20.8 0.0 0.0 162.2<br />
Due to banks and other financial payables 70.2 18.2 13.8 12.6 12.8 12.8 70.2<br />
Total 232.4 159.6 13.8 33.4 12.8 12.8 232.4<br />
(million euro)<br />
Medium/<br />
long-term<br />
financial<br />
liabilities<br />
Due between<br />
1 and 5 years<br />
Due beyond<br />
5 years<br />
Loans and borrowings from <strong>Indesit</strong> Company Luxembourg S.A. 162.2 162.2 -<br />
Due to banks 61.5 49.0 12.5<br />
Due to other financial payables 1.8 1.3 0.4<br />
Liability from the measurement of derivative instruments 7.0 7.0<br />
Total 232.4 219.5 12.9<br />
170
Separate financial statements at 31 December <strong>2012</strong> – Notes<br />
7.12 Employee<br />
benefits<br />
The liability for employee benefits totals 35.2 million euro (38.1 million euro) and comprises the<br />
provision for severance indemnities.<br />
The following schedule reconciles the assets and liabilities recognised in relation to defined benefit plans<br />
and the charges made to the income statement, and presents the principal actuarial assumptions.<br />
Post-employment benefits<br />
(million euro)<br />
31.12.<strong>2012</strong> 31.12.2011<br />
Present value of the defined benefit obligation (start of year) 37.9 41.1<br />
Current service cost - -<br />
Financial expenses 1.7 1.8<br />
Contributions from plan participants - -<br />
Actuarial (gains)/losses 5.8 (0.4)<br />
Benefits paid by the plan/company (5.0) (5.0)<br />
Curtailment of plan 0.4 0.5<br />
Changes in exchange rates - -<br />
Present value of the defined benefit obligation (end of year) 40.8 37.9<br />
Fair value of plan assets (start of year) - -<br />
Expected return on plan assets - -<br />
Actuarial (gains)/losses - -<br />
Employer's contributions 5.0 5.0<br />
Employees' contributions - -<br />
Benefits paid (5.0) (5.0)<br />
Expenses - -<br />
Change in exchange rates - -<br />
Fair value of plan assets (end of year) - -<br />
Present value of defined benefit obligation under funded plans - -<br />
Fair value of plan assets - -<br />
Deficit (surplus) of funded plans - -<br />
Present value of defined benefit obligation under unfunded plans 40.8 37.9<br />
Actuarial (gains)/losses not recognised (5.5) 0.3<br />
Unrecognised post service cost - -<br />
Unrecognised assets (limit described in IAS 19 par. 58b) - -<br />
Recognised net liabilities/(assets) 35.2 38.1<br />
Current service cost - -<br />
Total operating costs 0.0 0.0<br />
Interest expense 1.7 1.8<br />
Expected return on plan assets - -<br />
Total financial expenses 1.7 1.8<br />
Profit/Loss on curtailment 0.4 0.5<br />
Total charge to profit or loss 2.1 2.3<br />
171
Separate financial statements at 31 December <strong>2012</strong> – Notes<br />
Post-employment benefits<br />
(million euro)<br />
31.12.<strong>2012</strong> 31.12.2011<br />
Assumptions used to determine defined benefit obligations<br />
Discount rate 3.25% 4.60%<br />
Salary increases 0.00% 0.00%<br />
Inflation rate 2.00% 2.00%<br />
Assumptions used to determine pension cost<br />
Discount rate 4.60% 4.75%<br />
Expected return on plan assets n.a. n.a.<br />
Expected salary increases n.a. n.a.<br />
Inflation rate 2.00% 2.00%<br />
The change in the discount rate is due to the reduction, which occurred in <strong>2012</strong>, of bond yields used<br />
as a benchmark (AA Corporate Bond). This change has affected the estimation of the components in<br />
actuarial balance as a result of the application of the corridor that have become negative for 5.5 million<br />
euro at 31 December <strong>2012</strong> (an increase of 0.3 million euro).<br />
7.13 Provisions for<br />
risks<br />
and charges<br />
The provisions for risks and charges cover estimated current and non-current liabilities the exact timing<br />
and/or extent of which are uncertain.<br />
This caption is analyzed as follows:<br />
<strong>2012</strong> movements<br />
(million euro)<br />
Opening<br />
balance Provisions Utilisations<br />
Closing<br />
balance<br />
Current<br />
portion<br />
Non-current<br />
portion<br />
Provision for warranties 21.2 1.9 (5.8) 17.3 9.6 7.7<br />
Provision for agents' termination indemnity 1.5 0.2 (0.3) 1.4 0.0 1.4<br />
Provision for restructuring 21.4 10.2 (5.1) 26.5 23.5 3.0<br />
Provision for WEEE 6.8 0.0 (2.6) 4.2 1.8 2.4<br />
Provision for disputes and other risks 4.0 8.4 (0.5) 11.9 3.0 8.9<br />
Other risk provisions - - - 0.0 - -<br />
Total 54.9 20.7 (14.3) 61.3 37.9 23.4<br />
2011 movements<br />
(million euro)<br />
Opening<br />
balance Provisions Utilisations<br />
Closing<br />
balance<br />
Current<br />
portion<br />
Non-current<br />
portion<br />
Provision for warranties 24.4 3.7 (6.9) 21.2 10.6 10.6<br />
Provision for agents' termination indemnity 1.5 0.2 (0.2) 1.5 0.0 1.5<br />
Provision for restructuring 30.3 0.9 (9.8) 21.4 18.1 3.4<br />
Provision for WEEE 7.7 - (0.9) 6.8 4.2 2.6<br />
Provision for disputes and other risks 12.7 1.2 (9.9) 4.0 3.4 0.6<br />
Other risk provisions - - - - 0.0 0.0<br />
Total 76.5 6.0 (27.7) 54.9 36.2 18.7<br />
172
Separate financial statements at 31 December <strong>2012</strong> – Notes<br />
The provision for product warranty represents the estimated costs to be incurred for work under<br />
warranty on products sold. The reduction reflects the steady improvement in the quality of products<br />
and, therefore, the lower expected volume of warranty work.<br />
The provision for agents’ termination indemnities, determined with reference to the commissions<br />
earned in accordance with art. 1751 of the Italian Civil Code and collective agreements, represents<br />
the estimated liability for payments to agents should their mandates be terminated (for reasons not<br />
attributable to them) by <strong>Indesit</strong> Company S.p.A.<br />
The provision for restructuring covers the estimated costs to be incurred on the reorganization of the<br />
None, Brembate and Refrontolo factories.<br />
The provision for environmental work covers plant exposed to environmental risks including, in<br />
particular, the replacement of asbestos roofing at the Italian factories.<br />
The provision for disputes and other risks reflects the best possible estimate of the likely liability based<br />
on the information available.<br />
From the year <strong>2012</strong>, the policy conditions for liability to third parties for damages caused by the<br />
finished products of the Group, have been revised the exemption was increased. This revision of the<br />
contract, together with the high number of claims incurred and borne by the insurer in 2011 compared<br />
to the premium paid for the annuity itself, led to a substantial increase in the allocation fund for liability<br />
to damages caused by products compared to previous year.<br />
Total payables and provisions for non-recurring transactions at 31 December <strong>2012</strong> amount to 29.4<br />
million euro (27.0 million euro) and the cash flow absorbed by them was 18.3 million euro (positive by<br />
8.0 million euro).<br />
173
Separate financial statements at 31 December <strong>2012</strong> – Notes<br />
7.14 Deferred tax<br />
liabilities<br />
Deferred tax liabilities (IRES rate 27.5%, average IRAP rate 4.2%) are analyzed in the following table. They<br />
are stated net of the deferred tax assets, as mentioned in note 7.5.<br />
Statement deferred taxes<br />
(million euro) 2011 IRES 2011 IRAP<br />
Changes<br />
IRES<br />
IRAP <strong>2012</strong> IRES <strong>2012</strong> IRAP<br />
Deferred tax liabilities<br />
Dividends (12.1) - (0.0) - (12.1) -<br />
Changes in severance indemnities (2.2) - 0.2 - (2.1) -<br />
Leased goods (1.8) (0.4) 0.6 0.0 (1.2) (0.4)<br />
Total (16.2) (0.4) 0.7 0.0 (15.4) (0.4)<br />
Effect of reducing Ires and Irap rates - - - -<br />
Deferred tax assets<br />
Entertainment expenses - - 0.0 (0.0) - (0.0)<br />
Remuneration to directors and employees 0.9 - 0.1 - 1.0 -<br />
Impairment losses on receivables 3.2 - 0.4 - 3.6 -<br />
Other provisions for risks 12.8 0.8 (0.6) (0.2) 12.2 0.6<br />
Provisions for warranties 1.7 0.3 (0.1) 0.0 1.6 0.3<br />
Intangible assets and goodwill 0.3 0.0 (0.3) (0.0) 0.0 0.0<br />
Tax losses carried forward 17.3 - 8.2 - 25.5 -<br />
Cash flow hedging reserve 3.2 - 0.2 0.0 3.4 -<br />
Total 39.5 1.1 7.8 (0.2) 47.3 0.9<br />
Effect of reducing Ires and Irap rates - - - -<br />
Deferred tax assets and liabilities 23.3 0.7 8.5 (0.2) 31.8 0.6<br />
Balance 24.0 8.3 32.4<br />
174
Separate financial statements at 31 December <strong>2012</strong> – Notes<br />
The net deferred tax assets relating to IRES amount to about 32.4 million euro at 31 December <strong>2012</strong>,<br />
following a net change of about 8.5 million euro with respect to the prior year. This balance mainly<br />
reflects the deferred taxes calculated on temporary differences arising in relation to provisions for risks<br />
and carried forward tax losses.<br />
The change in deferred tax assets includes 0.2 million euro reflected in equity reserves in relation to the<br />
change in the cash flow hedge.<br />
The net deferred tax assets relating to IRAP amount to about 0.6 million euro. This balance mainly<br />
reflects the deferred taxes calculated on temporary differences arising in relation to the provisions for<br />
risks and charges.<br />
Deferred tax assets and liabilities have been recognised in relation to all significant temporary<br />
differences.<br />
7.15 Other<br />
non-current<br />
liabilities<br />
Other non-current liabilities comprise deferred grants from the government and other entities of 2.7<br />
million euro (3.5 million euro) and the deferred bonuses of directors and employees amounting to 9.0<br />
million euro (9.5 million euro), together with the related social security contributions and charges of 3.0<br />
million euro (2.7 million euro).<br />
Deferred grants from the government and other entities comprise grants for planned investment by<br />
“Distretto dell’Elettrodomestico Società Consortile arl” and for the Albacina factory (Law 488/92).<br />
These grants are subject to restrictions that are currently respected.<br />
7.16 Trade payables<br />
Trade payables comprise all the amounts due for the purchase of goods and services from the<br />
Company’s suppliers. All payables fall due within one year. No amounts have been discounted. The<br />
amounts due to suppliers reported among trade payables comprise without distinction the amounts<br />
due to both suppliers of raw materials and suppliers of fixed assets.<br />
Trade payables amount to 389.6 million euro (400.2 million euro).<br />
175
Separate financial statements at 31 December <strong>2012</strong> – Notes<br />
Certain payables are due to subsidiaries, as shown in the following table.<br />
(million euro) 31.12.<strong>2012</strong> 31.12.2011<br />
Trade payables due to subsidiaries<br />
<strong>Indesit</strong> Company Polska Sp.zo.o. 42.0 36.4<br />
<strong>Indesit</strong> Company International Business S.A. 0.8 0.7<br />
<strong>Indesit</strong> Company UK Ltd. 8.3 10.8<br />
<strong>Indesit</strong> Company International B.V. 0.0 0.1<br />
<strong>Indesit</strong> Company Portugal Electrodomésticos S.A. 0.3 0.4<br />
<strong>Indesit</strong> Electrodomesticos S.A. 0.1 0.1<br />
<strong>Indesit</strong> Company France S.A. 0.9 0.8<br />
<strong>Indesit</strong> Company Beyaz Esya Pazarlama A.S. 13.8 10.3<br />
<strong>Indesit</strong> Company Beyaz Esya Sanayi ve Ticaret A.S. 0.2 0.2<br />
<strong>Indesit</strong> Company Deutschland GmbH 2.1 0.8<br />
<strong>Indesit</strong> Company Appliances Hellas Mepe 0.3 0.4<br />
<strong>Indesit</strong> Company Bulgaria Ltd. 0.2 0.3<br />
<strong>Indesit</strong> Company Norge Ltd. 0.2 0.5<br />
<strong>Indesit</strong> Osterreich GmbH 2.1 1.7<br />
<strong>Indesit</strong> Company IP S.r.l. 0.0 (0.0)<br />
Aeradriatica S.p.A. 0.8 0.7<br />
Wuxi <strong>Indesit</strong> Home Appliance Co. Ltd. - -<br />
Wuxi <strong>Indesit</strong> Domestic Appliance Technology Co. Ltd. - -<br />
<strong>Indesit</strong> Company Luxembourg S.A. 0.2 0.2<br />
<strong>Indesit</strong> Company Magyarország Kft - 0.0<br />
Closed Joint Stock Company <strong>Indesit</strong> International 0.0 0.0<br />
<strong>Indesit</strong> Company Nordics A.B. 0.3 -<br />
<strong>Indesit</strong> Company Rus Ltd. 0.0 0.1<br />
Total subsidiaries 72.7 64.7<br />
With reference to the analysis by geographical area, trade payables (excluding the above amounts due<br />
to subsidiaries) include 144.3 million euro (154.1 million euro) due to Italian suppliers and 36.8 million<br />
euro (34.3 million euro) due to foreign suppliers. The residual amount mainly relates to invoices and<br />
credit notes to be received.<br />
176
Separate financial statements at 31 December <strong>2012</strong> – Notes<br />
7.17 Tax payables<br />
The amounts due to tax authorities comprise the liability for current taxes and other tax payables. The<br />
situation is analyzed in the following table.<br />
(million euro) 31.12.<strong>2012</strong> 31.12.2011<br />
Withholding taxes on employees 7.9 7.8<br />
Withholding taxes on consultants 0.3 0.3<br />
Other taxes 0.0 4.4<br />
Total 8.3 12.5<br />
7.18 Other payables<br />
Other payables are analyzed as follows:<br />
(million euro) 31.12.<strong>2012</strong> 31.12.2011<br />
Due to social security and pension institutions 17.8 19.1<br />
Due to employees 24.8 24.7<br />
Due to pension funds 1.9 1.8<br />
VAT payable 0.5 0.5<br />
Other 3.1 1.0<br />
Total 48.0 46.9<br />
7.19 Share-based<br />
payments<br />
(stock options)<br />
Stock option plan<br />
for Group executives<br />
and managers<br />
The resolutions adopted at the extraordinary meetings held on 19 September 1998 and 23 October<br />
2001 authorized, pursuant to art. 2441 of the Italian Civil Code, two increases in share capital by up<br />
to 2,700,000 euro each, via the issue of a combined maximum of 6,000,000 ordinary shares, par value<br />
euro 0.90, to service the stock option plan for the Group’s executives and managers. The Board of<br />
Directors, in the person of the Chairman, determines the number of options to be granted each year<br />
and identifies - on the recommendation of the Chief Executive Officer - the beneficiaries. The options<br />
granted on 24 July 2003 (last grant date) envisage a vesting period of 3 years for the first 50% and 4<br />
years for the remaining 50%, while the options granted previously envisaged vesting periods of 2 years<br />
and 3 years respectively.<br />
105.000 stock options expired during <strong>2012</strong>. No new plans were authorized during the year and no<br />
stock options were granted.<br />
The parameters used to determine the fair value of stock options at the grant date are set out in the<br />
following table.<br />
Exercise price 12.65<br />
Expected volatility 31.39%<br />
Grant date 24.07.2003<br />
No. options 169,500.00<br />
Duration of options (years) 3.50<br />
Expected dividends 2.97%<br />
Risk-free interest rate 4.00%<br />
Fair value stock option (million euro) 0.10<br />
177
Separate financial statements at 31 December <strong>2012</strong> – Notes<br />
8. Notes to the separate cash flow statement<br />
8.1 Profit for<br />
the year,<br />
Income taxes,<br />
Impairment<br />
losses on<br />
investments<br />
and other<br />
financial assets,<br />
depreciation and<br />
amortisation,<br />
Income taxes<br />
Profit for the year, income taxes, impairment losses on equity investments and financial assets and<br />
depreciation and amortisation, all non-monetary items, are reported directly on the face of the income<br />
statement, which is analyzed elsewhere.<br />
While the recovery of taxation recognized for <strong>2012</strong> amounted to 0.2 million euro (provision of<br />
16.7 million euro), tax payments of 10.9 million euro (9.3 million euro) have been made.<br />
8.2 Other<br />
non-monetary<br />
expenses, net,<br />
interest paid<br />
and received<br />
The other non-monetary income and expenses, net, comprise all non-monetary items recognised in<br />
the income statement, except for income taxes, depreciation and amortisation and the provisions<br />
deducted directly from asset accounts (allowance for doubtful accounts and provisions for<br />
obsolescence). The interest received and paid, reported separately, was essentially the same as the<br />
amounts recognised in the income statement.<br />
This caption also includes dividends from equity investments.<br />
8.3 Change in trade<br />
receivables,<br />
inventories, trade<br />
payables<br />
This caption reports the cash from or used in the changes in net working capital, which comprises<br />
trade receivables, inventories and trade payables. The changes in trade payables relate solely to the<br />
supply of raw materials, goods and services, and exclude the changes in amounts due to suppliers of<br />
property, plant and equipment (decrease of 3.7 million euro), which are classified in the section of the<br />
cash flow statement that reports the cash flows generated (absorbed) by investing activities.<br />
8.4 Change in other<br />
assets and<br />
liabilities<br />
This caption reports the change in all other current and non-current assets and liabilities, net of the<br />
effect on them of provisions for non-monetary costs and income. This represents the changes with a<br />
direct effect on the absorption or generation of cash.<br />
8.5 Acquisition of<br />
property, plant<br />
and equipment<br />
and Proceeds<br />
from sale of<br />
property, plant<br />
and equipment<br />
The cash flows from additions to property, plant and equipment reflects the routine replacement of<br />
assets, as analyzed in note 7.1. It also includes the change in amounts due to the suppliers of fixed<br />
assets.<br />
178
Separate financial statements at 31 December <strong>2012</strong> – Notes<br />
8.6 Acquisition<br />
of intangible<br />
assets and<br />
Proceeds from<br />
sale of intangible<br />
assets<br />
The cash flows from investments in intangible assets relate both to the purchase of licences and<br />
software, and to development costs, which are analyzed in note 7.2.<br />
The cash flows from/used in investing activities include the amounts capitalized since these involve<br />
payments for the related internal costs incurred (mainly payroll). These payments essentially reflect the<br />
costs capitalized during the year.<br />
8.7 Acquisition<br />
of non-current<br />
financial assets<br />
and Proceeds<br />
from sale of<br />
non-current<br />
financial assets<br />
The investments in non-current financial assets mainly relate to the payments on capital account made<br />
to <strong>Indesit</strong> Company Electrodomesticos, <strong>Indesit</strong> Company Polska Sp.zo.o. and <strong>Indesit</strong> Company UK<br />
Holdings Ltd.<br />
8.8 Change in<br />
hedging reserve<br />
on derivatives<br />
and Dividends<br />
paid<br />
The change in the hedging reserve reflects the effect of remeasuring the derivatives recognized on a<br />
hedge accounting basis. Dividend payments amounted to 23.7 million euro in <strong>2012</strong> (see note 7.10).<br />
8.9 Dividends<br />
received<br />
The dividends collected were received from subsidiaries during <strong>2012</strong>, as analyzed in note 6.10.<br />
8.10 New and<br />
repayments<br />
short/medium/<br />
long-term loans<br />
and borrowings<br />
The arrangement and repayment of medium/long-term loans and borrowings relates to the<br />
repayment in <strong>2012</strong> of intercompany loans granted to subsidiaries.<br />
8.11 Change in short,<br />
medium and<br />
long-term<br />
financial<br />
liabilities/assets<br />
The change in current loans and borrowing includes the change in short-term loans and borrowings<br />
since this represents a technical form of short-term borrowing.<br />
179
Separate financial statements at 31 December <strong>2012</strong> – Notes<br />
9. Financial instruments<br />
9.1 Management<br />
of financial risks<br />
<strong>Indesit</strong> Company S.p.A. manages its principal financial risks in accordance with the guidelines set out in<br />
the Treasury Policy approved by the Board of Directors.<br />
A detailed analysis of the policies and practices adopted for the management of financial risks is<br />
presented in the notes to the consolidated financial statements, together with the other information<br />
required by IFRS 7.<br />
The following information is presented with regard to <strong>Indesit</strong> Company S.p.A.: information on the<br />
transactions outstanding as of 31 December <strong>2012</strong>, the carrying amount of the financial assets and<br />
liabilities recognised in the statement of financial position, for each of the categories identified in IAS<br />
39, the analysis of financial payables by maturity, and certain quantitative (sensitivity) information about<br />
interest-rate risk.<br />
With regard to exchange-rate risk, there are no significant exposures in currencies other than the euro.<br />
Interest-rate risk:<br />
sensitivity<br />
A hypothetical upward shift in the interest-rate curve by 100 basis points or downward shift by 20 basis<br />
points (in parallel along the entire curve) would have the effects indicated below.<br />
The simulation is representative of the effects deriving from the exposures to risk at 31 December <strong>2012</strong>,<br />
or from the normalized average exposures in the limited cases in which the situation at year end was<br />
not representative of that applying throughout the year.<br />
31 December <strong>2012</strong><br />
Variation +100bps<br />
Variation -20bps<br />
(million euro)<br />
P&L effect Equity effect P&L effect Equity effect<br />
Net indebtedness at floating rate (3.8) 0.0 n.a. n.a.<br />
Derivative instruments hedging fixed rate loans - - n.a. n.a.<br />
Derivative instruments hedging floating rate loans 1.9 2.5 n.a. n.a.<br />
Total (1.9) 2.5 n.a. n.a.<br />
31 December 2011<br />
Variation +100bps<br />
Variation -20bps<br />
(million euro)<br />
P&L effect Equity effect P&L effect Equity effect<br />
Net indebtedness at floating rate (3.7) 0.1 0.7 (0.0)<br />
Derivative instruments hedging fixed rate loans - - - -<br />
Derivative instruments hedging floating rate loans - 5.9 - (1.2)<br />
Total (3.7) 6.0 0.7 (1.2)<br />
180
Separate financial statements at 31 December <strong>2012</strong> – Notes<br />
Hierarchy of levels<br />
in the measurement<br />
of fair value<br />
With regard to financial instruments recognized at fair value in the statement of financial position, IFRS<br />
7 requires such values to be classified using a hierarchy of levels that reflect the meaningfulness of the<br />
input used for the determination of fair value. The following levels are identified:<br />
• Level 1 - prices quoted in an active market for the asset or liability to be measured;<br />
• Level 2 - input other than the quoted prices referred to above, which is directly (prices) or indirectly<br />
(derived from the prices) observable in the market;<br />
• Level 3 - input that is not based on observable market data.<br />
With regard to the derivative instruments outstanding at 31 December <strong>2012</strong>:<br />
• all the financial instruments measured at fair value are represented by Level 2 derivatives (same as<br />
in 2011);<br />
• there were no transfers from Level 1 to Level 2, or vice versa, during <strong>2012</strong>;<br />
• there were also no transfers from Level 3 to other levels, or vice versa, during <strong>2012</strong>.<br />
9.2 Categories<br />
of financial<br />
asset/liability<br />
The following tables present, for each of the categories identified in IAS 39, the carrying amount and<br />
corresponding fair value of the financial assets and liabilities recognised in the statement of financial<br />
position.<br />
31 December <strong>2012</strong><br />
(million euro)<br />
Loans and<br />
receivables<br />
Financial assets<br />
measured at fair value<br />
through profit or loss<br />
Financial<br />
assets<br />
measured<br />
at fair value<br />
upon initial<br />
recognition<br />
Financial<br />
assets held<br />
for trading<br />
Financial<br />
assets<br />
available<br />
for sale<br />
Financial<br />
assets held<br />
to maturity<br />
Hedging<br />
instruments<br />
Total<br />
carrying<br />
amount<br />
Total<br />
fair value<br />
Non-current financial assets 0.4 - - - - - 0.4 0.4<br />
Trade receivables 418.3 - - - - - 418.3 418.3<br />
Current financial assets 37.3 - - - - - 37.3 37.3<br />
Cash and cash equivalents 10.2 - - - - - 10.2 10.2<br />
Total 466.3 - - - - - 466.3 466.3<br />
31 December 2011<br />
(million euro)<br />
Loans and<br />
receivables<br />
Financial assets<br />
measured at fair value<br />
through profit or loss<br />
Financial<br />
assets<br />
measured<br />
at fair value<br />
upon initial<br />
recognition<br />
Financial<br />
assets held<br />
for trading<br />
Financial<br />
assets<br />
available<br />
for sale<br />
Financial<br />
assets held<br />
to maturity<br />
Hedging<br />
instruments<br />
Total<br />
carrying<br />
amount<br />
Total<br />
fair value<br />
Non-current financial assets 50.0 - - - - - 50.0 50.0<br />
Trade receivables 406.0 - - - - - 406.0 406.0<br />
Current financial assets 137.5 - - - - - 137.5 137.5<br />
Cash and cash equivalents 9.1 - - - - - 9.1 9.1<br />
Total 602.6 - - - - - 602.6 602.6<br />
181
Separate financial statements at 31 December <strong>2012</strong> – Notes<br />
31.12.<strong>2012</strong><br />
(million euro)<br />
Financial liabilities<br />
measured at fair value<br />
through profit or loss<br />
Financial<br />
liabilities<br />
measured<br />
at fair value<br />
upon initial<br />
recognition<br />
Financial<br />
liability held<br />
for trading<br />
Other<br />
financial<br />
liabilities<br />
held to<br />
maturity<br />
Hedging<br />
instruments<br />
Total<br />
carrying<br />
amount<br />
Total<br />
fair value<br />
Medium/long-term financial liabilities - - 225.4 7.0 232.4 232.4<br />
Trade payables - - 391.6 - 391.6 391.6<br />
Banks and other short-term financial liabilities - - 227.7 5.5 233.3 233.3<br />
Total - - 844.7 12.5 857.3 857.3<br />
31.12.2011<br />
(million euro)<br />
Financial liabilities<br />
measured at fair value<br />
through profit or loss<br />
Financial<br />
liabilities<br />
measured<br />
at fair value<br />
upon initial<br />
recognition<br />
Financial<br />
liability held<br />
for trading<br />
Other<br />
financial<br />
liabilities<br />
held to<br />
maturity<br />
Hedging<br />
instruments<br />
Total<br />
carrying<br />
amount<br />
Total<br />
fair value<br />
Medium/long-term financial liabilities - - 239.7 8.4 248.1 248.1<br />
Trade payables - - 400.2 - 400.2 400.2<br />
Banks and other short-term financial liabilities - - 178.2 3.2 181.4 181.4<br />
Total - - 818.1 11.6 829.7 829.7<br />
182
Separate financial statements at 31 December <strong>2012</strong> – Notes<br />
Analysis of financial<br />
liabilities by maturity<br />
The following table analyzes financial liabilities and trade payables by maturity.<br />
(million euro)<br />
Carring<br />
amount<br />
31.12.<strong>2012</strong><br />
Contractual<br />
cash flows<br />
Within<br />
1 month<br />
Between<br />
1 and 3<br />
months<br />
Between<br />
3 and 12<br />
months<br />
Between<br />
1 and 5<br />
years<br />
Beyond<br />
5 years<br />
Trade payables (391.6) (391.6) (76.2) (222.9) (92.4) 0.0 0.0<br />
Due to banks (225.1) (203.3) (120.0) 0.0 (17.7) (53.0) (12.7)<br />
Other financial payables (228.1) (234.4) 0.0 (64.5) (2.1) (167.5) (0.3)<br />
Derivatives (12.5) (12.5) (0.5) (0.9) (4.2) (7.0) 0.0<br />
Total (857.3) (841.7) (196.7) (288.4) (116.3) (227.4) (12.9)<br />
(million euro)<br />
Carring<br />
amount<br />
31.12.2011<br />
Contractual<br />
cash flows<br />
Within<br />
1 month<br />
Between<br />
1 and 3<br />
months<br />
Between<br />
3 and 12<br />
months<br />
Between<br />
1 and 5<br />
years<br />
Beyond<br />
5 years<br />
Trade payables (400.2) (400.2) (87.6) (155.0) (157.7) 0.0 0.0<br />
Due to banks (194.2) (172.7) (75.3) (9.0) (6.2) (56.5) (25.8)<br />
Other financial payables (223.7) (238.7) 0.0 (59.6) (3.6) (174.4) (1.1)<br />
Derivatives (11.6) (11.7) 0.0 0.0 (3.2) (8.5) 0.0<br />
Total (829.7) (823.4) (162.8) (223.6) (170.7) (239.5) (26.8)<br />
9.3 Derivative<br />
financial<br />
instruments<br />
outstanding<br />
at year end<br />
The derivatives outstanding at 31 December <strong>2012</strong> comprise an IRS with a total notional of 350.0 million<br />
euro. This hedges the interest-rate risk on an average of about 200 million euro of underlying payables<br />
(short term) with the following maturities:<br />
• 150 million euro from 17 March <strong>2012</strong> to 17 March 2014;<br />
• 150 million euro from 17 March 2014 to 17 March 2015;<br />
• 50 million euro from 17 March <strong>2012</strong> to 17 March 2015.<br />
183
Separate financial statements at 31 December <strong>2012</strong> – Notes<br />
Notional amount<br />
Fair value of derivatives<br />
(million euro) Nature of risk hedged<br />
31.12.<strong>2012</strong> 31.12.2011 31.12.<strong>2012</strong> 31.12.2011<br />
Cash flow hedges<br />
IRS on short-term borrowings Interest rate 350.0 350.0 (12.5) (11.6)<br />
Total 350.0 350.0 (12.5) (11.6)<br />
10. Information required by IAS 24 on the remuneration of management<br />
and on related parties<br />
10.1 Remuneration<br />
of management<br />
In addition to the executive and non-executive directors and the statutory auditors, from <strong>2012</strong> there<br />
are now 7 managers with strategic responsibility for operations, planning and control (5 through 2011).<br />
These are the Administration, Finance and Control Manager, the Manager of the Home Care Division,<br />
the Manager of the Food Treatment Division, the Manager of the Services & Consumer Care Division,<br />
the Sales Manager, the Human Resources Manager and the Supply Chain and IT Manager.<br />
The table below lists the expected gross remuneration of the above persons for <strong>2012</strong>, comprising all<br />
forms of compensation (gross pay, bonuses, fringe benefits etc.), and the bonuses accrued but not yet<br />
paid, since subject to the achievement of annual objectives and continued employment by the Group<br />
at the vesting date.<br />
Remuneration and annual fees for the year <strong>2012</strong> due to directors, statutory auditors<br />
and executives<br />
(million euro)<br />
Short-term<br />
benefits<br />
Long-term<br />
benefits<br />
Stock<br />
options<br />
Directors 4.6 1.2 -<br />
Statutory Auditors 0.2 - -<br />
Executives 4.5 2.2 -<br />
Total 9.2 3.4 -<br />
Remuneration and annual fees for the year 2011 due to directors, statutory auditors<br />
and executives<br />
(million euro)<br />
Short-term<br />
benefits<br />
Long-term<br />
benefits<br />
Stock<br />
options<br />
Directors 4.0 1.3 -<br />
Statutory Auditors 0.2 - -<br />
Executives 3.1 1.9 -<br />
Total 7.2 3.3 -<br />
184
Separate financial statements at 31 December <strong>2012</strong> – Notes<br />
Change in<br />
fair value of<br />
derivatives at<br />
31.12.<strong>2012</strong><br />
vs 31.12.2011<br />
Change in<br />
fair value of<br />
underlyings at<br />
31.12.<strong>2012</strong><br />
vs 31.12.2011<br />
Change in<br />
fair value of<br />
underlyings at<br />
31.12.<strong>2012</strong><br />
vs inception<br />
date<br />
Change in<br />
fair value of<br />
derivatives at<br />
31.12.2011<br />
vs inception<br />
date<br />
Other noncurrent<br />
financial<br />
assets<br />
Current<br />
financial<br />
assets<br />
31 December <strong>2012</strong><br />
Medium/<br />
long-term<br />
loans and<br />
borrowings<br />
Banks<br />
and other<br />
financial<br />
liabilities<br />
Total<br />
(0.9) n.a. n.a. n.a. - - (7.0) (5.5) (12.5)<br />
(0.9) - - - - - (7.0) (5.5) (12.5)<br />
10.2 List of related<br />
parties<br />
The list of companies (other than subsidiaries) deemed to be related parties pursuant to IAS 24 is<br />
presented below. All commercial and financial transactions with these entities were arranged on an<br />
arms’ length basis and in the interests of the Company.<br />
List of related parties<br />
Cine District Entertainment S.r.l.<br />
Faber Factor S.r.l. in liquidation<br />
Fineldo S.p.A.<br />
Immobiliare Fineldo S.r.l.<br />
Merloni Progetti S.p.A.<br />
M P & S S.r.l.<br />
Solar COOL S.r.l.<br />
Solar STOCK S.r.l.<br />
Solar WASH S.r.l.<br />
Tecnosolare Carinaro S.r.l.<br />
TM NEWS S.p.A.<br />
Tradeplace B.V.<br />
<strong>Indesit</strong> Company UK Ltd. Group<br />
Personal Pension Plan<br />
Merloni Ireland Pension Plan<br />
Type of relationship<br />
Other related - Related to a member of the Board of Directors of Fineldo<br />
Other related - Controlled by Fineldo S.p.A., Group parent of <strong>Indesit</strong> company<br />
Group Parent belonging to Vittorio Merloni<br />
Other related - Controlled by Fineldo S.p.A., Group parent of <strong>Indesit</strong> company<br />
Other related - Controlled by Fineldo S.p.A., Group parent of <strong>Indesit</strong> company<br />
Other related - Related to a member of the Merloni family<br />
Other related - Controlled by Fineldo S.p.A., Group parent of <strong>Indesit</strong> company<br />
Other related - Controlled by Fineldo S.p.A., Group parent of <strong>Indesit</strong> company<br />
Other related - Controlled by Fineldo S.p.A., Group parent of <strong>Indesit</strong> company<br />
Other related - Controlled by Fineldo S.p.A., Group parent of <strong>Indesit</strong> company<br />
Other related - Related to a member of the Board of Directors of <strong>Indesit</strong><br />
Associate<br />
Pension fund<br />
Pension fund<br />
In addition to the above companies, certain natural persons are also deemed to be related parties:<br />
members of the Board of Directors and the Board of Statutory Auditors, managers with strategic<br />
responsibility for management, planning and control activities, and the close family members of one<br />
these parties, as defined in IAS 24. Their names are not listed.<br />
Information about subsidiaries is provided in note 7.4 and in the attachments to the financial<br />
statements.<br />
185
Separate financial statements at 31 December <strong>2012</strong> – Notes<br />
Nature of relations<br />
with the principal<br />
related parties<br />
The Merloni Progetti Group<br />
The Merloni Progetti Group has leased property to <strong>Indesit</strong> Company and, in turn, is recharged for the<br />
provision of general services.<br />
<strong>Indesit</strong> Company UK Ltd. Group Personal Pension Plan and Merloni Ireland Pension Plan<br />
<strong>Indesit</strong> Company UK Ltd., a subsidiary, and the employees concerned contribute to the <strong>Indesit</strong><br />
Company UK Ltd. Group Personal Pension Plan and the Merloni Ireland Pension Plan under the pension<br />
rules applicable in the UK. Further information about the pension plans is provided in note 9.14 to the<br />
consolidated financial statements.<br />
10.3 Schedules<br />
summarizing<br />
the transactions<br />
with related<br />
parties<br />
The table on the next page summarises the balances and transactions with the related parties<br />
identified above, distinguishing between the transactions with subsidiaries, the Parent, associates and<br />
other related parties.<br />
Furthermore, in accordance with Consob Resolution no. 15519 dated 27 July 2006 and Consob<br />
Communication DEM/6064293 dated 28 July 2006, Attachments 2 and 3 present the income statement<br />
and statement of financial position showing the transactions with related parties separately and<br />
indicating their percentage incidence with respect to each account caption.<br />
186
Separate financial statements at 31 December <strong>2012</strong> – Notes<br />
There have not been any atypical and/or unusual transactions with related parties.<br />
(million euro) <strong>2012</strong> 2011<br />
Revenue from sales and services<br />
Subsidiaries 582.2 620.8<br />
Total 582.2 620.8<br />
Other income and expenses<br />
Subsidiaries 77.0 64.1<br />
Total 77.0 64.1<br />
Purchase of raw materials, services and costs for utilization of third party assets<br />
Subsidiaries (161.8) (153.6)<br />
Other related parties (0.6) (0.6)<br />
Parent 0.0 0.0<br />
Total (162.3) (154.2)<br />
Payroll costs<br />
Subsidiaries 2.4 2.1<br />
Other related parties (12.6) (10.5)<br />
Parent 0.3 0.3<br />
Total (9.8) (8.0)<br />
Provisions and other expenses<br />
Other related parties (0.2) (0.3)<br />
Total (0.2) (0.3)<br />
Financial income and expenses<br />
Subsidiaries 101.0 45.2<br />
Parent 0.0 0.0<br />
Total 101.0 45.2<br />
187
Separate financial statements at 31 December <strong>2012</strong> – Notes<br />
(million euro) 31.12.<strong>2012</strong> 31.12.2011<br />
Property, plant and equipment<br />
Other related parties 0.0 0.0<br />
Total 0.0 0.0<br />
Non-current assets<br />
Subsidiaries 0.0 50.0<br />
Total 0.0 50.0<br />
Trade receivables<br />
Subsidiaries 275.7 261.8<br />
Other related parties 0.3 2.4<br />
Parent 2.6 0.2<br />
Total 278.6 264.4<br />
Current financial assets<br />
Subsidiaries 29.3 129.3<br />
Total 29.3 129.3<br />
Medium and long-term interest-bearing loans and borrowings<br />
Subsidiaries 169.1 170.5<br />
Total 169.1 170.5<br />
Banks and other loans and borrowings<br />
Subsidiaries 69.2 61.2<br />
Total 69.2 61.2<br />
Trade payables<br />
Subsidiaries 72.7 64.7<br />
Other related parties 0.0 0.1<br />
Parent 0.2 0.0<br />
Total 72.9 64.8<br />
The cash generated by related-party transactions totaled 0.1 million euro (0.5 million euro) and mainly<br />
arose from sales made to subsidiaries.<br />
188
Separate financial statements at 31 December <strong>2012</strong> – Attachments<br />
Attachments<br />
Attachment 1<br />
List of direct and indirect<br />
companies<br />
Group interest (in %)<br />
Name Location Share capital Direct Indirect<br />
<strong>Indesit</strong> Company Luxembourg S.A. Luxembourg EUR 117,977,729 100.00 -<br />
<strong>Indesit</strong> Electrodomesticos S.A. Spain EUR 1,000,000 78.95 21.05<br />
Merloni Domestic Appliances Ltd. UK GBP 90,175,500 19.60 80.40<br />
<strong>Indesit</strong> Company Portugal Electrodomésticos S.A. Portugal EUR 1,144,100 - 99.44<br />
<strong>Indesit</strong> Company International B.v. The Netherlands EUR 272,270 - 100.00<br />
<strong>Indesit</strong> Company France S.A. France EUR 17,000,000 - 100.00<br />
Fabrica Portugal S.A. Portugal EUR 11,250,000 - 96.40<br />
<strong>Indesit</strong> Company Beyaz Esya Sanayi ve Ticaret A.S. Turkey TRY 134,038,073 36.16 63.84<br />
<strong>Indesit</strong> Company Beyaz Esya Pazarlama A.S. Turkey TRY 5,167,994 100.00 -<br />
<strong>Indesit</strong> IP S.r.l. Italy EUR 10,000 100.00<br />
<strong>Indesit</strong> Company Deutschland GmbH Germany EUR 550,000 - 100.00<br />
Closed Joint Stock Company <strong>Indesit</strong> International ZAO Russia RUB 1,664,165,000 100.00 -<br />
<strong>Indesit</strong> Company Polska Sp.zo.o. Poland PLN 540,876,500 100.00 -<br />
<strong>Indesit</strong> Company Magyarország Kft Hungary HUF 25,000,000 - 100.00<br />
<strong>Indesit</strong> Company Ceská S.r.o. Czech Republic CZK 1,000,000 100.00 -<br />
<strong>Indesit</strong> Company International Business S.A. Switzerland SFR 250,000 - 100.00<br />
<strong>Indesit</strong> Company UK Holdings Ltd. UK EUR 163,000,000 38.65 61.35<br />
General Domestic Appliances Holdings Ltd. UK GBP 26,000,000 - 100.00<br />
Aeradriatica S.p.A. Italy EUR 23,068,545 100.00 -<br />
Airdum Ltd. UK GBP 15,000 - 100.00<br />
Cannon Industries Ltd. UK GBP 1.5 - 100.00<br />
General Domestic Appliances International Ltd. UK GBP 100,000 - 100.00<br />
Jackson Appliances Ltd. UK GBP 7.5 - 100.00<br />
<strong>Indesit</strong> Company UK Ltd. UK GBP 76,195,645 - 100.00<br />
Xpelair Ltd. UK GBP 8.25 - 100.00<br />
Wuxi <strong>Indesit</strong> Domestic Appliance Technology Co. Ltd. China EUR 900,000 - 100.00<br />
<strong>Indesit</strong> Company Belgium S.A. Belgium EUR 150,000 - 100.00<br />
<strong>Indesit</strong> Argentina S.A. Argentina ARS 24,070,220 3.00 97.00<br />
<strong>Indesit</strong> Middle East FZE UAE AED 1,000,000 - 100.00<br />
<strong>Indesit</strong> Rus Llc Russia RUB 4,340,000 100.00 -<br />
<strong>Indesit</strong> Company Österreich GmbH Österreich EUR 18,168.21 - 100.00<br />
<strong>Indesit</strong> Ireland Ltd. Ireland EUR 100,000 - 100.00<br />
<strong>Indesit</strong> Company Bulgaria S.r.l.u. Bulgary BGL 7,805,000 100.00 -<br />
<strong>Indesit</strong> Company Domestic Appliances Hellas Mepe Greece EUR 18,000 - 100.00<br />
<strong>Indesit</strong> Company Norge Ltd. Norway NOK 100,000 - 100.00<br />
<strong>Indesit</strong> Company Singapore Pte. Ltd. Singapore SGD 100,000 - 100.00<br />
<strong>Indesit</strong> Ukraine LLC Ukraine UAH 11,234,634 100.00 -<br />
Tradeplace B.V. The Netherlands EUR 30,000 20.00 -<br />
<strong>Indesit</strong> Company Nordics A.B. Sweden SEK 50,000 100.00<br />
Note<br />
189
Separate financial statements at 31 December <strong>2012</strong> – Attachments<br />
Attachment 2<br />
Separate income statement for<br />
the year ended 31 December <strong>2012</strong>,<br />
prepared in accordance with Consob<br />
Resolution no. 15519 dated 27 July<br />
2006 and Consob Communication no.<br />
DEM/6064293 dated 28 July 2006<br />
<strong>2012</strong> 2011<br />
(million euro)<br />
Balances<br />
Of which<br />
nonrecurring<br />
Of which<br />
with related<br />
parties Balances<br />
Of which<br />
nonrecurring<br />
Of which<br />
with related<br />
parties<br />
Revenue from sales and services 1,017.5 - 582.2 1,108.1 - 620.8<br />
Change in work in progress, semi-finished<br />
and finished products (12.6) (1.9) - 0.8 - -<br />
Other revenue and income 100.9 - 77.0 91.1 0.3 64.1<br />
Purchase of raw materials, services and leases<br />
and rentals (838.4) (0.5) (162.3) (921.3) (2.1) (154.2)<br />
Payroll costs (206.7) (0.7) (9.8) (212.7) (2.8) (8.0)<br />
Depreciation, amortisation and impairment losses (59.0) (0.5) - (59.3) - -<br />
Change in raw materials, components and<br />
consumables (4.7) - - 0.2 - -<br />
Provisions and other operating expenses (28.2) (12.4) (0.2) (10.4) 1.3 (0.3)<br />
Operating profit (31.2) (15.9) 486.7 (3.5) (3.4) 522.4<br />
Dividends from subsidiaries, associates and others 109.2 - 109.2 51.0 - 51.0<br />
Interest income from subsidiaries and associates 1.9 - 1.9 2.8 - 2.8<br />
Interest income from third parties 0.0 - - - - -<br />
Interest expenses from subsidiaries and associates (10.1) - (10.1) (8.6) - (8.6)<br />
Interest expenses from third parties and Parent (15.0) - - (13.2) - -<br />
Exchange rate differences 0.1 - - (0.4) - -<br />
Reversal of impairment losses on investments 0.0 - - - - -<br />
Impairment losses on investments (9.2) - - (0.9) - -<br />
Net financial income and expenses 76.9 - 101.0 30.7 - 45.2<br />
Profit before tax 45.7 (15.9) 600.3 27.2 (3.4) 567.6<br />
Income tax expense 0.2 - - (16.7) 1.0 -<br />
Profit for the year 45.9 (15.9) 600.3 10.4 (2.4) 567.6<br />
190
Separate financial statements at 31 December <strong>2012</strong> – Attachments<br />
Weight % of single items<br />
Balances<br />
<strong>2012</strong> 2011<br />
Of which<br />
nonrecurring<br />
Of which<br />
with related<br />
parties<br />
Balances<br />
Of which<br />
nonrecurring<br />
Of which<br />
with related<br />
parties<br />
Revenue from sales and services 100% - 57.2% 100% - 56.0%<br />
Change in work in progress, semi-finished<br />
and finished products 100% 14.7% - 100% - -<br />
Other revenue and income 100% - 76.2% 100% 0.3% 70.4%<br />
Purchase of raw materials, services and leases<br />
and rentals 100% 0.1% 19.4% 100% 0.2% 16.7%<br />
Payroll costs 100% 0.3% -1.3% 100% 1.3% 3.8%<br />
Depreciation, amortisation and impairment losses 100% 0.8% - 100% - -<br />
Change in raw materials, components and<br />
consumables 100% - - 100% - -<br />
Provisions and other operating expenses 100% 43.9% 0.9% 100% -12.4% 2.5%<br />
Operating profit 100% 100%<br />
Dividends from subsidiaries, associates and others 100% - 100.0% 100% - 100.0%<br />
Interest income from subsidiaries and associates 100% - 100.0% 100% - 100.0%<br />
Interest income from third parties 100% - - 100% - -<br />
Interest expenses from subsidiaries and associates 100% - 100.0% 100% - 100.0%<br />
Interest expenses from third parties and Parent 100% - - 100% - -<br />
Exchange rate differences 100% - - 100% - -<br />
Reversal of impairment losses on investments 100% - - 100% - -<br />
Impairment losses on investments 100% - - 100% - -<br />
Net financial income and expenses 100% - - 100% - -<br />
Profit before tax 100% 100%<br />
Income tax expense 100% - - 100% -5.7% -<br />
Profit for the year 100% 100%<br />
191
Separate financial statements at 31 December <strong>2012</strong> – Attachments<br />
Attachment 3<br />
Separate statement of<br />
financial position at<br />
31 December <strong>2012</strong>, prepared<br />
in accordance with Consob<br />
Resolution no. 15519<br />
dated 27 July 2006 and<br />
Consob Communication<br />
no. DEM/6064293 dated<br />
28 July 2006<br />
31.12.<strong>2012</strong> 31.12.2011<br />
(million euro)<br />
Balances<br />
Of which<br />
with related<br />
parties Weight % Balances<br />
Of which<br />
with related<br />
parties Weight %<br />
Assets<br />
Property, plant and equipment 179.6 - - 190.7 - -<br />
Goodwill and other intangible assets with an indefinite<br />
useful life - - - - - -<br />
Other intangible assets with a finite life 72.6 - - 69.8 - -<br />
Investments in associates 0.5 - - 0.5 - -<br />
Investments in subsidiaries and Other investments 667.3 - - 455.6 - -<br />
Deferred tax assets 32.4 - - 24.0 - -<br />
Other non-current financial assets 0.4 - - 50.0 - -<br />
Total non-current assets 952.9 - - 790.5 50% 100.0%<br />
Inventories 90.3 - - 107.6 - -<br />
Trade receivables 418.3 275.7 65.9% 406.0 264.4 65.1%<br />
Current financial assets 37.3 29.3 78.5% 137.5 129.3 94.1%<br />
Tax receivables 5.2 - - 1.4 - -<br />
Other receivables and current assets 19.8 - - 26.2 - -<br />
Cash and cash equivalents 10.2 - - 9.1 - -<br />
Assets held for sale - - - 7.1 - -<br />
Total current assets 581.1 303.0 52.3% 695.0 393.7 56.7%<br />
Total assets 1,534.0 303.0 19.8% 1,485.6 443.7 29.9%<br />
192
Separate financial statements at 31 December <strong>2012</strong> – Attachments<br />
(million euro)<br />
Balances<br />
31.12.<strong>2012</strong> 31.12.2011<br />
Of which<br />
with related<br />
parties Weight % Balances<br />
Equity -<br />
Of which<br />
with related<br />
parties Weight %<br />
Share capital 92.8 - - 92.8 - -<br />
Reserves 46.2 - - 46.7 - -<br />
Retained earnings 324.4 - - 337.7 - -<br />
Profit for the year 45.9 - - 10.4 - -<br />
Total equity 509.3 - - 487.7 - -<br />
Liabilities<br />
Medium and long-term loans and borrowings 232.4 169.1 72.8% 248.1 170.5 68.7%<br />
Employee benefits 35.2 - - 38.1 - -<br />
Provisions for risks and charges 23.4 - - 18.7 - -<br />
Deferred tax liabilities - - - - - -<br />
Other non-current liabilities 14.6 - - 15.8 - -<br />
Total non-current liabilities 305.6 169.1 55.3% 320.7 170.5 53.2%<br />
Banks and other loans and borrowings 233.3 69.2 29.7% 181.4 61.2 33.7%<br />
Provisions for risks and charges 37.9 0.0 0.0% 36.2 - -<br />
Trade payables 391.6 72.7 18.6% 400.2 64.8 16.2%<br />
Tax payables 8.3 0.0 0.0% 12.5 - -<br />
Other payables 48.0 0.0 0.0% 46.9 - -<br />
Total current liabilities 719.1 139.9 19.5% 677.2 126.0 18.6%<br />
Total liabilities 1,024.6 309.1 30.2% 997.9 296.5 29.7%<br />
Total equity and liabilities 1,534.0 1,485.6<br />
Attachment 4<br />
Separate income statement for<br />
the year ended 31 December<br />
<strong>2012</strong> classified by function<br />
(million euro) <strong>2012</strong> 2011<br />
Revenue 1,017.5 1,108.1<br />
Cost of sales (901.9) (941.0)<br />
Selling and distribution expenses (116.6) (130.6)<br />
General and administrative expenses (30.3) (40.0)<br />
Operating profit (31.2) (3.5)<br />
Net financial expenses (23.1) (19.4)<br />
Gains or losses from associates 100.0 50.1<br />
Profit before tax 45.7 27.2<br />
Income tax expenses 0.2 (16.7)<br />
Profit for the year 45.9 10.4<br />
193
Separate financial statements at 31 December <strong>2012</strong> – Attachments<br />
Attachment 5<br />
List of investments in<br />
subsidiaries and associates<br />
<strong>2012</strong><br />
(million euro) Location Share capital Equity<br />
Investments in subsidiaries<br />
Of which profit<br />
(losses)<br />
<strong>Indesit</strong> Company Ceská S.r.o. Prague 0.0 0.3 0.1<br />
<strong>Indesit</strong> Electrodomesticos S.A. Alcobendas 1.0 (5.0) (5.8)<br />
Merloni Domestic Appliances Ltd. Peterborough 110.5 51.4 0.4<br />
<strong>Indesit</strong> Company UK Holdings Ltd. Peterborough 163.0 425.3 48.6<br />
<strong>Indesit</strong> Company Luxembourg S.A. Luxembourg 118.0 242.3 20.6<br />
<strong>Indesit</strong> Company Polska Sp.zo.o. Warsaw 132.8 231.8 0.1<br />
<strong>Indesit</strong> Company Portugal Electrodomésticos S.A. Lisbon 1.1 5.2 (1.2)<br />
<strong>Indesit</strong> Company Beyaz Esya Pazarlama A.S. Istanbul 4.8 11.5 1.5<br />
<strong>Indesit</strong> Company Beyaz Esya Sanayi ve Ticaret A.S. Manisa 127.9 80.6 (0.3)<br />
<strong>Indesit</strong> Argentina S.A. Argentina 3.9 8.3 1.6<br />
<strong>Indesit</strong> Company IP S.r.l. Fabriano (Italy) 0.0 0.0 (0.0)<br />
Aeradriatica S.p.A. Fabriano (Italy) 23.1 20.0 (0.5)<br />
<strong>Indesit</strong> Company Rus Ltd. Lipetzk (CSI) 0.1 (1.9) 38.1<br />
Closed Joint Stock Company <strong>Indesit</strong> International Lipetzk (CSI) 53.2 242.6 16.8<br />
<strong>Indesit</strong> Ukraine LLC Ukraine 1.1 (4.0) (4.2)<br />
<strong>Indesit</strong> Company Bulgaria Ltd. Sofia 0.0 0.2 0.0<br />
<strong>Indesit</strong> Company Nordics A.B. Kungens Kurva 0.0 0.0 0.0<br />
Investments in associates<br />
Trade Place B.V. 0.0 (0.0) 0.1<br />
* The information relating to Trade Place B.V. relates to 2011.<br />
194
Separate financial statements at 31 December <strong>2012</strong> – Attachments<br />
Share investment %<br />
Portion of equity<br />
in balance sheet<br />
(A)<br />
Carrying amount<br />
(B)<br />
Measurement<br />
using the equity<br />
method adjustment<br />
(C)<br />
(C) - (B)<br />
100.0 0.3 0.0 0.3 0.2<br />
79.0 (3.9) 0.0 (3.9) (3.9)<br />
19.6 10.1 13.6 10.1 (3.5)<br />
38.7 164.4 136.7 60.0 (76.6)<br />
100.0 242.3 105.2 191.5 86.3<br />
100.0 231.8 221.7 232.5 10.8<br />
0.0 0.0 0.0 0.0 0.0<br />
100.0 11.5 3.8 11.3 7.5<br />
36.2 29.1 22.1 29.1 7.0<br />
3.0 0.2 0.2 0.2 (0.0)<br />
100.0 0.0 0.0 0.0 0.0<br />
100.0 20.0 20.3 20.1 (0.2)<br />
100.0 (1.9) 0.1 (4.2) (4.3)<br />
100.0 242.6 143.2 242.4 99.2<br />
100.0 (4.0) 0.0 (4.0) (4.0)<br />
100.0 0.2 0.0 0.0 0.0<br />
100.0 0.0 0.0 0.0 0.0<br />
942.7 667.0 785.5 118.5<br />
20.0 (0.0) 0.5 (0.0) (0.5)<br />
195
Separate financial statements at 31 December <strong>2012</strong> – Attachments<br />
Attachment 6<br />
Summary of the availability<br />
of reserves<br />
Nature/Description<br />
(million euro)<br />
Share capital<br />
Amount<br />
Possibility<br />
to use<br />
Available<br />
portion<br />
Of which<br />
undistributable<br />
portion<br />
Summary of utilisations<br />
over three years<br />
To cover<br />
losses<br />
For other<br />
purposes<br />
Share capital 102.8 B - - - -<br />
Nominal amount of treasury shares (9.9) - (9.9) - -<br />
Equity related reserves<br />
Share premium reserve 35.9 A, B 35.9 - - -<br />
Share premium owner reserve (23.0) - (23.0) - -<br />
Revalutation reserve 0.0 A, B - - - -<br />
Reserve for grants 18.1 A, B, C 18.1 18.1 - -<br />
Surplus fusion reserve 1.4 1.4 - - -<br />
Profit reserve<br />
Legal reserve 22.7 B 22.7 - - -<br />
Statutary reserves 0.0 - - - -<br />
Stock options reserve 0.4 A, B - - - -<br />
Cash flow hedge reserve (8.9) A, B (8.9) - - -<br />
Retained earnings 324.0 A, B, C 323.7 0.2 - -<br />
Total share capital and reserve 463.4 393.0 (14.6) - -<br />
Profit/Losses for the year 45.9 - -<br />
Total equity 509.3 - -<br />
Restriction pursuant to art. 2426 paragraph 5 * (36.3) (36.3) - -<br />
Restriction on unrealized gains on exchange rate<br />
fluctuations - - - -<br />
Net total 356.7 (50.9) - -<br />
* It represents the indistributable portion destined to cover long-term costs not yet amortized.<br />
196
Separate financial statements at 31 December <strong>2012</strong> – Attachments<br />
Attachment 7<br />
Summary of the fees charged<br />
by the audit company and<br />
the members of its network<br />
for services provided to the<br />
Company during the year,<br />
prepared pursuant to art.<br />
149-duodecies of Issuers’<br />
Regulation no. 11971 dated<br />
14 May 1999 and subsequent<br />
amendments<br />
Services Service Supplier Beneficiary<br />
Fees<br />
(thousand euro)<br />
Audit KPMG S.p.A. Parent 1,151<br />
KPMG S.p.A. * Subsidiaries 372<br />
Other services<br />
- Agreed-upon procedures KPMG S.p.A. Parent 75<br />
- Agreed-upon procedures KPMG network Subsidiaries 9<br />
- Performance of advisory services and tax KPMG network Subsidiaries 90<br />
Total 1,697<br />
* The audit has been carried out by KPMG S.p.A. with the assistance of the KPMG network, present in the countries where the<br />
subsidiaries operate.<br />
Milan, 21 March 2013<br />
For the Board of Directors<br />
The Chairman<br />
(signed on the original)<br />
Andrea Merloni<br />
197
Separate financial statements at 31 December <strong>2012</strong> – Attachments<br />
Statement of compliance of the Separate financial statements at 31 December <strong>2012</strong><br />
pursuant to art. 154-bis of Legislative Decree 58/1998<br />
The Chief Executive Officer Marco Milani and the Manager in charge of financial reporting, Stefano<br />
Cavacini, pursuant to paras. 3 and 4 of art. 154-bis of Legislative Decree no. 58/1998, hereby confirm:<br />
––<br />
the adequacy with respect to the Company’s structure, and<br />
––<br />
the effective application<br />
throughout <strong>2012</strong> of the administrative and accounting procedures applied for the preparation of the<br />
Separate financial statements.<br />
The undersigned also confirm that the <strong>2012</strong> separate financial statements:<br />
––<br />
have been prepared in accordance with International Financial <strong>Report</strong>ing Standards, as endorsed<br />
by the European Union pursuant to Regulation (EC) no. 1606/2002 of the European Parliament and<br />
of the Council, dated 19 July 2002;<br />
––<br />
agree with the company books and accounting records;<br />
––<br />
are suitable for the purpose of providing a true and fair view of the financial position and results of<br />
operations of the Issuer.<br />
The report on operations includes a reliable analysis of the performance, results and financial position of<br />
the Issuer, as well as a description of the principal risks and uncertainties to which it is exposed.<br />
21 March 2013<br />
The Chief Executive Officer<br />
(signed on the original)<br />
Marco Milani<br />
The Manager in charge of financial reporting<br />
(signed on the original)<br />
Stefano Cavacini<br />
198
Separate financial statements at 31 December <strong>2012</strong> – Attachments<br />
<strong>Report</strong> of the independent auditor<br />
199
200<br />
Separate financial statements at 31 December <strong>2012</strong> – Attachments