City of Waterloo - Laurel Creek Watershed Monitoring Program
City of Waterloo - Laurel Creek Watershed Monitoring Program
City of Waterloo - Laurel Creek Watershed Monitoring Program

Create successful ePaper yourself
Turn your PDF publications into a flip-book with our unique Google optimized e-Paper software.
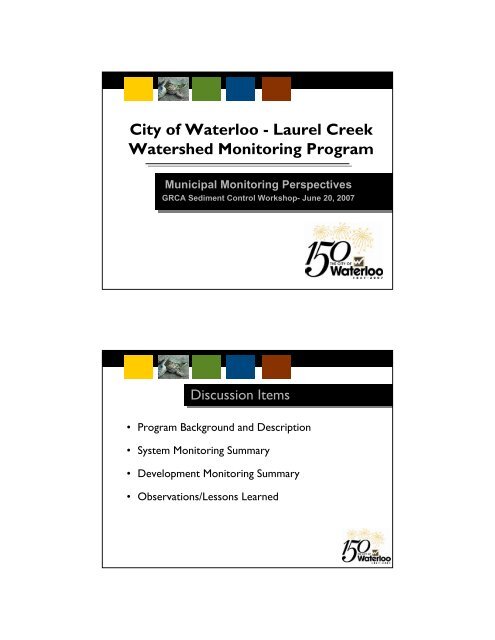
<strong>City</strong> <strong>of</strong> <strong>Waterloo</strong> - <strong>Laurel</strong> <strong>Creek</strong><br />
<strong>Watershed</strong> <strong>Monitoring</strong> <strong>Program</strong><br />
Municipal <strong>Monitoring</strong> Perspectives<br />
GRCA Sediment Control Workshop- June 20, 2007<br />
Discussion Items<br />
• <strong>Program</strong> Background and Description<br />
• System <strong>Monitoring</strong> Summary<br />
• Development <strong>Monitoring</strong> Summary<br />
• Observations/Lessons Learned
Evolution <strong>of</strong> LCWMP<br />
• 1990- <strong>Laurel</strong> <strong>Creek</strong> <strong>Watershed</strong> Study initiated<br />
• 1993- Official Plan Amendment #16<br />
• 1996- LCWMP Pilot Study<br />
• 1997- Present- Ongoing <strong>Monitoring</strong><br />
• 2000- Present- Expansion <strong>of</strong> to other watersheds (RIM Park)<br />
• 2002- <strong>City</strong> <strong>of</strong> <strong>Waterloo</strong> Environmental Strategic Plan<br />
Corporate Strategic Plan<br />
Environment First Philosophy<br />
Environmental<br />
Strategic<br />
Plan<br />
Environmental Directions<br />
Planning<br />
and Growth<br />
Water<br />
Resources<br />
Air Quality<br />
Energy and<br />
Resources<br />
Environmental<br />
Awareness<br />
Greenspace<br />
Strategic Actions<br />
Phase I Phase II Phase III<br />
Implementation<br />
Plans<br />
Further<br />
Study<br />
Measurement<br />
and Review
<strong>Program</strong> Objectives<br />
• Detect changes to the watershed<br />
• Determine the effects <strong>of</strong> land use and best management<br />
practices<br />
• Promote partnerships between agencies, municipalities and<br />
watershed residents<br />
• Increase public awareness and stewardship<br />
• Develop database for comparison and trend analysis.<br />
Environmental Indicators<br />
Water Quality<br />
Total Phosphorus<br />
Suspended Solids<br />
Dissolved Oxygen<br />
Temperature<br />
E. Coli<br />
Hydrology<br />
Baseflow<br />
Storm Flow<br />
Precipitation<br />
Aquatic Habitat<br />
Benthic Invertebrates<br />
Terrestrial<br />
Features<br />
Greenspace Size<br />
Greenspace Health
<strong>Monitoring</strong> <strong>Program</strong><br />
System<br />
<strong>Monitoring</strong><br />
Development<br />
<strong>Monitoring</strong><br />
Post Development<br />
<strong>Monitoring</strong><br />
Responsibility <strong>of</strong> <strong>City</strong> <strong>of</strong><br />
<strong>Waterloo</strong><br />
Responsibility <strong>of</strong> Developer<br />
Responsibility <strong>of</strong> <strong>City</strong> <strong>of</strong><br />
<strong>Waterloo</strong><br />
System <strong>Monitoring</strong> Stations
System <strong>Monitoring</strong><br />
Purpose:<br />
• Monitor overall health <strong>of</strong> watershed<br />
• Establish long term baseline conditions<br />
• Determine whether improvements or<br />
degradations are happening within the<br />
watershed<br />
Impoundments<br />
Agriculture<br />
Development Area<br />
Urban Stormwater
Cumulative TSS vs TP<br />
TSS<br />
TP<br />
500<br />
500<br />
450<br />
450<br />
400<br />
400<br />
350<br />
350<br />
TSS (mg/L)<br />
300<br />
250<br />
200<br />
300<br />
250<br />
200<br />
TP (ug/L)<br />
150<br />
150<br />
100<br />
100<br />
50<br />
50<br />
0<br />
1997 1998 1999 2000 2001 2002 2003 2004 2005 2006<br />
0
1999 TSS vs Rainfall<br />
Precipitation<br />
TSS<br />
30<br />
200.0<br />
180.0<br />
25<br />
160.0<br />
Precipitation (mm)<br />
20<br />
15<br />
10<br />
140.0<br />
120.0<br />
100.0<br />
80.0<br />
60.0<br />
TSS (mg/L)<br />
5<br />
40.0<br />
20.0<br />
0<br />
0.0<br />
5/1/99<br />
5/8/99<br />
5/15/99<br />
5/22/99<br />
5/29/99<br />
6/5/99<br />
6/12/99<br />
6/19/99<br />
6/26/99<br />
7/3/99<br />
7/10/99<br />
7/17/99<br />
7/24/99<br />
7/31/99<br />
8/7/99<br />
8/14/99<br />
8/21/99<br />
8/28/99<br />
9/4/99<br />
9/11/99<br />
9/18/99<br />
9/25/99<br />
2006 TSS vs Rainfall<br />
Precipitation TSS<br />
50<br />
200<br />
45<br />
180<br />
40<br />
160<br />
35<br />
140<br />
Precipitation (mm)<br />
30<br />
25<br />
20<br />
120<br />
100<br />
80<br />
TSS (mg/L)<br />
15<br />
60<br />
10<br />
40<br />
5<br />
20<br />
0<br />
0<br />
5/4/06<br />
5/11/06<br />
5/18/06<br />
5/25/06<br />
6/1/06<br />
6/8/06<br />
6/15/06<br />
6/22/06<br />
6/29/06<br />
7/6/06<br />
7/13/06<br />
7/20/06<br />
7/27/06<br />
8/3/06<br />
8/10/06<br />
8/17/06
System <strong>Monitoring</strong> Summary<br />
• 4 areas <strong>of</strong> concerns<br />
– Agriculture<br />
– Development areas<br />
– Online impoundments<br />
– Urban Stormwater<br />
• Land development activities (i.e. topsoil removal/grading)<br />
reflected in monitoring data<br />
• Sediment loading also impacts on aquatic health (i.e. benthic<br />
invertebrate data)<br />
Development <strong>Monitoring</strong><br />
Purpose:<br />
• To monitor site-specific conditions within<br />
Subdivisions from 2 years prior to area grading and<br />
for 2 years following substantial build-out.<br />
• To provide data to update/supplement Subwatershed<br />
studies and EIS Reports.<br />
• To measure and confirm the effectiveness <strong>of</strong><br />
sediment/erosion control measures; buffers; SWM<br />
ponds.
<strong>Program</strong> components:<br />
Development <strong>Monitoring</strong><br />
• Pre-, Post- and During Construction monitoring plans<br />
established jointly with developers.<br />
• Combination <strong>of</strong> qualitative and quantitative<br />
observations and sampling.<br />
• Variety <strong>of</strong> sampling approaches - grab sampling, data<br />
loggers, photographs, field record keeping.<br />
Development <strong>Monitoring</strong><br />
What have we observed?<br />
• Obvious disturbances during development, typically<br />
with a decline following build-out for water-related<br />
parameters.<br />
• That pre-development conditions <strong>of</strong>ten a contributing<br />
problem - - esp. cultivated areas, lands cleared for<br />
agriculture near intermittent watercourses.<br />
• Larger magnitude, infrequent events present greatest<br />
challenges for sediment & erosion control
<strong>Laurel</strong>wood Basin E SWM Pond<br />
% Target Exceedance<br />
100<br />
90<br />
80<br />
70<br />
60<br />
50<br />
40<br />
30<br />
20<br />
10<br />
0<br />
INLET<br />
OUTLET<br />
1996 1998 2001 1996 1998 2001<br />
TSS<br />
TP<br />
DO<br />
Temp<br />
Ecoli<br />
Flow from Intermittent Streams<br />
Summer<br />
Summer<br />
Late Fall<br />
Late Fall<br />
Spring<br />
Spring
Clair <strong>Creek</strong> – North Branch<br />
Erosion from Intermittent Streams --<br />
Clair <strong>Creek</strong> North Branch
Weekly Sediment & Erosion Control Reports
Future SWM Ponds or or temporary sedimentation basins?<br />
Early stabilization <strong>of</strong> <strong>of</strong> buffers.
Development <strong>Monitoring</strong><br />
Other Observations & Outcomes<br />
• Use <strong>of</strong> “local” data to enhance future subdivision<br />
design work.<br />
• Evolution <strong>of</strong> longer lead times for monitoring and use<br />
<strong>of</strong> such information to enhance comprehensiveness <strong>of</strong><br />
EIS evaluations.<br />
• Demonstrated need for early dedication <strong>of</strong> buffers &<br />
established vegetative controls in advance <strong>of</strong><br />
conventional engineered measures.<br />
Development <strong>Monitoring</strong><br />
Other Observations & Outcomes<br />
• Difficulties in data collection - - sampling capability,<br />
scarcity <strong>of</strong> data, “academic versus practical” use <strong>of</strong><br />
monitoring information<br />
• Lag time between data collection, reporting - - less<br />
useful for short term sediment & erosion control<br />
• Weekly & event-based inspections are key
Thank You<br />
Denise McGoldrick – Public Works Services 519-747-8642<br />
Ron Ormson – Development Services 519-747-8708<br />
Municipal <strong>Monitoring</strong> Perspectives<br />
GRCA Sediment Control Workshop- June 20, 2007