
Create successful ePaper yourself
Turn your PDF publications into a flip-book with our unique Google optimized e-Paper software.
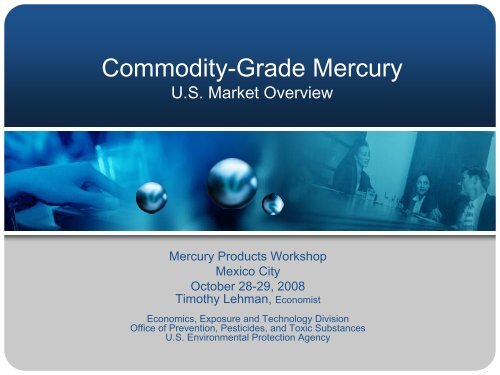
Commodity-Grade Mercury<br />
U.S. Market Overview<br />
Mercury Products Workshop<br />
Mexico City<br />
October 28-29, 2008<br />
Timothy Lehman, Economist<br />
Economics, Exposure and Technology Division<br />
Office of Prevention, Pesticides, and Toxic Substances<br />
U.S. Environmental Protection Agency
Overview<br />
• U.S Mercury Demand<br />
• Existing U.S. Product and Process Demand<br />
• Sources of U.S. Supply<br />
• Trends in the Mercury Market<br />
2
U.S. Mercury Demand<br />
• Between 1980 and 2001, annual mercury use in the U.S.<br />
decreased from 2,225 to 271 metric tons. More recently,<br />
the <strong>US</strong> is estimated to consume 100 metric tons per<br />
year.<br />
• Reductions largely due to:<br />
– Limits on mercury use in batteries.<br />
– EPA cancellation of pesticide registrations for the use of mercury<br />
in paint.<br />
– Closure or conversion of mercury cell chlor-alkali production<br />
facilities.<br />
– Reductions in multiple products.<br />
3
U.S. Mercury Product and Process Use Trends<br />
Other category includes batteries, paints, laboratory applications, biocides, pesticides, pharmaceuticals, and<br />
as a preservative in cosmetics<br />
U.S. EPA. EPA’s Roadmap for Mercury, available at http://www.epa.gov/mercury/pdfs/FINAL-Mercury-Roadmap-6-29.pdf, p. 37.<br />
4
Existing U.S. Product and Process<br />
Demand<br />
• Major U.S. Products<br />
– Switches and relays<br />
– Measuring and control devices<br />
– Electrical lighting<br />
– Button cell batteries<br />
– Dental amalgam<br />
• Major U.S. Processes<br />
– Mercury cell chlor-alkali production<br />
5
Total Use of Mercury in Products in <strong>US</strong>, 2004<br />
(percentage)<br />
Switches and Relays<br />
43%<br />
Dental Amalgam<br />
26%<br />
Formulated Products<br />
1%<br />
Batteries<br />
2%<br />
Miscellaneous<br />
2%<br />
Measuring Devices<br />
4%<br />
Lamps<br />
9%<br />
Thermostats<br />
13%<br />
Switches and Relays Dental Amalgam Thermostats Lamps<br />
Measuring Devices Miscellaneous Batteries Formulated Products<br />
Source: Trends in Mercury Use in Products: Northeast Waste Management Officials'<br />
Association, 2008<br />
6
Existing U.S. Product and Process<br />
Demand (cont’d)<br />
• Switches and Relays<br />
– 2004: 51 metric tons<br />
– 2001: 60 metric tons<br />
- Category includes: tilt switches, float switches, flame<br />
sensors and relays.<br />
- By 2006, Honeywell International ceased<br />
manufacture of mercury switches and reduced<br />
mercury use by 11.5 metric tons.<br />
– U.S. motor vehicles produced after January 1, 2003<br />
do not contain mercury switches.<br />
7
Existing U.S. Product and Process<br />
Demand (cont’d)<br />
• Thermostats<br />
– 2004: 15.0 metric tons<br />
– 2001: 15.5 metric tons<br />
- Includes: residential, commercial and industrial<br />
types.<br />
- Many state collection programs exist.<br />
- EPA and private sector are attempting to increase<br />
recycling rates<br />
- Eight states enacted legislation prohibiting the<br />
purchase of new mercury-containing thermostats.<br />
8
Existing U.S. Product and Process<br />
Demand (cont’d)<br />
• Measuring Devices<br />
– 2004: 4.8 metric tons<br />
– 2001: 6.0 metric tons<br />
– Category includes barometers, manometers, blood pressure<br />
cuffs, thermometers, etc.<br />
– Three U.S. manufacturers of precision measuring devices<br />
announced phase-out of mercury-added commercial products.<br />
– Fifteen states enacted legislation prohibiting the purchase of new<br />
mercury-containing thermometers.<br />
9
Existing U.S. Product and Process<br />
Demand (cont’d)<br />
• Electrical Lighting<br />
– 2004: 10.7 metric tons<br />
– 2001: 10.1 metric tons<br />
– Includes mercury used in fluorescent tubes, Compact<br />
fluorescent lights (CFLs), high intensity lights, and<br />
neon signs.<br />
– In 2007, NEMA signed a voluntary agreement to cap<br />
per unit consumption of mercury to 5 mg per CFL.<br />
– Increased promotion of fluorescent lamps shifts<br />
emphasis from mercury demand reduction to disposal<br />
and recycling.<br />
10
Existing U.S. Product and Process<br />
Demand (cont’d)<br />
• Button Cell Batteries<br />
– 2004: 2.6 metric tons<br />
– 2001: 3.0 metric tons<br />
– Mercury consumption in batteries down from 1,000 metric tons in<br />
early 1980s due to federal laws.<br />
– Button cell (including zinc air, silver oxide and alkaline<br />
manganese oxide) and mercuric oxide (only used in military and<br />
medical equipment) only remaining types.<br />
– Members of National Electrical Manufacturers Association<br />
(NEMA) plan to phase out mercury use in button-cell battery<br />
production by 2011.<br />
– Four states enacted legislation prohibiting the distribution of<br />
items containing mercury-added button cell batteries.<br />
11
Existing U.S. Product and Process<br />
Demand (cont’d)<br />
• Dental Amalgam<br />
– 2004: 30.4 metric tons<br />
– 2001: 30.8 metric tons<br />
– Between 1979 and 1990, CDC reports a 38 percent decrease in<br />
use of mercury dental amalgam.<br />
– 17 states enacted legislation to regulate dental amalgam, best<br />
management practices for waste, bans, informed consent<br />
requirements, and mandatory notification of available<br />
alternatives.<br />
– Higher cost non-mercury alternatives may limit future reductions.<br />
12
Existing U.S. Product and Process<br />
Demand (cont’d)<br />
• Mercury Cell Chlor-Alkali Production<br />
– Current Demand: 5 metric tons<br />
– Consumption down from 124 metric tons in 1996<br />
– In late 2008 to 2009, one plant is anticipated to<br />
convert to non-mercury cell technology and one plant<br />
is expected to close.<br />
- Remaining four plants are expected to close during<br />
next 30 years, but timeframe uncertain.<br />
13
Sources of U.S. Supply<br />
U.S. <strong>domestic</strong> <strong>supply</strong> sources:<br />
• Closing/retrofitting chlor-alkali plants<br />
• By-product from gold mining<br />
• Product recycling and waste recovery<br />
• Import of commodity-grade mercury<br />
• Import of calomel (mercury chloride)<br />
14
Estimated Quantities of Commodity-Grade<br />
Mercury in the U.S. in 2005 and 2006<br />
Totals: 580 359<br />
15
U.S. Domestic Supply Source: Chlor-alkali<br />
Plants<br />
• Elemental mercury released to market upon closure of plants<br />
or conversion to mercury-free technology<br />
– Current Inventory: approx. 2,100<br />
metric tons<br />
– Largest U.S. private-sector source of stored and in-use<br />
mercury.<br />
– Facilities generally operate 40 to 60 years.<br />
• No new construction in U.S. since 1970.<br />
16
U.S. Domestic Supply Source: Chlor-alkali<br />
Plants-cont'd<br />
Recent trends:<br />
– One plant is anticipated to close and one plant is expected<br />
to convert to non-mercury cell technology soon<br />
• Remaining four plants are expected to close during next<br />
30 years, but rate uncertain.<br />
- One plant closure resulted in 174 metric tons sold in 2005<br />
and 71 metric tons in 2006.<br />
- Second plant closure in June/July 2007 resulted in ~400<br />
ton <strong>supply</strong>.<br />
17
U.S. Domestic Supply Source:<br />
Byproduct Mining<br />
• Total Annual Supply: ~118 metric tons of commodity-grade<br />
mercury in 2006<br />
- Extraction will occur until 2015; processing will continue until<br />
2029<br />
• Trend: Quantity may increase modestly over time<br />
– Quantity dependent upon mine life and industry expansion<br />
18
U.S. Domestic Supply Source: Product Recycling and<br />
Waste Recovery<br />
• Total Annual Supply: Anecdotal evidence indicates<br />
that from 50 to 80 metric tons and potentially as much<br />
as 100-200 metric tons were recovered in 2006.<br />
• Sources: Retorting of end-of-life products, off-spec<br />
products, hazardous industrial waste, and<br />
contaminated soil from cleanup sites.<br />
• Trend: Quantity is assumed to remain constant in the<br />
short term (e.g. next decade), and then decline as<br />
mercury content of products decreases and waste<br />
streams get smaller.<br />
19
U.S. Reservoirs of Mercury – Limited<br />
Recovery Potential<br />
• Total Potential Supply: ~2000 metric tons of mercury currently<br />
contained in dental amalgam and products; unknown amount in<br />
contaminated soil<br />
• Most is now being land-filled or otherwise released when discarded,<br />
including:<br />
• discharges of dental amalgam to wastewater from dental offices<br />
and<br />
• small percentages of the mercury are recovered from reservoirs,<br />
e.g. from dental offices, auto switches and fluorescent lamps<br />
•Trend: Unknown percentages may be recovered in the future<br />
20
Year<br />
U.S. Domestic Supply Source: Imports and Exports<br />
(Data from U.S. ITC, Metric Tons)<br />
Mercury<br />
Equivalents of<br />
Calomel<br />
Imports<br />
Imports of<br />
Elemental<br />
Mercury<br />
Total<br />
Imports<br />
Total<br />
Exports<br />
Net Exports<br />
2002 27 210 237 324 87 - 114<br />
2003 11 46 57 287 230 - 241<br />
2004 207 92 299 279 -21 - 187<br />
2005 328 212 540 319 -221 - 107<br />
2006 58 94 152 390 238 – 296<br />
Average 126 131 257 320 63 - 189<br />
• Nearly all calomel imports since 2004 have been from Chile; we assume calomel is 50 percent mercury by<br />
weight (Reported imports of elemental mercury in 2006 were predominantly from Russia (51 metric tons),<br />
Peru (22 metric tons), Germany (14 metric tons), and Canada (eight metric tons) whereas 2005 imports were<br />
predominantly from Peru (128 metric tons), Chile (31 metric tons), Israel (29 metric tons), Canada (13 metric<br />
tons), and Germany (11 metric tons)).<br />
• Net exports = total exports minus total imports; second number in range excludes mercury from imported<br />
calomel due to uncertainty of calomel estimates.<br />
• Average annual net exports may be closer to 140, based on a separate estimate of 50 tons of mercury per year<br />
from calomel imports.<br />
21
Expected Future Trends<br />
• U.S. <strong>domestic</strong> <strong>supply</strong>: ~200 metric tons per year (from byproduct<br />
mining and recycled from products and waste) + releases from<br />
chlor-alkali plants<br />
– Secondary recovery growing slowly, but will ultimately be limited<br />
by size of reservoir.<br />
– May decline with demand (with or without a time lag), and with<br />
closure of all mercury cell chlor-alkali plants.<br />
• Imports for processing: ~257 metric tons per year<br />
- May be impacted by U.S. Mercury Export Ban<br />
22
U.S. Mercury Stockpiles<br />
• Current U.S. stocks: ~8,036 metric tons.<br />
• Progress to date:<br />
– More than half is already in long-term storage.<br />
– DOD maintains 4,436 metric tons of mercury in strategic<br />
stockpile.<br />
• Will be stored at one location for at least 40 years.<br />
– DOE stated it will continue to store 1,200 metric tons.<br />
– Remaining mercury stores in non-federal stocks is ~2,400 metric<br />
tons.<br />
23
Summary of U.S. Mercury Supplies<br />
Mercury<br />
(metric tons)<br />
1000<br />
800<br />
600<br />
400<br />
200<br />
0<br />
2006<br />
2008<br />
2010<br />
Year<br />
2012<br />
2014<br />
Elemental Mercury Imports<br />
Chlor-alkali plants<br />
Recycling and Waste<br />
Recovery<br />
Byproduct Mining<br />
• Releases from chlor-alkali plants are “lumpy.”<br />
- 2006 data reflects the scheduled closure of two chlor-alkali plants<br />
- We assume a plant releases 300 metric tons every three years after 2009<br />
• Recycling of products and waste may also be “lumpy”-- we assume a slight increase over<br />
time in recycling and waste recovery rates.<br />
• We assume continuing trends in imports based on a linear extrapolation of historical data<br />
from <strong>US</strong> ITC from 1989 through 2006.<br />
• This benchmark does not reflect any controls on exports or <strong>domestic</strong> supplies.<br />
24
U.S. Mercury Export Ban<br />
– Export ban legislation signed this month by<br />
President and should go into effect in 2013.<br />
– Will ban exports of mercury generated in the<br />
U.S.<br />
– Will allow voluntary storage of mercury by<br />
private sector in a DOE facility. User fee will<br />
be imposed.<br />
– Several reports to congress required to<br />
determine the impact of this legislation on<br />
primary mining and recycling.<br />
25


![John Ganzi [Modo de compatibilidad]](https://img.yumpu.com/22669860/1/190x132/john-ganzi-modo-de-compatibilidad.jpg?quality=85)