September 2008 Economic Snapshot Survey - InfoComm
September 2008 Economic Snapshot Survey - InfoComm
September 2008 Economic Snapshot Survey - InfoComm

Create successful ePaper yourself
Turn your PDF publications into a flip-book with our unique Google optimized e-Paper software.
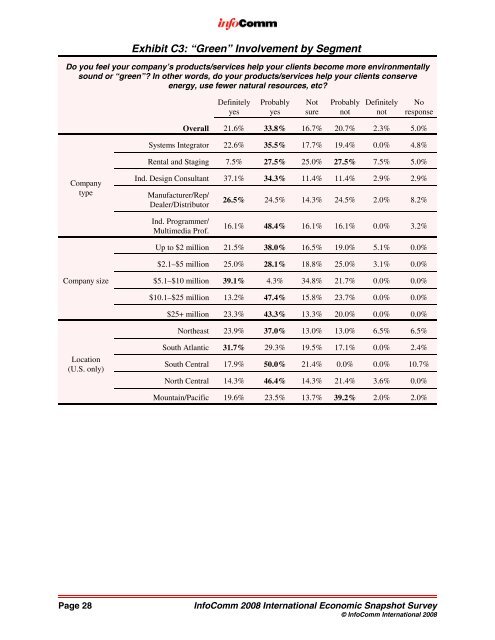
Exhibit C3: “Green” Involvement by Segment<br />
Do you feel your company’s products/services help your clients become more environmentally<br />
sound or “green”? In other words, do your products/services help your clients conserve<br />
energy, use fewer natural resources, etc?<br />
Definitely<br />
yes<br />
Probably<br />
yes<br />
Not<br />
sure<br />
Probably<br />
not<br />
Definitely<br />
not<br />
No<br />
response<br />
Overall 21.6% 33.8% 16.7% 20.7% 2.3% 5.0%<br />
Systems Integrator 22.6% 35.5% 17.7% 19.4% 0.0% 4.8%<br />
Rental and Staging 7.5% 27.5% 25.0% 27.5% 7.5% 5.0%<br />
Company<br />
type<br />
Ind. Design Consultant 37.1% 34.3% 11.4% 11.4% 2.9% 2.9%<br />
Manufacturer/Rep/<br />
Dealer/Distributor<br />
26.5% 24.5% 14.3% 24.5% 2.0% 8.2%<br />
Ind. Programmer/<br />
Multimedia Prof.<br />
16.1% 48.4% 16.1% 16.1% 0.0% 3.2%<br />
Up to $2 million 21.5% 38.0% 16.5% 19.0% 5.1% 0.0%<br />
$2.1–$5 million 25.0% 28.1% 18.8% 25.0% 3.1% 0.0%<br />
Company size<br />
$5.1–$10 million 39.1% 4.3% 34.8% 21.7% 0.0% 0.0%<br />
$10.1–$25 million 13.2% 47.4% 15.8% 23.7% 0.0% 0.0%<br />
$25+ million 23.3% 43.3% 13.3% 20.0% 0.0% 0.0%<br />
Northeast 23.9% 37.0% 13.0% 13.0% 6.5% 6.5%<br />
Location<br />
(U.S. only)<br />
South Atlantic 31.7% 29.3% 19.5% 17.1% 0.0% 2.4%<br />
South Central 17.9% 50.0% 21.4% 0.0% 0.0% 10.7%<br />
North Central 14.3% 46.4% 14.3% 21.4% 3.6% 0.0%<br />
Mountain/Pacific 19.6% 23.5% 13.7% 39.2% 2.0% 2.0%<br />
Page 28<br />
<strong>InfoComm</strong> <strong>2008</strong> International <strong>Economic</strong> <strong>Snapshot</strong> <strong>Survey</strong><br />
© <strong>InfoComm</strong> International <strong>2008</strong>