Download PDF (all abstracts) - BioMed Central
Download PDF (all abstracts) - BioMed Central
Download PDF (all abstracts) - BioMed Central

Create successful ePaper yourself
Turn your PDF publications into a flip-book with our unique Google optimized e-Paper software.
BMC Proceedings 2013, Volume 7 Suppl 6<br />
http://www.biomedcentral.com/bmcproc/supplements/7/S6<br />
Page 30 of 151<br />
• Fed-batch cultivations substanti<strong>all</strong>y improved cell and product<br />
concentration. Feeding cultures in CD OptiCHO with EfficientFeed A<br />
and FunctionMAX or with Feed A and Feed B resulted in similar<br />
antibody concentrations and roughly doubled the antibody<br />
production compared to feeding with EfficientFeed A only.<br />
• The highest titer was achieved in ActiCHO P in combination with Feed<br />
A and Feed B. In this medium a 6.3-fold improvement, compared with<br />
the previous batch cultivation, was observed. Further addition of<br />
FunctionMAX to these cultures did not significantly improve the<br />
antibody production.<br />
Reference<br />
1. Barrett S, Boniface R, Dhulipala P, Slade P, Tennico Y, Stramaglia M, Lio P,<br />
Gorfien S: Attaining Next-Level Titers in CHO Fed-Batch Cultures.<br />
BioProcess International 2012, 10:56-62.<br />
P14<br />
Advanced off-gas measurement using proton transfer reaction mass<br />
spectrometry to predict cell culture parameters<br />
Timo Schmidberger 1,2* , Robert Huber 2<br />
1 Department of biotechnology, University of Natural Resources and Life<br />
Sciences, 1180 Vienna, Austria;<br />
2 Sandoz GmbH BU Biopharmaceuticals, 6336<br />
Langkampfen, Austria<br />
E-mail: timo.schmidberger@sandoz.com<br />
BMC Proceedings 2013, 7(Suppl 6):P14<br />
Background: Mass spectrometry is a well-known technology to detect O 2<br />
and CO 2 in the off-gas of cell culture fermentations. In contrast to classical<br />
mass spectrometers, the proton transfer reaction mass spectrometer (PTR<br />
MS) enables the noninvasive analysis of a broad spectrum of volatile<br />
organic compounds (VOCs) in real time. The thereby applied soft<br />
ionization technology generates spectra of less fragmentation and<br />
facilitates their interpretation. This gave us the possibility to identify<br />
process relevant compounds in the bioreactor off-gas stream in addition to<br />
O 2 and CO 2 . In our study the PTR-MS technology was applied for the first<br />
time to monitor volatile organic compounds (VOC) and to predict cell<br />
culture parameters in an industrial mammalian cell culture process.<br />
Materials and methods: The aptitude of PTR MS for advanced bioprocess<br />
monitoring was assessed by Chinese hamster ovary (CHO) cell culture<br />
processes producing a recombinant protein conducted in a modified 7L<br />
glass bioreactor (Applikon, Shiedam, Netherlands). The PTR MS-hs (Ionicon,<br />
Innsbruck, Austria) was equipped with a QMS422 quadrupole for mass<br />
separation and with a secondary electron multiplier detector to measure<br />
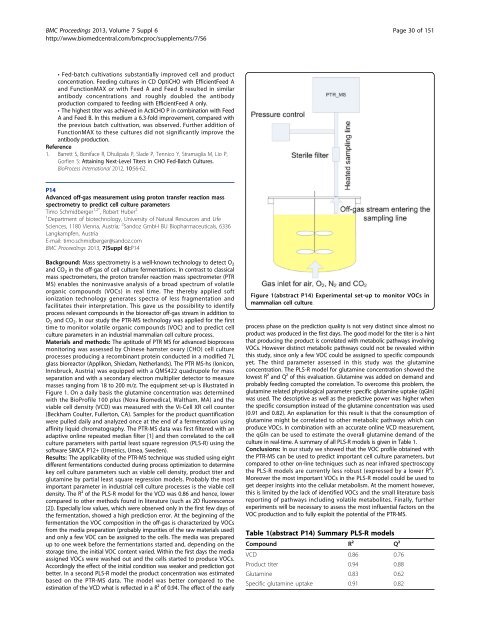
masses ranging from 18 to 200 m/z. The equipment set-up is illustrated in<br />
Figure 1. On a daily basis the glutamine concentration was determined<br />
with the BioProfile 100 plus (Nova Biomedical, Waltham, MA) and the<br />
viable cell density (VCD) was measured with the Vi-Cell XR cell counter<br />
(Beckham Coulter, Fullerton, CA). Samples for the product quantification<br />
were pulled daily and analyzed once at the end of a fermentation using<br />
affinity liquid chromatography. The PTR-MS data was first filtered with an<br />
adaptive online repeated median filter [1] and then correlated to the cell<br />
culture parameters with partial least square regression (PLS-R) using the<br />
software SIMCA P12+ (Umetrics, Umea, Sweden).<br />
Results: The applicability of the PTR-MS technique was studied using eight<br />
different fermentations conducted during process optimization to determine<br />
key cell culture parameters such as viable cell density, product titer and<br />
glutamine by partial least square regression models. Probably the most<br />
important parameter in industrial cell culture processes is the viable cell<br />
density. The R² of the PLS-R model for the VCD was 0.86 and hence, lower<br />
compared to other methods found in literature (such as 2D fluorescence<br />
[2]). Especi<strong>all</strong>y low values, which were observed only in the first few days of<br />
the fermentation, showed a high prediction error. At the beginning of the<br />
fermentation the VOC composition in the off-gas is characterized by VOCs<br />
from the media preparation (probably impurities of the raw materials used)<br />
and only a few VOC can be assigned to the cells. The media was prepared<br />
up to one week before the fermentations started and, depending on the<br />
storage time, the initial VOC content varied. Within the first days the media<br />
assigned VOCs were washed out and the cells started to produce VOCs.<br />
Accordingly the effect of the initial condition was weaker and prediction got<br />
better. In a second PLS-R model the product concentration was estimated<br />
based on the PTR-MS data. The model was better compared to the<br />
estimation of the VCD what is reflected in a R² of 0.94. The effect of the early<br />
Figure 1(abstract P14) Experimental set-up to monitor VOCs in<br />
mammalian cell culture.<br />
process phase on the prediction quality is not very distinct since almost no<br />
product was produced in the first days. The good model for the titer is a hint<br />
that producing the product is correlated with metabolic pathways involving<br />
VOCs. However distinct metabolic pathways could not be revealed within<br />
this study, since only a few VOC could be assigned to specific compounds<br />
yet. The third parameter assessed in this study was the glutamine<br />
concentration. The PLS-R model for glutamine concentration showed the<br />
lowest R² and Q² of this evaluation. Glutamine was added on demand and<br />
probably feeding corrupted the correlation. To overcome this problem, the<br />
glutamine related physiological parameter specific glutamine uptake (qGln)<br />
was used. The descriptive as well as the predictive power was higher when<br />
the specific consumption instead of the glutamine concentration was used<br />
(0.91 and 0.82). An explanation for this result is that the consumption of<br />
glutamine might be correlated to other metabolic pathways which can<br />
produce VOCs. In combination with an accurate online VCD measurement,<br />
the qGln can be used to estimate the over<strong>all</strong> glutamine demand of the<br />
culture in real-time. A summary of <strong>all</strong> PLS-R models is given in Table 1.<br />
Conclusions: In our study we showed that the VOC profile obtained with<br />
the PTR-MS can be used to predict important cell culture parameters, but<br />
compared to other on-line techniques such as near infrared spectroscopy<br />
the PLS-R models are currently less robust (expressed by a lower R²).<br />
Moreover the most important VOCs in the PLS-R model could be used to<br />
get deeper insights into the cellular metabolism. At the moment however,<br />
this is limited by the lack of identified VOCs and the sm<strong>all</strong> literature basis<br />
reporting of pathways including volatile metabolites. Fin<strong>all</strong>y, further<br />
experiments will be necessary to assess the most influential factors on the<br />
VOC production and to fully exploit the potential of the PTR-MS.<br />
Table 1(abstract P14) Summary PLS-R models<br />
Compound R² Q²<br />
VCD 0.86 0.76<br />
Product titer 0.94 0.88<br />
Glutamine 0.83 0.62<br />
Specific glutamine uptake 0.91 0.82