No.1: PUBLICITY - The TaxPayers' Alliance
No.1: PUBLICITY - The TaxPayers' Alliance
No.1: PUBLICITY - The TaxPayers' Alliance
Create successful ePaper yourself
Turn your PDF publications into a flip-book with our unique Google optimized e-Paper software.
EMBARGOED UNTIL 00:01 FRIDAY 12 DECEMBER<br />
www.taxpayersalliance.com<br />
Council Spending Uncovered II<br />
<strong>No.1</strong>: <strong>PUBLICITY</strong><br />
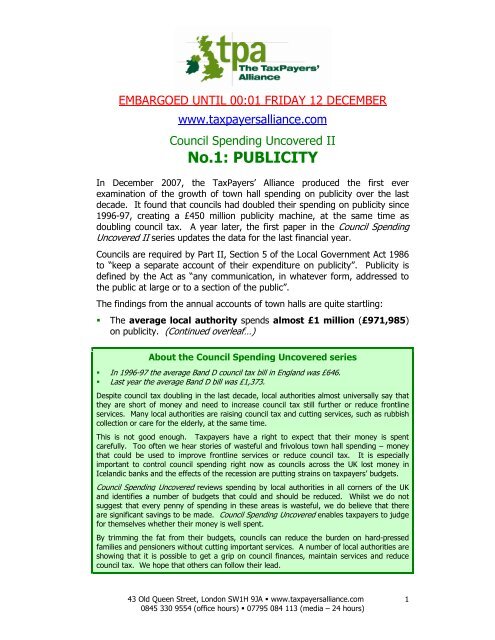
In December 2007, the TaxPayers’ <strong>Alliance</strong> produced the first ever<br />
examination of the growth of town hall spending on publicity over the last<br />
decade. It found that councils had doubled their spending on publicity since<br />
1996-97, creating a £450 million publicity machine, at the same time as<br />
doubling council tax. A year later, the first paper in the Council Spending<br />
Uncovered II series updates the data for the last financial year.<br />
Councils are required by Part II, Section 5 of the Local Government Act 1986<br />
to “keep a separate account of their expenditure on publicity”. Publicity is<br />
defined by the Act as “any communication, in whatever form, addressed to<br />
the public at large or to a section of the public”.<br />
<strong>The</strong> findings from the annual accounts of town halls are quite startling:<br />
<strong>The</strong> average local authority spends almost £1 million (£971,985)<br />
on publicity. (Continued overleaf…)<br />
About the Council Spending Uncovered series<br />
In 1996-97 the average Band D council tax bill in England was £646.<br />
Last year the average Band D bill was £1,373.<br />
Despite council tax doubling in the last decade, local authorities almost universally say that<br />
they are short of money and need to increase council tax still further or reduce frontline<br />
services. Many local authorities are raising council tax and cutting services, such as rubbish<br />
collection or care for the elderly, at the same time.<br />
This is not good enough. Taxpayers have a right to expect that their money is spent<br />
carefully. Too often we hear stories of wasteful and frivolous town hall spending – money<br />
that could be used to improve frontline services or reduce council tax. It is especially<br />
important to control council spending right now as councils across the UK lost money in<br />
Icelandic banks and the effects of the recession are putting strains on taxpayers’ budgets.<br />
Council Spending Uncovered reviews spending by local authorities in all corners of the UK<br />
and identifies a number of budgets that could and should be reduced. Whilst we do not<br />
suggest that every penny of spending in these areas is wasteful, we do believe that there<br />
are significant savings to be made. Council Spending Uncovered enables taxpayers to judge<br />
for themselves whether their money is well spent.<br />
By trimming the fat from their budgets, councils can reduce the burden on hard-pressed<br />
families and pensioners without cutting important services. A number of local authorities are<br />
showing that it is possible to get a grip on council finances, maintain services and reduce<br />
council tax. We hope that others can follow their lead.<br />
43 Old Queen Street, London SW1H 9JA www.taxpayersalliance.com<br />
0845 330 9554 (office hours) 07795 084 113 (media – 24 hours)<br />
1
<strong>The</strong> average local authority is spending twice the amount on publicity than it<br />
did in 1996-97, and 1.33 per cent more than a year ago:<br />
- In 1996-97, the average local authority spent £429,887 on publicity;<br />
- In 2006-07, the average local authority spent £954,023 on publicity;<br />
- In 2007-08, the average local authority spent £971,985 on publicity.<br />
<strong>The</strong> total local authority publicity bill is now over £430 million. While the<br />
overall total for spending on publicity seems to have gone down from last year,<br />
the average spending per local authority has increased. This is due to several<br />
councils’ accounts proving impossible to obtain in time for inclusion in this report.<br />
This year we obtained the accounts of 445 councils, or 95 per cent, as<br />
opposed to the 458, or 98 per cent, obtained last year.<br />
<strong>The</strong>re are 6 local authorities spending more than £5 million on publicity.<br />
<strong>The</strong>re are 69 local authorities spending more than £2 million on publicity.<br />
<strong>The</strong>re are 133 local authorities spending more than £1 million on publicity.<br />
At least 225 councils have increased their spending on publicity since the 2006-<br />
07 financial year.<br />
<strong>The</strong> 20 councils spending the most money on publicity accumulated an over<br />
£100 million bill.<br />
<strong>The</strong>re is one local authority, Birmingham City Council, that spent more than<br />
£9 million on publicity.<br />
However, at least 217 councils have decreased spending on publicity,<br />
collectively cutting over £25 million from their budgets and proving that councils<br />
can cut unnecessary spending.<br />
<strong>The</strong> top 20 councils who made the largest cuts in publicity spending saved<br />
taxpayers nearly £13 million compared to last year.<br />
Matthew Elliott, Chief Executive of the TaxPayers’ <strong>Alliance</strong>, said:<br />
"It is incredibly disappointing that, despite the economic downturn and the<br />
loss of millions in Icelandic Banks, local authorities are still spending nearly<br />
half a billion pounds a year on publicity. Whilst we salute the 217 councils who<br />
have cut spending on publicity, the 225 councils who have increased spending<br />
should hang their heads in shame. In the middle of a recession, councils need<br />
to cut back on propaganda and spin doctors and deliver savings to taxpayers.”<br />
43 Old Queen Street, London SW1H 9JA www.taxpayersalliance.com<br />
0845 330 9554 (office hours) 07795 084 113 (media – 24 hours)<br />
2
To arrange broadcast interviews, please contact:<br />
Mark Wallace<br />
Campaign Director, <strong>The</strong> <strong>TaxPayers'</strong> <strong>Alliance</strong><br />
mark.wallace@taxpayersalliance.com; 07736 009 548<br />
To discuss the research, please contact:<br />
Matthew Sinclair<br />
Research Director, <strong>The</strong> <strong>TaxPayers'</strong> <strong>Alliance</strong><br />
matthew.sinclair@taxpayersalliance.com; 07771 990 174<br />
Further details<br />
<strong>The</strong> Appendix to this note contains further details of town hall publicity spending.<br />
Five tables detail:<br />
<strong>The</strong> 20 local authorities spending the most on publicity.<br />
<strong>The</strong> 20 local authorities with the greatest increase in spending on publicity<br />
<strong>The</strong> 20 local authorities with the greatest percent increase in spending on<br />
publicity<br />
<strong>The</strong> 20 local authorities with the greatest decrease in spending on publicity<br />
<strong>The</strong> 20 local authorities with the greatest per cent decrease in spending on<br />
publicity<br />
<strong>The</strong> full list of town hall publicity spending.<br />
43 Old Queen Street, London SW1H 9JA www.taxpayersalliance.com<br />
0845 330 9554 (office hours) 07795 084 113 (media – 24 hours)<br />
3
Sources and method of calculation<br />
1. For England, Wales and Scotland, Part II, Section 5 of the Local Government Act<br />
1986 requires councils to “keep a separate account of their expenditure on publicity”.<br />
<strong>The</strong> Act also states: “Any person interested may at any reasonable time and without<br />
payment inspect the account and make copies of it or any part of it.” For Northern<br />
Ireland, the requirement comes from Section 115(c), Article 41 of the Local<br />
Government (Miscellaneous Provisions) (Northern Ireland) Order 1992.<br />
2. Publicity spending is defined as “any communication, in whatever form, addressed<br />
to the public at large or to a section of the public”. This definition under the 1986<br />
Act unfortunately allows local authorities a degree of definitional flexibility. Councils<br />
should be subject to much stricter and more open reporting requirements.<br />
3. All the information on publicity spending contained in this report is taken from the<br />
annual accounts of the each local authority. For 1996-97, we have managed to<br />
collect the accounts of 365 councils, 78 per cent of the total. For 2007-08, we have<br />
managed to collect the accounts of 445 councils, 95% per cent of the total.<br />
4. As of 3 December 2008, for a small number of councils, the 2007-08 accounts<br />
are not yet available, and in these cases the 2007-08 figure is represented by “NYA”.<br />
As of 3 December 2008, for a small number of councils, only the draft 2007-08<br />
accounts are currently available, and these have been used. For a very small<br />
number of local authorities, the 1996-97 accounts were not available and so the<br />
1997-98 accounts have been used. We make all these cases clear in the tables.<br />
5. <strong>The</strong> population data, used to rank councils by size of population, is taken from<br />
the Office for National Statistics, mid-2007 population estimates, all age groups<br />
(www.statistics.gov.uk).<br />
6. <strong>The</strong> publicity spending and population rankings run from 1 (highest) to 445<br />
(lowest), showing whether a council is spending more or less on publicity than the<br />
average for its population size. Local authorities that are closer to the top of<br />
the spending rankings than the population rankings (i.e. spending more<br />
than the average for their size of population) are shaded red and those<br />
closer to the top of the population rankings than the spending rankings are shaded<br />
green.<br />
7. We are clearly not responsible for the accuracy of information contained within<br />
official accounts, but we are happy to take any corrections.<br />
43 Old Queen Street, London SW1H 9JA www.taxpayersalliance.com<br />
0845 330 9554 (office hours) 07795 084 113 (media – 24 hours)<br />
4
APPENDIX<br />
Table A1: <strong>The</strong> 20 councils with the highest spending on publicity overall<br />
Council Spending on publicity, £ Increase, %<br />
1996-97 2006-07 2007-08 1996-97 to<br />
2007-08<br />
2006-07 to<br />
2007-08<br />
1 Birmingham* £6,900,000 £10,400,000 £9,200,000 33.3% -11.5%<br />
2 Liverpool £1,158,000 £9,402,000 £7,540,000 551.1% -19.8%<br />
3 Surrey - £5,100,000 £6,200,000 - 21.6%<br />
4 Bradford* £907,000 £5,606,000 £6,016,000 563.3% 7.3%<br />
5 Kent £1,409,000 £6,586,000 £5,683,000 303.3% -13.7%<br />
6 Manchester £2,283,742 £5,226,000 £5,118,000 124.1% -2.1%<br />
7 Sunderland - £4,376,815 £4,926,854 - 12.6%<br />
8 Southwark* £1,454,026 £5,057,000 £4,776,000 228.5% -5.6%<br />
9 Essex £2,455,000 £4,332,000 £4,775,000 94.5% 10.2%<br />
10 Lincolnshire £1,176,121 £3,733,865 £4,716,121 301.0% 26.3%<br />
11 Kingston upon Hull, City of £2,704,000 £4,808,000 £4,590,000 69.7% -4.5%<br />
12 Hampshire £2,507,000 £4,271,000 £4,547,000 81.4% 6.5%<br />
13 Sheffield £185,000 £4,195,000 £4,501,000 2333.0% 7.3%<br />
14 Leeds - £2,472,000 £4,445,000 - 79.8%<br />
15 Coventry £1,739,000 £3,913,000 £4,112,000 136.5% 5.1%<br />
16 Bristol, City of £1,055,000 £3,961,000 £3,974,000 276.7% 0.3%<br />
17 Somerset £2,016,000 £4,211,000 £3,957,000 96.3% -6.0%<br />
18 Newham - £4,018,000 £3,934,000 - -2.1%<br />
19 Salford £864,000 £3,414,000 £3,784,000 338.0% 10.8%<br />
20 Camden £1,298,357 £3,505,913 £3,730,533 187.3% 6.4%<br />
*2007-08 data available in draft Statement of Accounts only<br />
43 Old Queen Street, London SW1H 9JA www.taxpayersalliance.com<br />
0845 330 9554 (office hours) 07795 084 113 (media – 24 hours)<br />
5
Table A2: <strong>The</strong> 20 councils with the highest percent increase in spending on publicity<br />
from 2006-07 to 2007-08<br />
Council Spending on publicity, £ Increase, %<br />
1996-97 2006-07 2007-08 1996-97 to<br />
2007-08<br />
2006-07 to<br />
2007-08<br />
1 Spelthorne £84,000 £61,000 £182,000 116.7% 198.4%<br />
2 Lisburn - £114,184 £217,098 - 90.1%<br />
3 Croydon £618,000 £952,000 £1,769,000 186.2% 85.8%<br />
4 Reading £451,505 £658,516 £1,212,423 168.5% 84.1%<br />
5 Gedling £42,998 £77,683 £141,916 230.1% 82.7%<br />
6 Leeds - £2,472,000 £4,445,000 - 79.8%<br />
7 Derry City - £128,128 £220,550 - 72.1%<br />
8 Brent* £682,000 £1,297,000 £2,180,000 219.6% 68.1%<br />
9 Swale £337,000 £381,000 £637,000 89.0% 67.2%<br />
10 Oadby and Wigston £14,038 £98,000 £162,000 1054.0% 65.3%<br />
11 Newark and Sherwood £61,708 £96,443 £151,991 146.3% 57.6%<br />
12 South Norfolk £91,089 £78,235 £122,920 34.9% 57.1%<br />
13 Hinckley and Bosworth £45,753 £96,000 £145,000 216.9% 51.0%<br />
14 Sutton - £1,076,000 £1,622,000 - 50.7%<br />
15 South Ribble £140,093 £108,000 £157,000 12.1% 45.4%<br />
16 Exeter £330,000 £465,000 £673,000 103.9% 44.7%<br />
17 South Bedfordshire - £371,824 £525,407 - 41.3%<br />
18 Gateshead £565,033 £1,071,607 £1,508,000 166.9% 40.7%<br />
19 Teesdale £26,529 £61,293 £85,975 224.1% 40.3%<br />
20 South Bucks* £28,000 £125,000 £175,000 525.0% 40.0%<br />
*2007-08 data available in draft Statement of Accounts only<br />
43 Old Queen Street, London SW1H 9JA www.taxpayersalliance.com<br />
0845 330 9554 (office hours) 07795 084 113 (media – 24 hours)<br />
6
Table A3: <strong>The</strong> 20 councils with the highest actual increase in spending on publicity<br />
from 2006-07 to 2007-08<br />
Council Spending on publicity, £ Increase,<br />
%<br />
Real<br />
Increase £<br />
1996-97 2006-07 2007-08 2006-07 to<br />
2007-08<br />
2006-07 to<br />
2007-08<br />
1 Leeds - £2,472,000 £4,445,000 79.8% £1,973,000<br />
2 Surrey - £5,100,000 £6,200,000 21.6% £1,100,000<br />
3 Lincolnshire £1,176,121 £3,733,865 £4,716,121 26.3% £982,256<br />
4 Brent* £682,000 £1,297,000 £2,180,000 68.1% £883,000<br />
5 Norfolk £975,000 £2,488,000 £3,335,000 34.0% £847,000<br />
6 Croydon £618,000 £952,000 £1,769,000 85.8% £817,000<br />
7 Gloucestershire £536,000 £2,474,000 £3,161,000 27.8% £687,000<br />
8 Haringey £844,000 £2,730,000 £3,405,000 24.7% £675,000<br />
9 East Sussex £750,000 £2,168,000 £2,783,000 28.4% £615,000<br />
10 Barking and Dagenham £614,000 £2,316,000 £2,887,000 24.7% £571,000<br />
11 Reading £451,505 £658,516 £1,212,423 84.1% £553,907<br />
12 Sunderland - £4,376,815 £4,926,854 12.6% £550,039<br />
13 Sutton - £1,076,000 £1,622,000 50.7% £546,000<br />
14 Greater London Authority - £2,934,000 £3,452,000 17.7% £518,000<br />
15 Essex £2,455,000 £4,332,000 £4,775,000 10.2% £443,000<br />
16 Gateshead £565,033 £1,071,607 £1,508,000 40.7% £436,393<br />
17 Bradford* £907,000 £5,606,000 £6,016,000 7.3% £410,000<br />
18 Salford £864,000 £3,414,000 £3,784,000 10.8% £370,000<br />
19 Derby - £1,005,000 £1,365,000 35.8% £360,000<br />
20 Devon £1,119,000 £2,368,000 £2,705,000 14.2% £337,000<br />
*2007-08 data available in draft Statement of Accounts only<br />
43 Old Queen Street, London SW1H 9JA www.taxpayersalliance.com<br />
0845 330 9554 (office hours) 07795 084 113 (media – 24 hours)<br />
7
Table A4: <strong>The</strong> 20 councils with the greatest percent decrease in spending on<br />
publicity from 2006-07 to 2007-08<br />
Council Spending on publicity, £ Decrease,<br />
%<br />
Real<br />
Decrease £<br />
1996-97 2006-07 2007-08 2006-07 to<br />
2007-08<br />
2006-07 to<br />
2007-08<br />
1 West Somerset - £21,000 £4,000 81.0% £17,000<br />
2 Isles of Scilly* £979 £20,000 £5,000 75.0% £15,000<br />
3 Coleraine - £7,470 £2,391 68.0% £5,079<br />
4 Torridge* £109,798 £268,000 £123,000 54.1% £145,000<br />
5 Boston £100,000 £153,000 £86,000 43.8% £67,000<br />
6 Bolton £847,000 £2,669,000 £1,541,000 42.3% £1,128,000<br />
7 High Peak £54,826 £124,000 £72,000 41.9% £52,000<br />
8 Restormel £615,766 £357,358 £211,328 40.9% £146,030<br />
9 Bridgnorth £19,684 £31,103 £18,716 39.8% £12,387<br />
10 Berwick-upon-Tweed £76,490 £93,623 £56,387 39.8% £37,236<br />
11 Fareham £182,892 £377,000 £229,000 39.3% £148,000<br />
12 South Shropshire £11,221 £142,000 £87,000 38.7% £55,000<br />
13 Daventry £122,407 £292,000 £179,000 38.7% £113,000<br />
14 Redditch £193,000 £292,000 £180,000 38.4% £112,000<br />
15 Aylesbury Vale* £79,678 £376,000 £238,000 36.7% £138,000<br />
16 Glasgow City - £2,606,000 £1,656,000 36.5% £950,000<br />
17 South Gloucestershire £411,348 £1,081,000 £694,000 35.8% £387,000<br />
18 Cardiff £422,837 £1,317,817 £863,943 34.4% £453,874<br />
19 Rochdale £794,000 £2,260,000 £1,500,000 33.6% £760,000<br />
20 Carrick* - £199,000 £133,000 33.2% £66,000<br />
*2007-08 data available in draft Statement of Accounts only<br />
43 Old Queen Street, London SW1H 9JA www.taxpayersalliance.com<br />
0845 330 9554 (office hours) 07795 084 113 (media – 24 hours)<br />
8
Table A5: <strong>The</strong> 20 councils with the greatest decrease in spending on publicity from<br />
2006-07 to 2007-08<br />
Council Spending on publicity, £ Decrease,<br />
%<br />
Decrease £<br />
1996-97 2006-07 2007-08 2006-07 to<br />
2007-08<br />
2006-07 to<br />
2007-08<br />
1 Liverpool £1,158,000 £9,402,000 £7,540,000 19.8% £1,862,000<br />
2 Birmingham* £6,900,000 £10,400,000 £9,200,000 11.5% £1,200,000<br />
3 Bolton £847,000 £2,669,000 £1,541,000 42.3% £1,128,000<br />
4 Hertfordshire* £1,666,300 £4,035,000 £3,033,000 24.8% £1,002,000<br />
5 Glasgow City - £2,606,000 £1,656,000 36.5% £950,000<br />
6 Kent £1,409,000 £6,586,000 £5,683,000 13.7% £903,000<br />
7 Rochdale £794,000 £2,260,000 £1,500,000 33.6% £760,000<br />
8 Oxfordshire £396,392 £2,915,000 £2,372,000 18.6% £543,000<br />
9 Edinburgh, City of £1,544,000 £3,372,000 £2,866,000 15.0% £506,000<br />
10 Cardiff £422,837 £1,317,817 £863,943 34.4% £453,874<br />
11 Cheshire £819,000 £2,745,000 £2,333,000 15.0% £412,000<br />
12 Peterborough* £732,000 £2,085,000 £1,688,000 19.0% £397,000<br />
13 South Gloucestershire £411,348 £1,081,000 £694,000 35.8% £387,000<br />
14 Solihull £557,000 £1,377,000 £992,000 28.0% £385,000<br />
15 Merton £785,000 £1,707,000 £1,323,000 22.5% £384,000<br />
16 Warrington £259,000 £1,209,000 £830,000 31.3% £379,000<br />
17 Havering £363,000 £1,232,000 £854,000 30.7% £378,000<br />
18 Perth and Kinross £203,000 £1,185,000 £809,000 31.7% £376,000<br />
19 Barnsley £1,040,000 £1,942,000 £1,638,000 15.7% £304,000<br />
20 Hartlepool £428,169 £1,208,000 £921,000 23.8% £287,000<br />
*2007-08 data available in draft Statement of Accounts only<br />
43 Old Queen Street, London SW1H 9JA www.taxpayersalliance.com<br />
0845 330 9554 (office hours) 07795 084 113 (media – 24 hours)<br />
9
Table A6: <strong>The</strong> full list of town hall publicity spending<br />
Council Spending on publicity, £ Increase,<br />
%<br />
Publicity<br />
spending,<br />
ranking<br />
Size of total<br />
population,<br />
ranking<br />
1996-97 2006-07 2007-08 1996-97 to<br />
2007-08<br />
2007-08 2007-08<br />
Aberdeen City* £532,000 £1,898,427 £1,781,471 234.9% 81 110<br />
Aberdeenshire £298,000 £1,614,000 £1,729,000 480.2% 84 85<br />
Adur* £54,637 £97,099 £90,197 65.1% 415 404<br />
Allerdale £78,262 £278,265 £322,342 311.9% 265 300<br />
Alnwick £125,694 £83,275 £80,582 -35.9% 425 436<br />
Amber Valley* £183,826 £141,000 £142,000 -22.8% 364 220<br />
Angus £157,563 £852,000 - - - -<br />
Antrim £42,086 £132,163 £164,093 289.9% 350 417<br />
Ards - £130,849 £175,423 - 340 375<br />
Argyll and Bute* £174,000 £557,000 £564,000 224.1% 188 313<br />
Armagh - £263,715 - - - -<br />
Arun* £520,000 £725,000 £674,000 29.6% 171 167<br />
Ashfield £138,723 £256,000 £235,000 69.4% 296 238<br />
Ashford* £228,248 £536,000 £585,000 156.3% 187 246<br />
Aylesbury Vale* £79,678 £376,000 £238,000 198.7% 295 135<br />
Babergh* £292,000 £477,000 £464,000 58.9% 212 340<br />
Ballymena* - £173,061 £173,584 - 344 401<br />
Ballymoney* - £65,909 £60,168 - 432 438<br />
Banbridge £22,357 £95,246 £113,507 407.7% 393 425<br />
Barking and<br />
£614,000<br />
Dagenham<br />
£2,316,000 £2,887,000 370.2% 37 142<br />
Barnet £923,000 £1,118,000 £1,089,000 18.0% 129 49<br />
Barnsley £1,040,000 £1,942,000 £1,638,000 57.5% 89 97<br />
Barrow-in-Furness £79,251 £132,860 £140,093 76.8% 367 381<br />
Basildon - £395,000 £335,000 - 261 138<br />
Basingstoke and<br />
£471,000<br />
Deane<br />
£824,000 £794,000 68.6% 157 150<br />
Bassetlaw - £419,000 £341,000 - 259 249<br />
Bath and North East £1,056,000<br />
Somerset*<br />
£1,989,000 £1,896,000 79.5% 72 131<br />
Bedford £494,371 £818,000 £930,000 88.1% 139 158<br />
Bedfordshire £1,039,000 £2,440,000 £2,548,000 145.2% 49 43<br />
Belfast - £1,075,766 £1,120,086 - 127 73<br />
Berwick-upon-<br />
£76,490<br />
Tweed<br />
£93,623 £56,387 -26.3% 434 439<br />
Bexley £322,000 £684,000 £642,000 99.4% 179 100<br />
Birmingham* £6,900,000 £10,400,000 £9,200,000 33.3% 1 8<br />
Blaby £57,277 £162,693 £140,211 144.8% 366 307<br />
43 Old Queen Street, London SW1H 9JA www.taxpayersalliance.com<br />
0845 330 9554 (office hours) 07795 084 113 (media – 24 hours)<br />
10
Council Spending on publicity, £ Increase,<br />
%<br />
Publicity<br />
spending,<br />
ranking<br />
Size of total<br />
population,<br />
ranking<br />
1996-97 2006-07 2007-08 1996-97 to<br />
2007-08<br />
2007-08 2007-08<br />
Blackburn with<br />
Darwen<br />
£446,381<br />
£2,076,000 £1,897,000 325.0% 71 176<br />
Blackpool £709,000 £3,687,000 - - - -<br />
Blaenau Gwent - £277,300 £260,000 - 289 387<br />
Blyth Valley £307,541 £439,732 £317,535 3.2% 268 359<br />
Bolsover £81,431 £164,000 £130,000 59.6% 377 379<br />
Bolton £847,000 £2,669,000 £1,541,000 81.9% 95 74<br />
Boston £100,000 £153,000 £86,000 -14.0% 419 407<br />
Bournemouth* £1,452,642 £2,073,727 £2,029,596 39.7% 69 146<br />
Bracknell Forest £276,000 £862,000 £819,000 196.7% 154 243<br />
Bradford* £907,000 £5,606,000 £6,016,000 563.3% 4 35<br />
Braintree £136,000 £277,000 £305,000 124.3% 270 177<br />
Breckland £198,830 £574,381 £621,452 212.6% 184 204<br />
Brent* £682,000 £1,297,000 £2,180,000 219.6% 65 382<br />
Brentwood £162,000 £111,000 £120,000 -25.9% 387 383<br />
Bridgend* £398,000 £661,000 £531,000 33.4% 197 192<br />
Bridgnorth £19,684 £31,103 £18,716 -4.9% 442 420<br />
Brighton and Hove - £1,793,135 £1,820,655 - 78 80<br />
Bristol, City of £1,055,000 £3,961,000 £3,974,000 276.7% 16 42<br />
Broadland £223,500 £292,476 £345,082 54.4% 254 215<br />
Bromley £287,197 £907,000 £785,000 173.3% 159 60<br />
Bromsgrove £122,946 £186,000 £214,000 74.1% 313 311<br />
Broxbourne £168,000 £306,000 £284,000 69.0% 278 326<br />
Broxtowe £45,031 £119,384 £111,485 147.6% 397 256<br />
Buckinghamshire £329,000 £2,511,000 £2,792,000 748.6% 40 37<br />
Burnley £47,627 £397,356 £302,611 535.4% 272 337<br />
Bury £392,000 £825,000 £1,004,000 156.1% 133 126<br />
Caerphilly £491,000 £575,000 £645,000 31.4% 176 137<br />
Calderdale £283,500 £809,000 £607,000 114.1% 185 114<br />
Cambridge £186,056 £731,109 £653,690 251.3% 175 223<br />
Cambridgeshire £768,000 £2,402,000 £2,736,000 256.3% 43 22<br />
Camden £1,298,357 £3,505,913 £3,730,533 187.3% 20 91<br />
Cannock Chase - £460,000 £417,000 - 227 302<br />
Canterbury £189,000 £304,000 £295,000 56.1% 275 166<br />
Caradon - £101,000 £88,000 - 417 346<br />
Cardiff £422,837 £1,317,817 £863,943 104.3% 143 52<br />
Carlisle £588,000 £603,000 £561,000 -4.6% 190 279<br />
Carmarthenshire* £493,000 £1,118,000 £1,105,000 124.1% 128 128<br />
43 Old Queen Street, London SW1H 9JA www.taxpayersalliance.com<br />
0845 330 9554 (office hours) 07795 084 113 (media – 24 hours)<br />
11
Council Spending on publicity, £ Increase,<br />
%<br />
Publicity<br />
spending,<br />
ranking<br />
Size of total<br />
population,<br />
ranking<br />
1996-97 2006-07 2007-08 1996-97 to<br />
2007-08<br />
2007-08 2007-08<br />
Carrick* - £199,000 £133,000 - 374 310<br />
Carrickfergus £67,598 £110,953 £110,243 63.1% 398 431<br />
Castle Morpeth - £89,971 £97,726 - 412 423<br />
Castle Point £24,439 £111,295 £106,660 336.4% 403 329<br />
Castlereagh - £110,328 £118,290 - 388 392<br />
Ceredigion - £447,000 £424,000 - 222 374<br />
Charnwood £180,498 £340,000 £291,000 61.2% 276 143<br />
Chelmsford* - £353,000 £342,000 - 257 144<br />
Cheltenham* - £446,000 £364,000 - 249 247<br />
Cherwell* - £416,509 £532,000 - 196 185<br />
Cheshire £819,000 £2,745,000 £2,333,000 184.9% 58 19<br />
Chester £488,000 £696,000 £741,000 51.8% 165 224<br />
Chesterfield £339,000 £459,000 £564,000 66.4% 189 284<br />
Chester-le-Street £83,305 £155,000 £181,000 117.3% 332 416<br />
Chichester £37,625 £124,071 £139,000 269.4% 368 262<br />
Chiltern £159,966 £197,063 £190,579 19.1% 326 321<br />
Chorley £114,367 £312,000 £301,000 163.2% 273 278<br />
Christchurch £11,309 £62,000 £82,000 625.1% 423 427<br />
City of London - £1,320,000 £1,310,000 - 112 444<br />
Clackmannanshire £62,000 £245,000 - - - -<br />
Colchester £676,000 £657,000 £644,000 -4.7% 177 133<br />
Coleraine - £7,470 £2,391 - 445 409<br />
Congleton - £161,000 £134,000 - 372 309<br />
Conwy £413,000 £1,143,000 £1,171,000 183.5% 124 250<br />
Cookstown - - - - - -<br />
Copeland £104,841 £104,446 £115,000 9.7% 391 385<br />
Corby £233,638 £170,000 £172,000 -26.4% 346 413<br />
Cornwall - £2,105,000 £2,240,000 - 63 28<br />
Cotswold - £145,027 £142,651 - 363 347<br />
Coventry £1,739,000 £3,913,000 £4,112,000 136.5% 15 56<br />
Craigavon - £311,762 £325,433 - 262 330<br />
Craven £26,695 £154,000 £148,000 454.4% 359 411<br />
Crawley £321,000 £723,000 £679,000 111.5% 170 285<br />
Crewe and<br />
£101,000<br />
Nantwich<br />
£257,000 £304,000 201.0% 271 237<br />
Croydon £618,000 £952,000 £1,769,000 186.2% 82 47<br />
Cumbria - £2,794,000 £2,793,000 - 39 36<br />
Dacorum £251,000 £497,000 £560,000 123.1% 191 183<br />
43 Old Queen Street, London SW1H 9JA www.taxpayersalliance.com<br />
0845 330 9554 (office hours) 07795 084 113 (media – 24 hours)<br />
12
Council Spending on publicity, £ Increase,<br />
%<br />
Publicity<br />
spending,<br />
ranking<br />
Size of total<br />
population,<br />
ranking<br />
1996-97 2006-07 2007-08 1996-97 to<br />
2007-08<br />
2007-08 2007-08<br />
Darlington £367,797 £929,000 £846,000 130.0% 147 288<br />
Dartford £149,000 £147,000 £126,000 -15.4% 379 322<br />
Daventry £122,407 £292,000 £179,000 46.2% 335 370<br />
Denbighshire £429,000 £505,000 £544,000 26.8% 195 294<br />
Derby - £1,005,000 £1,365,000 - 109 87<br />
Derbyshire £1,271,000 £3,156,000 £3,457,000 172.0% 24 15<br />
Derbyshire Dales* - £157,000 £132,000 - 375 386<br />
Derry City - £128,128 £220,550 - 307 265<br />
Derwentside £165,692 £429,627 £428,099 158.4% 221 338<br />
Devon £1,119,000 £2,368,000 £2,705,000 141.7% 44 16<br />
Doncaster £686,600 £2,049,000 £2,245,000 227.0% 62 62<br />
Dorset £954,000 £1,911,000 £2,246,000 135.4% 61 44<br />
Dover £412,926 £429,000 £406,000 -1.7% 234 269<br />
Down - £229,370 £208,661 - 319 388<br />
Dudley £479,000 £1,228,000 £1,208,000 152.2% 121 58<br />
Dumfries and<br />
£210,832<br />
Galloway<br />
£809,000 £941,000 346.3% 137 165<br />
Dundee City £161,000 £389,000 - - - -<br />
Dungannon - £92,413 £77,200 - 426 414<br />
Durham City - £441,000 £438,000 - 217 303<br />
Durham County £2,111,000 £3,840,000 £3,729,000 76.6% 21 34<br />
Ealing £1,284,000 £2,979,000 £3,063,000 138.6% 33 59<br />
Easington - £463,000 £435,000 - 219 299<br />
East Ayrshire £184,000 £439,000 £558,000 203.3% 192 225<br />
East Cambridgeshire £123,802 £156,150 £156,735 26.6% 356 362<br />
East Devon £311,000 £160,000 £155,000 -50.2% 357 194<br />
East Dorset £83,000 £70,000 £70,000 -15.7% 430 344<br />
East Dunbartonshire £239,000 £377,000 £372,000 55.6% 248 274<br />
East Hampshire £149,000 £144,000 £169,000 13.4% 347 255<br />
East Hertfordshire £49,000 £108,000 £117,000 138.8% 389 191<br />
East Lindsey £506,942 £497,574 £416,242 -17.9% 228 179<br />
East Lothian £339,000 £30,000 - - - -<br />
East<br />
£67,100<br />
Northamptonshire<br />
£269,000 £352,000 424.6% 252 345<br />
East Renfrewshire £142,000 £506,000 - - - -<br />
East Riding of<br />
£385,000<br />
Yorkshire<br />
£2,286,000 £2,557,000 564.2% 48 48<br />
East Staffordshire* £107,000 £449,000 £411,000 284.1% 231 267<br />
East Sussex £750,000 £2,168,000 £2,783,000 271.1% 41 33<br />
43 Old Queen Street, London SW1H 9JA www.taxpayersalliance.com<br />
0845 330 9554 (office hours) 07795 084 113 (media – 24 hours)<br />
13
Council Spending on publicity, £ Increase,<br />
%<br />
Publicity<br />
spending,<br />
ranking<br />
Size of total<br />
population,<br />
ranking<br />
1996-97 2006-07 2007-08 1996-97 to<br />
2007-08<br />
2007-08 2007-08<br />
Eastbourne £461,000 £447,000 - - - -<br />
Eastleigh £85,240 £202,000 £230,000 169.8% 300 221<br />
Eden £19,706 £41,211 £45,491 130.8% 436 419<br />
Edinburgh, City of £1,544,000 £3,372,000 £2,866,000 85.6% 38 38<br />
Eilean Siar - £206,000 - - - -<br />
Ellesmere Port and £143,474<br />
Neston<br />
£322,000 £311,000 116.8% 269 357<br />
Elmbridge £134,879 £159,000 £209,000 55.0% 318 201<br />
Enfield £1,420,000 £2,151,000 £2,224,000 56.6% 64 65<br />
Epping Forest £93,000 £467,000 £399,000 329.0% 237 214<br />
Epsom and Ewell £135,784 £217,000 £257,000 89.3% 290 384<br />
Erewash £87,000 £312,000 £213,000 144.8% 314 258<br />
Essex £2,455,000 £4,332,000 £4,775,000 94.5% 9 3<br />
Exeter £330,000 £465,000 £673,000 103.9% 172 217<br />
Falkirk £376,039 £671,000 £767,000 104.0% 161 163<br />
Fareham £182,892 £377,000 £229,000 25.2% 301 261<br />
Fenland £16,845 £218,176 £241,341 1332.7% 293 314<br />
Fermanagh £76,528 £94,760 £98,839 29.2% 409 403<br />
Fife £897,000 £1,721,000 £1,803,000 101.0% 80 46<br />
Flintshire £708,000 £1,093,000 - - - -<br />
Forest Heath £53,868 £179,000 £169,000 213.7% 348 397<br />
Forest of Dean £98,045 £248,389 £272,430 177.9% 285 356<br />
Fylde £216,688 £248,000 - - - -<br />
Gateshead £565,033 £1,071,607 £1,508,000 166.9% 98 120<br />
Gedling £42,998 £77,683 £141,916 230.1% 365 251<br />
Glasgow City - £2,606,000 £1,656,000 - 88 26<br />
Gloucester* £279,000 £237,000 £208,000 -25.4% 320 24<br />
Gloucestershire £536,000 £2,474,000 £3,161,000 489.7% 30 25<br />
Gosport £123,292 £176,210 £159,830 29.6% 352 368<br />
Gravesham - £325,000 - - - -<br />
Great Yarmouth* £689,018 £740,000 £748,000 8.6% 164 304<br />
Greater London -<br />
Authority<br />
£2,934,000 £3,452,000 - 25 1<br />
Greenwich £743,000 £3,189,000 £2,933,000 294.8% 36 98<br />
Guildford £346,954 £557,712 £552,338 59.2% 194 189<br />
Gwynedd £446,801 £813,782 £835,400 87.0% 149 227<br />
Hackney £1,587,908 £1,711,000 £1,740,000 9.6% 83 109<br />
Halton £153,000 £1,131,000 £1,161,000 658.8% 125 226<br />
Hambleton - £2,449,000 £2,624,000 - 46 339<br />
43 Old Queen Street, London SW1H 9JA www.taxpayersalliance.com<br />
0845 330 9554 (office hours) 07795 084 113 (media – 24 hours)<br />
14
Council Spending on publicity, £ Increase,<br />
%<br />
Publicity<br />
spending,<br />
ranking<br />
Size of total<br />
population,<br />
ranking<br />
1996-97 2006-07 2007-08 1996-97 to<br />
2007-08<br />
2007-08 2007-08<br />
Hammersmith and<br />
Fulham £751,000 £669,000 £836,000 11.3% 148 136<br />
Hampshire £2,507,000 £4,271,000 £4,547,000 81.4% 12 4<br />
Harborough £38,069 £143,378 £101,575 166.8% 405 353<br />
Haringey £844,000 £2,730,000 £3,405,000 303.4% 27 96<br />
Harlow £117,202 £635,123 £669,196 471.0% 173 373<br />
Harrogate £720,000 £1,175,000 £1,377,000 91.3% 107 152<br />
Harrow - £1,394,000 £1,674,000 - 86 106<br />
Hart £106,000 £203,000 - - - -<br />
Hartlepool £428,169 £1,208,000 £921,000 115.1% 140 315<br />
Hastings - £134,000 £134,000 - 373 343<br />
Havant £139,000 £148,000 £180,000 29.5% 333 236<br />
Havering £363,000 £1,232,000 £854,000 135.3% 145 93<br />
Herefordshire - £991,000 £1,054,000 - 131 130<br />
Hertfordshire* £1,666,300 £4,035,000 £3,033,000 82.0% 34 7<br />
Hertsmere £73,450 £238,000 £269,000 266.2% 287 295<br />
High Peak £54,826 £124,000 £72,000 31.3% 428 308<br />
Highland £115,000 £1,463,000 £1,467,000 1175.7% 102 104<br />
Hillingdon - £1,804,000 £1,862,000 - 74 82<br />
Hinckley and<br />
£45,753<br />
Bosworth<br />
£96,000 £145,000 216.9% 362 277<br />
Horsham £73,949 £232,813 £234,050 216.5% 299 205<br />
Hounslow £393,306 £977,000 £953,000 142.3% 136 101<br />
Huntingdonshire £116,000 £285,000 £343,000 195.7% 256 141<br />
Hyndburn £63,306 £57,614 £47,975 -24.2% 435 355<br />
Inverclyde - £354,000 £355,000 - 251 361<br />
Ipswich - £851,000 £882,000 - 142 219<br />
Isle of Anglesey - £428,279 £389,585 - 239 389<br />
Isle of Wight - £715,679 £834,000 - 150 180<br />
Isles of Scilly* £979 £20,000 £5,000 410.7% 443 445<br />
Islington - £2,322,000 £2,064,000 - 66 124<br />
Kennet £144,000 £186,000 £167,000 16.0% 349 371<br />
Kensington and<br />
£557,000<br />
Chelsea<br />
£1,267,000 £1,287,000 131.1% 115 129<br />
Kent £1,409,000 £6,586,000 £5,683,000 303.3% 5 2<br />
Kerrier* £92,764 £120,054 £117,000 26.1% 390 290<br />
Kettering £114,699 £224,000 £175,000 52.6% 341 327<br />
King's Lynn and<br />
£98,294<br />
West Norfolk<br />
£219,929 £189,234 92.5% 327 172<br />
43 Old Queen Street, London SW1H 9JA www.taxpayersalliance.com<br />
0845 330 9554 (office hours) 07795 084 113 (media – 24 hours)<br />
15
Council Spending on publicity, £ Increase,<br />
%<br />
Publicity<br />
spending,<br />
ranking<br />
Size of total<br />
population,<br />
ranking<br />
1996-97 2006-07 2007-08 1996-97 to<br />
2007-08<br />
2007-08 2007-08<br />
Kingston upon Hull,<br />
City of<br />
Kingston upon<br />
Thames*<br />
£2,704,000<br />
£427,018<br />
£4,808,000 £4,590,000 69.7% 11 76<br />
£794,000 £692,000 62.1% 169 154<br />
Kirklees £661,000 £1,785,000 £1,840,000 178.4% 75 45<br />
Knowsley £875,000 £1,600,000 £1,549,000 77.0% 94 162<br />
Lambeth* £1,024,000 £1,299,000 £1,266,000 23.6% 118 71<br />
Lancashire £3,557,000 £3,451,000 £3,609,000 1.5% 22 5<br />
Lancaster £324,000 £253,000 £274,000 -15.4% 284 173<br />
Larne - £42,165 £38,929 - 440 437<br />
Leeds - £2,472,000 £4,445,000 - 14 14<br />
Leicester £1,218,000 £2,112,000 £1,880,000 54.4% 73 61<br />
Leicestershire £1,540,000 £3,095,000 £3,300,000 114.3% 29 20<br />
Lewes* £43,000 £150,000 £132,000 207.0% 376 301<br />
Lewisham £721,000 £2,314,000 £2,251,000 212.2% 60 75<br />
Lichfield £118,512 £282,000 £276,000 132.9% 282 292<br />
Limavady £20,912 £90,518 £106,960 411.5% 402 435<br />
Lincoln £217,466 £284,847 £264,263 21.5% 288 335<br />
Lincolnshire £1,176,121 £3,733,865 £4,716,121 301.0% 10 18<br />
Lisburn - £114,184 £217,098 - 310 244<br />
Liverpool £1,158,000 £9,402,000 £7,540,000 551.1% 2 41<br />
Luton - £2,171,000 £2,450,000 - 53 123<br />
Macclesfield - £250,000 £197,000 - 323 159<br />
Magherafelt - £35,575 £42,725 - 438 428<br />
Maidstone £296,000 £554,000 £419,000 41.6% 224 169<br />
Maldon - £84,000 £99,000 - 408 399<br />
Malvern Hills* - £126,000 £104,000 - 404 378<br />
Manchester £2,283,742 £5,226,000 £5,118,000 124.1% 6 39<br />
Mansfield £173,799 £397,000 £413,000 137.6% 230 286<br />
Medway - £1,482,000 - - - -<br />
Melton £55,285 £66,610 £85,270 54.2% 421 424<br />
Mendip £165,000 £212,000 £240,000 45.5% 294 263<br />
Merthyr Tydfil £193,876 £456,000 £469,000 141.9% 211 412<br />
Merton £785,000 £1,707,000 £1,323,000 68.5% 111 115<br />
Mid Bedfordshire £317,813 £394,882 £406,658 28.0% 233 193<br />
Mid Devon £41,000 £103,000 - - - -<br />
Mid Suffolk £99,634 £103,000 £94,000 -5.7% 414 305<br />
Mid Sussex £154,236 £333,836 £401,216 160.1% 236 202<br />
Middlesbrough £508,000 £1,235,000 £1,152,000 126.8% 126 182<br />
43 Old Queen Street, London SW1H 9JA www.taxpayersalliance.com<br />
0845 330 9554 (office hours) 07795 084 113 (media – 24 hours)<br />
16
Council Spending on publicity, £ Increase,<br />
%<br />
Publicity<br />
spending,<br />
ranking<br />
Size of total<br />
population,<br />
ranking<br />
1996-97 2006-07 2007-08 1996-97 to<br />
2007-08<br />
2007-08 2007-08<br />
Midlothian £231,000 £362,000 £363,000 57.1% 250 366<br />
Milton Keynes* £261,000 £1,185,000 £1,404,000 437.9% 106 94<br />
Mole Valley* - £184,000 £235,000 - 297 360<br />
Monmouthshire £231,610 £540,000 £528,000 128.0% 200 331<br />
Moray - £264,000 - - - -<br />
Moyle - £29,259 £25,604 - 441 443<br />
Neath Port Talbot £315,000 £427,000 £458,000 45.4% 214 186<br />
New Forest £186,000 £259,000 £275,000 47.8% 283 134<br />
Newark and<br />
Sherwood<br />
£61,708<br />
£96,443 £151,991 146.3% 358 245<br />
Newcastle upon<br />
Tyne<br />
£889,938<br />
£1,612,000 £1,825,000 105.1% 77 72<br />
Newcastle-under-<br />
Lyme<br />
£149,262<br />
£258,610 £197,347 32.2% 322 212<br />
Newham - £4,018,000 £3,934,000 - 18 84<br />
Newport - £1,234,778 £1,067,994 - 130 178<br />
Newry and<br />
£58,604<br />
Mourne****<br />
£64,809 £59,828 2.1% 433 297<br />
Newtownabbey £81,513 £150,768 £121,718 49.3% 384 358<br />
Norfolk £975,000 £2,488,000 £3,335,000 242.1% 28 9<br />
North Ayrshire £751,000 £731,000 £774,000 3.1% 160 188<br />
North Cornwall £190,049 £294,000 £281,000 47.9% 279 342<br />
North Devon - £306,000 £349,000 - 253 312<br />
North Dorset £131,486 £116,000 £112,000 -14.8% 394 390<br />
North Down £73,486 £391,006 £437,424 495.2% 218 372<br />
North East<br />
£124,000<br />
Derbyshire<br />
£266,000 - - - -<br />
North East<br />
£74,000<br />
Lincolnshire<br />
£1,107,000 £1,279,000 1628.4% 117 153<br />
North Hertfordshire £315,897 £236,000 £212,000 -32.9% 315 216<br />
North Kesteven £126,306 £361,210 £380,961 201.6% 243 276<br />
North Lanarkshire £404,646 £379,000 £378,000 -6.6% 244 50<br />
North Lincolnshire £408,000 £389,000 £418,000 2.5% 226 151<br />
North Norfolk £486,942 £598,000 £528,000 8.4% 201 283<br />
North Shropshire £53,545 £109,096 £109,245 104.0% 399 405<br />
North Somerset £681,000 £1,788,000 - - - -<br />
North Tyneside £244,135 £547,000 £749,000 206.8% 163 117<br />
North Warwickshire £69,564 £157,328 £179,000 157.3% 336 400<br />
North West<br />
-<br />
Leicestershire<br />
£143,378 £101,575 - 406 323<br />
43 Old Queen Street, London SW1H 9JA www.taxpayersalliance.com<br />
0845 330 9554 (office hours) 07795 084 113 (media – 24 hours)<br />
17
Council Spending on publicity, £ Increase,<br />
%<br />
Publicity<br />
spending,<br />
ranking<br />
Size of total<br />
population,<br />
ranking<br />
1996-97 2006-07 2007-08 1996-97 to<br />
2007-08<br />
2007-08 2007-08<br />
North Wiltshire £215,600 £289,000 - - - -<br />
North Yorkshire £550,000 £2,449,000 £2,624,000 377.1% 47 23<br />
Northampton £303,000 £821,000 £696,000 129.7% 167 113<br />
Northamptonshire £463,000 £2,777,000 - - - -<br />
Northumberland £1,065,000 £1,786,000 £2,058,000 93.2% 68 53<br />
Norwich* £231,000 £450,000 £525,000 127.3% 203 197<br />
Nottingham £318,000 £3,731,588 - - - -<br />
Nottinghamshire £2,036,000 £3,166,000 £3,460,000 69.9% 23 13<br />
Nuneaton and<br />
£164,000<br />
Bedworth<br />
£191,000 £196,000 19.5% 324 218<br />
Oadby and Wigston £14,038 £98,000 £162,000 1054.0% 351 410<br />
Oldham £455,000 £1,553,000 £1,285,000 182.4% 116 102<br />
Omagh - £95,533 £120,626 - 386 421<br />
Orkney Islands £258,000 £491,000 £446,000 72.9% 215 442<br />
Oswestry £57,140 £105,972 £99,255 73.7% 407 430<br />
Oxford - £760,000 £788,000 - 158 160<br />
Oxfordshire £396,392 £2,915,000 £2,372,000 498.4% 56 21<br />
Pembrokeshire £347,000 £1,169,000 £1,189,000 242.7% 123 229<br />
Pendle £112,844 £170,000 £130,000 15.2% 378 325<br />
Penwith - £91,000 £66,000 - 431 394<br />
Perth and Kinross £203,000 £1,185,000 £809,000 298.5% 155 174<br />
Peterborough* £732,000 £2,085,000 £1,688,000 130.6% 85 145<br />
Plymouth £465,567 £1,631,000 £1,661,000 256.8% 87 83<br />
Poole £98,000 £555,000 £557,000 468.4% 193 184<br />
Portsmouth £684,000 £1,638,000 £1,584,000 131.6% 92 116<br />
Powys £508,000 £711,000 £738,000 45.3% 166 198<br />
Preston £750,597 £1,092,000 - - - -<br />
Purbeck £33,967 £95,735 £80,796 137.9% 424 426<br />
Reading £451,505 £658,516 £1,212,423 168.5% 120 171<br />
Redbridge £1,108,000 £1,972,000 £2,062,000 86.1% 67 79<br />
Redcar and<br />
£683,000<br />
Cleveland<br />
£1,159,000 £1,032,000 51.1% 132 181<br />
Redditch £193,000 £292,000 £180,000 -6.7% 334 365<br />
Reigate and<br />
£161,443<br />
Banstead<br />
£245,000 £257,000 59.2% 291 195<br />
Renfrewshire - £1,364,000 £1,304,000 - 113 139<br />
Restormel £615,766 £357,358 £211,328 -65.7% 317 280<br />
Rhondda, Cynon, -<br />
Taff<br />
£1,691,000 £1,422,000 - 105 90<br />
43 Old Queen Street, London SW1H 9JA www.taxpayersalliance.com<br />
0845 330 9554 (office hours) 07795 084 113 (media – 24 hours)<br />
18
Council Spending on publicity, £ Increase,<br />
%<br />
Publicity<br />
spending,<br />
ranking<br />
Size of total<br />
population,<br />
ranking<br />
1996-97 2006-07 2007-08 1996-97 to<br />
2007-08<br />
2007-08 2007-08<br />
Ribble Valley £50,590 £100,023 £76,875 52.0% 427 408<br />
Richmond upon<br />
£45,714<br />
Thames<br />
£753,000 £932,000 1938.8% 138 127<br />
Richmondshire - £51,122 £42,121 - 439 422<br />
Rochdale £794,000 £2,260,000 £1,500,000 88.9% 99 111<br />
Rochford £33,652 £142,000 £139,000 313.1% 369 354<br />
Rossendale £77,300 £313,000 £272,000 251.9% 286 391<br />
Rother - £278,000 £285,000 - 277 332<br />
Rotherham £382,000 £2,996,000 £2,759,000 622.3% 42 81<br />
Rugby £123,910 £182,320 £199,850 61.3% 321 319<br />
Runnymede £105,497 £81,694 £97,923 -7.2% 411 350<br />
Rushcliffe £88,733 £161,996 £211,895 138.8% 316 264<br />
Rushmoor £155,364 £197,000 £182,000 17.1% 330 328<br />
Rutland - £213,000 £277,000 - 281 433<br />
Ryedale - £123,704 £94,705 - 413 415<br />
Salford £864,000 £3,414,000 £3,784,000 338.0% 19 103<br />
Salisbury £21,724 £385,000 £429,000 1874.8% 220 239<br />
Sandwell - £2,199,208 £2,492,000 - 50 64<br />
Scarborough £600,000 £492,000 £387,000 -35.5% 241 266<br />
Scottish Borders £345,243 £784,000 £644,000 86.5% 178 253<br />
Sedgefield £163,000 £375,000 £389,000 138.7% 240 336<br />
Sedgemoor* £500,000 £482,000 £422,000 -15.6% 223 248<br />
Sefton - £2,240,000 £2,468,000 - 51 69<br />
Selby £33,000 £133,000 £112,000 239.4% 395 363<br />
Sevenoaks £99,509 £211,000 £252,000 153.2% 292 242<br />
Sheffield £185,000 £4,195,000 £4,501,000 2333.0% 13 29<br />
Shepway £323,722 £265,000 £189,000 -41.6% 328 287<br />
Shetland Islands £158,000 £383,000 £342,000 116.5% 258 441<br />
Shrewsbury and<br />
£117,164<br />
Atcham<br />
£149,000 £138,000 17.8% 370 296<br />
Shropshire £300,000 £1,438,000 £1,221,000 307.0% 119 63<br />
Slough £456,000 £552,000 £529,000 16.0% 198 222<br />
Solihull £557,000 £1,377,000 £992,000 78.1% 134 112<br />
Somerset £2,016,000 £4,211,000 £3,957,000 96.3% 17 32<br />
South Ayrshire - £424,000 £398,000 - 238 252<br />
South Bedfordshire - £371,824 £525,407 - 202 228<br />
South Bucks* £28,000 £125,000 £175,000 525.0% 342 396<br />
South<br />
Cambridgeshire £119,297 £367,136 £458,582 284.4% 213 187<br />
43 Old Queen Street, London SW1H 9JA www.taxpayersalliance.com<br />
0845 330 9554 (office hours) 07795 084 113 (media – 24 hours)<br />
19
Council Spending on publicity, £ Increase,<br />
%<br />
Publicity<br />
spending,<br />
ranking<br />
Size of total<br />
population,<br />
ranking<br />
1996-97 2006-07 2007-08 1996-97 to<br />
2007-08<br />
2007-08 2007-08<br />
South Derbyshire £101,000 £230,000 £298,000 195.0% 274 316<br />
South<br />
Gloucestershire £411,348 £1,081,000 £694,000 68.7% 168 77<br />
South Hams £161,000 £574,000 £408,000 153.4% 232 348<br />
South Holland £51,221 £126,000 £124,000 142.1% 380 351<br />
South Kesteven £353,000 £445,000 £492,000 39.4% 208 200<br />
South Lakeland £73,000 £183,000 £174,000 138.4% 343 275<br />
South Lanarkshire £1,401,000 £1,145,000 £1,202,000 -14.2% 122 55<br />
South Norfolk £91,089 £78,235 £122,920 34.9% 383 232<br />
South<br />
Northamptonshire* £59,077 £216,000 £229,000 287.6% 302 324<br />
South Oxfordshire* £138,399 £225,000 £224,000 61.9% 305 207<br />
South Ribble £140,093 £108,000 £157,000 12.1% 355 270<br />
South Shropshire £11,221 £142,000 £87,000 675.3% 418 429<br />
South Somerset - £236,000 £183,000 - 329 155<br />
South Staffordshire £92,000 £110,000 £136,000 47.8% 371 272<br />
South Tyneside £291,000 £522,000 £508,000 74.6% 204 161<br />
Southampton £1,091,000 £2,496,000 £2,272,000 108.2% 59 92<br />
Southend-on-<br />
Sea**** £532,000 £798,000 £800,000 50.4% 156 147<br />
Southwark* £1,454,026 £5,057,000 £4,776,000 228.5% 8 70<br />
Spelthorne £84,000 £61,000 £182,000 116.7% 331 320<br />
St Albans* - £285,000 £373,000 - 246 196<br />
St Edmundsbury £163,000 £195,000 £217,000 33.1% 311 281<br />
St Helens £378,000 £1,439,000 £1,520,000 302.1% 97 132<br />
Stafford* £210,000 £385,000 £321,000 52.9% 266 10<br />
Staffordshire £856,000 £2,481,000 £2,427,000 183.5% 54 11<br />
Staffordshire<br />
Moorlands £211,549 £592,000 £503,000 137.8% 207 298<br />
Stevenage £444,000 £482,000 £406,000 -8.6% 235 367<br />
Stirling £464,000 £594,000 £638,000 37.5% 181 333<br />
Stockport £575,000 £1,189,000 £1,377,000 139.5% 108 67<br />
Stockton-on-Tees £483,000 £1,446,000 £1,588,000 228.8% 91 121<br />
Stoke-on-Trent £412,510 £1,563,000 £1,494,000 262.2% 100 86<br />
Strabane - £148,202 £192,552 - 325 432<br />
Stratford-on-Avon £128,000 £154,356 £158,728 24.0% 354 230<br />
Stroud - £235,472 £220,461 - 308 259<br />
Suffolk £884,000 £3,204,000 £2,982,000 237.3% 35 17<br />
Suffolk Coastal* £154,788 £229,000 £235,000 51.8% 298 211<br />
43 Old Queen Street, London SW1H 9JA www.taxpayersalliance.com<br />
0845 330 9554 (office hours) 07795 084 113 (media – 24 hours)<br />
20
Council Spending on publicity, £ Increase,<br />
%<br />
Publicity<br />
spending,<br />
ranking<br />
Size of total<br />
population,<br />
ranking<br />
1996-97 2006-07 2007-08 1996-97 to<br />
2007-08<br />
2007-08 2007-08<br />
Sunderland - £4,376,815 £4,926,854 - 7 68<br />
Surrey - £5,100,000 £6,200,000 - 3 6<br />
Surrey Heath - £203,540 £228,000 - 303 349<br />
Sutton - £1,076,000 £1,622,000 - 90 125<br />
Swale £337,000 £381,000 £637,000 89.0% 182 203<br />
Swansea £161,000 £519,000 £594,000 268.9% 186 95<br />
Swindon - £1,265,000 £1,466,000 - 103 122<br />
Tameside £304,000 £841,000 £852,000 180.3% 146 107<br />
Tamworth £118,074 £198,000 £148,000 25.3% 360 377<br />
Tandridge £63,167 £98,000 £89,000 40.9% 416 352<br />
Taunton Deane £124,844 £644,000 £664,000 431.9% 174 268<br />
Teesdale £26,529 £61,293 £85,975 224.1% 420 440<br />
Teignbridge £71,000 £270,000 £215,000 202.8% 312 208<br />
Telford and Wrekin - £1,280,000 £1,580,000 - 93 148<br />
Tendring £320,568 £216,000 £228,000 -28.9% 304 168<br />
Test Valley £221,000 £311,000 £278,000 25.8% 280 241<br />
Tewkesbury £76,795 £114,700 £123,886 61.3% 381 369<br />
Thanet - £401,000 £340,000 - 260 206<br />
<strong>The</strong> Vale of<br />
£191,195<br />
Glamorgan<br />
£512,000 £414,000 116.5% 229 213<br />
Three Rivers £126,070 £409,129 £381,000 202.2% 242 341<br />
Thurrock - £341,000 - - - -<br />
Tonbridge and<br />
£213,000<br />
Malling<br />
£307,000 £323,000 51.6% 264 240<br />
Torbay £668,392 £1,100,000 £1,300,000 94.5% 114 190<br />
Torfaen £343,747 £626,000 £504,000 46.6% 206 317<br />
Torridge* £109,798 £268,000 £123,000 12.0% 382 395<br />
Tower Hamlets £1,289,357 £2,300,000 £2,354,000 82.6% 57 105<br />
Trafford £270,000 £644,000 £623,000 130.7% 183 108<br />
Tunbridge Wells - £519,000 £419,000 - 225 273<br />
Tynedale £21,000 £80,000 £109,000 419.0% 400 406<br />
Uttlesford £61,760 £187,332 £148,000 139.6% 361 380<br />
Vale of White Horse £171,784 £110,056 £111,604 -35.0% 396 235<br />
Vale Royal £403,191 £886,969 £861,309 113.6% 144 209<br />
Wakefield £905,000 £1,669,000 £1,925,000 112.7% 70 51<br />
Walsall £770,000 £1,462,000 £1,363,000 77.0% 110 78<br />
Waltham Forest - £1,439,000 £1,485,000 - 101 99<br />
Wandsworth £588,725 £1,746,975 £1,804,670 206.5% 79 66<br />
Wansbeck - £42,396 £44,445 - 437 402<br />
43 Old Queen Street, London SW1H 9JA www.taxpayersalliance.com<br />
0845 330 9554 (office hours) 07795 084 113 (media – 24 hours)<br />
21
Council Spending on publicity, £ Increase,<br />
%<br />
Publicity<br />
spending,<br />
ranking<br />
Size of total<br />
population,<br />
ranking<br />
1996-97 2006-07 2007-08 1996-97 to<br />
2007-08<br />
2007-08 2007-08<br />
Warrington £259,000 £1,209,000 £830,000 220.5% 152 118<br />
Warwick* £418,466 £740,000 £834,000 99.3% 151 30<br />
Warwickshire £639,000 £2,400,000 £2,400,000 275.6% 55 31<br />
Watford £540,644 £520,000 £475,000 -12.1% 209 364<br />
Waveney* £289,000 £467,000 £505,000 74.7% 205 233<br />
Waverley £211,000 £324,000 £319,000 51.2% 267 231<br />
Wealden £152,909 £92,000 £83,000 -45.7% 422 170<br />
Wear Valley* - £200,000 £179,000 - 337 398<br />
Wellingborough - £112,000 £115,000 - 392 376<br />
Welwyn Hatfield* £137,588 £183,693 £175,670 27.7% 339 271<br />
West Berkshire - £840,631 £980,775 - 135 164<br />
West Devon £48,492 £70,691 £71,900 48.3% 429 418<br />
West Dorset £272,000 £406,000 £470,000 72.8% 210 293<br />
West<br />
Dunbartonshire £59,000 £310,685 £219,136 271.4% 309 318<br />
West Lancashire £307,000 £293,000 £221,000 -28.0% 306 260<br />
West Lindsey - £203,000 £177,000 - 338 334<br />
West Lothian £618,000 £747,000 £758,000 22.7% 162 140<br />
West Oxfordshire £216,615 £249,107 £173,572 -19.9% 345 282<br />
West Somerset - £21,000 £4,000 - 444 434<br />
West Sussex*** - £2,694,000 £2,625,000 - 45 12<br />
West Wiltshire - £430,197 £372,673 - 247 210<br />
Westminster - £3,277,000 £3,130,000 - 31 89<br />
Weymouth and -<br />
Portland<br />
£81,000 £98,000 - 410 393<br />
Wigan £816,000 £1,345,000 £1,448,000 77.5% 104 57<br />
Wiltshire £639,000 £2,776,000 £3,071,000 380.6% 32 40<br />
Winchester £163,327 £561,000 £439,000 168.8% 216 254<br />
Windsor and<br />
£157,440<br />
Maidenhead<br />
£693,000 £823,000 422.7% 153 175<br />
Wirral £594,000 £1,435,000 £1,529,000 157.4% 96 54<br />
Woking* £186,525 £496,350 £528,977 183.6% 199 156<br />
Wokingham £213,000 £507,000 £642,000 201.4% 180 157<br />
Wolverhampton £1,080,000 £2,695,000 £2,456,000 127.4% 52 88<br />
Worcester - £153,000 £159,000 - 353 306<br />
Worcestershire - £3,716,000 £3,443,000 - 26 27<br />
Worthing £236,564 £344,406 £374,337 58.2% 245 289<br />
Wrexham £348,035 £991,000 £886,000 154.6% 141 199<br />
Wychavon £239,048 £298,695 £324,444 35.7% 263 234<br />
43 Old Queen Street, London SW1H 9JA www.taxpayersalliance.com<br />
0845 330 9554 (office hours) 07795 084 113 (media – 24 hours)<br />
22
Council Spending on publicity, £ Increase,<br />
%<br />
Publicity<br />
spending,<br />
ranking<br />
Size of total<br />
population,<br />
ranking<br />
1996-97 2006-07 2007-08 1996-97 to<br />
2007-08<br />
2007-08 2007-08<br />
Wycombe - £88,234 £120,817 - 385 149<br />
Wyre - £133,025 £108,483 - 401 257<br />
Wyre Forest £258,310 £330,880 £343,140 32.8% 255 291<br />
York £1,397,000 £1,654,000 £1,832,000 31.1% 76 119<br />
Total £156,905,228 £446,482,748 £429,818,050<br />
Average £429,877 £954,023 £965,986<br />
*2007-08 data available only in a draft Statement of Accounts<br />
***Figure for 2007-08 shown is from a draft Statement of Accounts and appears to have an error in<br />
punctuation. <strong>The</strong> figure shown is 2.625 (£,000) but this appears to be a typo for a true figure of<br />
2,625. <strong>The</strong> figure shown has been verified by the West Sussex Council finance division.<br />
****Figure quoted is from the 1997-98 accounts<br />
43 Old Queen Street, London SW1H 9JA www.taxpayersalliance.com<br />
0845 330 9554 (office hours) 07795 084 113 (media – 24 hours)<br />
23


