The Case Against Further Green Taxes - The TaxPayers' Alliance
The Case Against Further Green Taxes - The TaxPayers' Alliance
The Case Against Further Green Taxes - The TaxPayers' Alliance

Create successful ePaper yourself
Turn your PDF publications into a flip-book with our unique Google optimized e-Paper software.
dAFT<br />
www.taxpayersalliance.com<br />
THE CASE AGAINST<br />
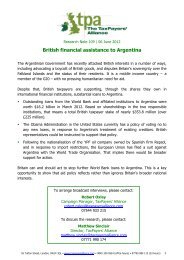
FURTHER GREEN TAXES<br />
Corin Taylor and Matthew Sinclair<br />
Foreword by Matthew Elliott
Contents<br />
Foreword 3<br />
Executive Summary 4<br />
1. <strong>The</strong> big picture 7<br />
2. Fuel Duty and Vehicle Excise Duty 13<br />
3. Climate Change Levy 16<br />
4. Air Passenger Duty 22<br />
5. “Bin taxes” and the Landfill Tax 24<br />
6. Emissions trading 28<br />
7. Conclusion 31<br />
Appendix 32<br />
43 Old Queen Street, London SW1H 9JA www.taxpayersalliance.com<br />
0845 330 9554 (office hours) 07795 084 113 (media – 24 hours)<br />
2
Foreword<br />
<strong>Green</strong> taxes have become enormously popular amongst all the main political<br />
parties in recent months. <strong>The</strong> Government has doubled Air Passenger Duty,<br />
the Conservatives have indicated that they will “rebalance” the tax system<br />
from taxing income to taxing carbon emissions, and the Liberal Democrats<br />
have proposed raising Vehicle Excise Duty for the most polluting vehicles to<br />
£2,000 a year. <strong>The</strong> forthcoming Quality of Life policy group, chaired by John<br />
Gummer and Zac Goldsmith, is also expected to put forward plans for<br />
environmental taxes later this month.<br />
Calling for new or higher green taxes allows politicians to portray themselves<br />
as responsible defenders of the environment. Higher green taxes can also<br />
be sold as a sensible economic move towards taxing “bads”, such as CO 2<br />
emissions or landfill waste, rather than “goods” like corporate profit or<br />
earned income.<br />
To date, no proper cost-benefit analysis of green taxes has been carried out,<br />
probably because of the strength of feeling over the potential dangers of<br />
global warming. <strong>The</strong> <strong>TaxPayers'</strong> <strong>Alliance</strong> neither holds nor expresses an<br />
opinion on the science behind climate change – this report is not an attempt<br />
to address the scientific case for or against the idea that global warming<br />
exists, is caused by humans or will have serious effects.<br />
This report takes at face value the conclusions of experts in the field from<br />
the Intergovernmental Panel on Climate Change to academics such as<br />
William Nordhaus, the “father of climate change economics”, and more<br />
pessimistic studies such as the report produced by Sir Nicholas Stern for the<br />
Treasury. Our approach is to compare these studies’ recommendations of<br />
the price we should be prepared to pay to combat climate change with the<br />
actual state of British climate change policy. Such a comparison is the only<br />
way of knowing whether environmental taxes address root problems or<br />
whether they merely form a new revenue-stream for HM Treasury.<br />
Our new audit also casts doubt on the rosy picture of green taxes that has<br />
often been presented. <strong>Green</strong> taxes and charges are not always a benign<br />
alternative to more traditional forms of taxation: they can impose substantial<br />
costs on, amongst others, Northern manufacturers, the NHS and the less<br />
well-off.<br />
This report raises serious questions about the merits of imposing new or<br />
higher environmental taxes. We hope that politicians of all parties will take<br />
our findings seriously.<br />
Matthew Elliott<br />
Chief Executive, <strong>TaxPayers'</strong> <strong>Alliance</strong><br />
September 2007<br />
43 Old Queen Street, London SW1H 9JA www.taxpayersalliance.com<br />
0845 330 9554 (office hours) 07795 084 113 (media – 24 hours)<br />
3
Executive Summary<br />
This paper presents a case against the imposition of further green taxes in<br />
the United Kingdom. For the first time it outlines the negative impact of<br />
environmental taxes on consumers, businesses and public sector<br />
organisations such as the NHS; shows how many of these taxes already<br />
exceed the level necessary to meet academic and official estimates of the<br />
social cost of carbon emissions; and reveals that others may be ineffective or<br />
even be counter-productive.<br />
<strong>The</strong> key overall finding is startling in its implications. Taking an average of<br />
the most widely quoted official and academic estimates of the social cost of<br />
CO 2 emissions shows that green taxes in the UK are already well in excess of<br />
the level they need to be to meet these social costs:<br />
Taking an average of official and academic estimates of the social costs<br />
of CO 2 emissions, the social cost of Britain’s entire output of CO 2 was<br />
£11.7 billion in 2005 (the latest year for which full data is available).<br />
In 2005-06, the total burden of green taxes and charges – Fuel Duty and<br />
Vehicle Excise Duty (net of road spending), Climate Change Levy, Landfill<br />
Tax and the net cost of the EU Emissions Trading Scheme – was £21.9<br />
billion. (This figure excludes Air Passenger Duty as emissions from<br />
international aviation are not included in national CO 2 emissions totals.)<br />
This means that green taxes and charges are already £10.2 billion in<br />
excess of the level they need to be to meet the social cost of Britain’s CO 2<br />
emissions. This excess is equivalent to over £400 for each household in<br />
Britain. <strong>Green</strong> taxes are therefore already too high if they really are a<br />
means of internalising environmental externalities rather than simply<br />
revenue-raising measures.<br />
This paper investigates each of the green taxes and charges in turn and<br />
reveals that each one has serious flaws. Because there has been so little<br />
debate on the efficacy of green taxes until now, any new green taxes are<br />
likely to have similar problems.<br />
Fuel Duty and Vehicle Excise Duty<br />
Fuel Duty, currently over 50p per litre of regular unleaded petrol, and<br />
Vehicle Excise Duty raise almost £20 billion above the amount spent on<br />
roads. This is between 3.6 and 40.9 times higher than the level needed<br />
to ensure that drivers cover the official and academic estimates of the<br />
social cost of CO 2 emissions, costing each motorist an average of<br />
between £548 and £743 each year.<br />
Ignoring road spending, Fuel Duty alone raises more than five times the<br />
Intergovernmental Panel on Climate Change’s estimate of the social cost<br />
of Britain’s entire annual output of CO 2 emissions.<br />
43 Old Queen Street, London SW1H 9JA www.taxpayersalliance.com<br />
0845 330 9554 (office hours) 07795 084 113 (media – 24 hours)<br />
4
<strong>Further</strong> increases in taxation on motorists are not justified on<br />
environmental grounds; indeed, Fuel Duty and Vehicle Excise Duty should<br />
actually be significantly reduced.<br />
Given that middle class and poorer households spend proportionately<br />
more on motor oils (including petrol) than richer households, reducing<br />
Fuel Duty would be a progressive move.<br />
Climate Change Levy<br />
Under the Climate Change Levy, which taxes the use of energy in<br />
industry, commerce and the public sector, the North East, England’s<br />
poorest region, pays over 35 per cent more as a proportion of regional<br />
Gross Value Added than the South East, England’s richest region outside<br />
London.<br />
<strong>The</strong> Climate Change Levy is contributing to the continuing decline in<br />
manufacturing, with 1 million manufacturing jobs lost since the levy was<br />
introduced.<br />
Air Passenger Duty<br />
<strong>The</strong> doubling of Air Passenger Duty announced in last year’s Pre-Budget<br />
Report, from £5 to £10 for an economy short-haul flight and from £20 to<br />
£40 for an economy long-haul flight, is actually likely to have increased<br />
total emissions from air travel, incentivising longer flights within the<br />
short-haul and long-haul bands.<br />
We also estimate that the levy costs the tourist industry £156 million a<br />
year.<br />
“Bin taxes” and the Landfill Tax<br />
Planned local authority taxes on rubbish collection, supported by central<br />
government and the EU Landfill Directive, could cost up to £1,000 a year<br />
per household.<br />
Comparison with the introduction of parking charges in the 1990s shows<br />
that “bin taxes” will not be a substitute for a portion of council tax, but<br />
will represent yet another supplementary charge on stretched household<br />
finances.<br />
Landfill Tax, which has been increased a number of times by the current<br />
government, is already raising up to £620 million more than would be<br />
sufficient to meet the social costs of methane emissions from landfill.<br />
Emissions trading<br />
One of the main effects of emissions trading schemes will be to transfer<br />
emissions from firms operating within the scheme to firms in other<br />
countries. To the extent that the overseas firms are less energy-efficient<br />
43 Old Queen Street, London SW1H 9JA www.taxpayersalliance.com<br />
0845 330 9554 (office hours) 07795 084 113 (media – 24 hours)<br />
5
(emitting a greater quantity of emissions for each unit of output), the net<br />
effect of emissions trading schemes may actually be to increase global<br />
emissions.<br />
<strong>The</strong> EU’s Emissions Trading Scheme has resulted in an annual £470<br />
million subsidy from the UK to the majority of EU countries that have not<br />
placed strict targets for overall reductions in emissions.<br />
<strong>The</strong> Emissions Trading Scheme has allowed a number of oil companies to<br />
make multi-million-pound profits while at the same time costing the NHS<br />
nearly £6 million.<br />
Measures which increase the price of domestic electricity are highly<br />
regressive, given that poorer households pay a far greater proportion of<br />
their income on electricity than richer households.<br />
In many cases, green taxes are failing to meet their objectives, are set at a<br />
level in excess of that needed to meet the social cost of Britain’s CO 2<br />
emissions, and are causing serious harm to areas of the country and<br />
industries least able to cope. <strong>Green</strong> taxes should not be seen as a benign<br />
alternative to taxation of income and profits. Plans for new green taxes need<br />
a serious re-think.<br />
43 Old Queen Street, London SW1H 9JA www.taxpayersalliance.com<br />
0845 330 9554 (office hours) 07795 084 113 (media – 24 hours)<br />
6
1. <strong>The</strong> big picture<br />
Before we analyse individual green taxes and charges currently used to cut<br />
the emissions of greenhouse gases in the UK, one question needs answering.<br />
When all greenhouse gas emissions from the UK are compared to the total<br />
burden of green taxes and charges, how do they compare?<br />
<strong>The</strong> rationale behind green taxes is that the untaxed prices of fossil fuels do<br />
not capture the “social cost” of CO 2 (and other) emissions, and therefore<br />
green taxes need to fill the gap. <strong>The</strong> correct policy under this logic is to set<br />
green taxes at the social cost of CO 2 .<br />
Box 1.1: Why is the “social cost” important?<br />
<strong>The</strong> social cost of CO 2 emissions represents the value of the harm done to the rest of<br />
the world, now and in the future, by emitting one tonne of CO 2 . <strong>Green</strong> taxes can<br />
reduce the quantity of CO 2 emitted in an economy by making activities that result in<br />
emissions more expensive. If a green tax is set at the true social cost then the socially<br />
optimum amount of carbon will be emitted, i.e. emissions will be cut until the costs of<br />
emitting less are equal to the environmental benefits.<br />
In this way, the social cost can be used as a guide for an appropriate level of tax to<br />
correct for the negative externalities that CO 2 emissions entail. <strong>The</strong> Intergovernmental<br />
Panel on Climate Change states that “if taxes were used, then they should be set equal<br />
to the SCC [social cost of carbon]”. 1<br />
A number of academic and official estimates of the social cost of CO 2<br />
emissions exist. <strong>The</strong> most widely-quoted estimates are summarised below:<br />
Nordhaus (2007). William D Nordhaus is Stirling<br />
Professor of Economics at Yale University and a member<br />
of the National Academy of Sciences. He was a member<br />
of the Council of Economic Advisers to the Carter<br />
administration in the late 1970s. <strong>The</strong> Economist has<br />
described him as the “father of climate-change<br />
economics”. 2 His 2007 study is based upon a model<br />
which has been refined over more than 30 years.<br />
Intergovernmental Panel on Climate Change (IPCC)<br />
(2007). <strong>The</strong> United Nations body established in 1988<br />
that is generally described as the “scientific consensus”<br />
on climate change. Its estimate of the social cost of CO 2<br />
is an average (mean) of over 100 peer-reviewed studies.<br />
1 Parry M.L., O.F. Canziani, J.P. Palutikof, P.J. van der Linden and C.E. Hanson, Eds., 2007, Climate<br />
Change 2007: Impacts, Adaptation and Vulnerability. Contribution of Working Group II to the Fourth<br />
Assessment Report of the Intergovernmental Panel on Climate Change, Cambridge University Press,<br />
Cambridge, UK.<br />
2 Economist, “How to value a grandchild”, December 2006<br />
43 Old Queen Street, London SW1H 9JA www.taxpayersalliance.com<br />
0845 330 9554 (office hours) 07795 084 113 (media – 24 hours)<br />
7
Tol (2005). Richard Tol is Senior Research Officer at the<br />
Economic and Social Research Institute in Dublin,<br />
Principle Researcher at the Institute for Environmental<br />
Studies in Amsterdam and Adjunct Professor at the<br />
Department of Engineering and Public Policy of the<br />
Carnegie Mellon University in Pittsburg. He is an author<br />
(contributing, lead, principle and convening) of Working<br />
Groups I, II and III of the Intergovernmental Panel on<br />
Climate Change. His estimate of the social cost of CO 2 is<br />
an average (mean) of 103 estimates from 28 published<br />
studies.<br />
Stern (2006). Sir Nicholas Stern was Chief Economist<br />
and Senior Vice President of the World Bank between<br />
2000 and 2003. Between 2003 and 2005 he was Second<br />
Permanent Secretary at HM Treasury with responsibility<br />
for public finances and the Government Economic<br />
Service. He was commissioned by HM Treasury in July<br />
2005 to review the economics of climate change.<br />
Table 1.1: Estimates of the social cost of one tonne of CO 2 emissions 3<br />
Organisation/<br />
person<br />
Social cost of<br />
carbon, per tonne, $<br />
Social cost of<br />
CO 2 , per tonne, $<br />
Social cost of CO 2 ,<br />
per tonne, £<br />
Nordhaus (2007) N/A $7.40 £4.07<br />
IPCC (2007) N/A $12.00 £6.59<br />
Tol (2005) $93.00 $25.38 £13.94<br />
Stern (2006) N/A $85.00 £46.70<br />
Given the amount of CO 2 -equivalent greenhouse gas produced by the UK in<br />
2005, a range of estimates of the total social cost of greenhouse gas<br />
emissions can be generated based on estimates of the social cost of carbon<br />
shown in Table 1.1. Figures for 2005 are used as this is the latest year for<br />
which full energy use data is available. <strong>The</strong>se estimates range from £2.7<br />
billion to £30.5 billion (NB: Figures throughout the report are generally<br />
rounded to the nearest £0.1 billion.)<br />
3 Nordhaus, W. “<strong>The</strong> Challenge of Global Warming: Economic Models and Environmental Policy”, July<br />
2007, http://nordhaus.econ.yale.edu/dice_mss_072407_all.pdf; Intergovernmental Panel on Climate<br />
Change, “Climate Change 2007: Impacts, Adaptation and Vulnerability”, April 2007,<br />
http://www.ipcc.ch/SPM13apr07.pdf on 05/06/2007; Tol, R. S. J. “<strong>The</strong> marginal damage costs of<br />
carbon dioxide emissions: an assessment of the uncertainties”, Energy Policy, Volume 33, Issue 16,<br />
November 2005; Stern, N. et. al. “Stern Review: <strong>The</strong> Economics of Climate Change”, HM Treasury,<br />
2006. <strong>The</strong> estimates given in the reports are expressed in USD, and have been converted to GBP<br />
using the 2005 (same year as the latest year for which full emissions data is available) conversion rate<br />
of USD 1.82 = GBP 1 (Lawrence H. Officer, "Exchange rate between the United States dollar and the<br />
British pound, 1791-2005" Economic History Services, EH.Net, 2006<br />
http://eh.net/hmit/exchangerates/pound.php). <strong>The</strong> Tol estimate uses the social cost per tonne of<br />
carbon, which has been converted to the social cost per tonne of CO 2 by a ratio of 100:27.29 (1 tonne<br />
of CO 2 contains 0.2729 tonnes of carbon – see IPCC report, op. cit.).<br />
43 Old Queen Street, London SW1H 9JA www.taxpayersalliance.com<br />
0845 330 9554 (office hours) 07795 084 113 (media – 24 hours)<br />
8
Table 1.2: Estimates of the social cost of UK greenhouse gas emissions 4<br />
Organisation/<br />
person<br />
CO 2 equivalent<br />
emissions from UK,<br />
2005, millions of<br />
tonnes<br />
Social cost of<br />
CO 2 , per<br />
tonne, £<br />
Social cost of total UK<br />
greenhouse gas<br />
emissions, 2005,<br />
£ billion<br />
Nordhaus 654 million £4.07 £2.7 billion<br />
IPCC 654 million £6.59 £4.3 billion<br />
Tol 654 million £13.94 £9.1 billion<br />
Stern 654 million £46.70 £30.5 billion<br />
Average £17.83 £11.7 billion<br />
<strong>The</strong>se social cost estimates can be compared with the net burden of green<br />
taxes and charges of £21.9 billion in the corresponding year (2005-06):<br />
This is net of road spending of £8.4 billion in 2005-06. 5 Public spending<br />
on roads can be seen as a subsidy to road transport, which should<br />
therefore be set against Fuel Duty and Vehicle Excise Duty.<br />
Air Passenger Duty has been left out as international aviation is not<br />
included in national greenhouse gas emissions totals. Emissions from<br />
domestic aviation are, however, included in national CO 2 emissions totals<br />
– our estimates, by not including Air Passenger Duty at all, are therefore<br />
on the conservative side.<br />
Table 1.3: <strong>The</strong> net burden of green taxes and charges in 2005-06 6<br />
<strong>Green</strong> tax/charge<br />
Fuel Duty<br />
Vehicle Excise Duty<br />
Landfill Tax<br />
Climate Change Levy<br />
EU Emissions Trading Scheme net<br />
contribution<br />
Sub-total<br />
Less spending on roads<br />
Total<br />
Revenue, 2005-06, £ billion<br />
£23.4 billion<br />
£5.0 billion<br />
£0.7 billion<br />
£0.7 billion<br />
£0.5 billion<br />
£30.3 billion<br />
£8.4 billion<br />
£21.9 billion<br />
4 DEFRA, “e-Digest Statistics about: Climate Change – UK Emissions of <strong>Green</strong>house Gases”, January<br />
2007, http://www.defra.gov.uk/environment/statistics/globatmos/gagccukem.htm<br />
5 HM Treasury, Public Expenditure Statistical Analyses 2007, April 2007, Table 5.2. Roads spending is<br />
the sum of “national roads”; “local roads”; “other road transport”.<br />
6 HM Treasury, “Budget 2007”, March 2007 and Open Europe, “<strong>The</strong> high price of hot air: Why the EU<br />
Emissions Trading Scheme is an environmental and economic failure”, July 2006<br />
43 Old Queen Street, London SW1H 9JA www.taxpayersalliance.com<br />
0845 330 9554 (office hours) 07795 084 113 (media – 24 hours)<br />
9
Table 1.4: Social cost of UK greenhouse gas emissions compared with the<br />
net burden of green taxes and charges<br />
Organisation/<br />
person<br />
Social cost of<br />
total UK<br />
greenhouse gas<br />
emissions, 2005,<br />
£ billion<br />
Net burden of<br />
green taxes<br />
and charges,<br />
2005-06,<br />
£ billion<br />
<strong>Green</strong> taxes and charges<br />
in excess of social cost of<br />
greenhouse gas emissions<br />
from UK, 2005,<br />
£ billion<br />
Nordhaus £2.7 billion £21.9 billion £19.1 billion<br />
IPCC £4.3 billion £21.9 billion £17.5 billion<br />
Tol £9.1 billion £21.9 billion £12.7 billion<br />
Stern £30.5 billion £21.9 billion -£8.7 billion<br />
Average £11.7 billion £10.2 billion<br />
Table 1.5: Discrepancy between social cost of emissions and green taxes per<br />
household<br />
Organisation/<br />
person<br />
<strong>Green</strong> taxes and charges in<br />
excess of social cost of<br />
greenhouse gas emissions<br />
from UK, 2005,<br />
£ billion<br />
Number of<br />
households,<br />
million 7<br />
Excess green<br />
taxes per<br />
household,<br />
2005, £<br />
Nordhaus £19.1 billion 25.29 million £757.64<br />
IPCC £17.5 billion 25.29 million £692.46<br />
Tol £12.7 billion 25.29 million £502.35<br />
Stern -£8.7 billion 25.29 million -£344.99<br />
Average £10.2 billion £401.87<br />
This comparison shows that only under Stern’s particularly high social cost<br />
estimate are green taxes and charges not already sufficient to account for<br />
total UK greenhouse gas emissions. In fact, the average difference is so<br />
large that reducing green taxes and charges to the amount needed to<br />
internalise the social cost of emissions actually requires a tax reduction of<br />
nearly £10.2 billion or over £400 per UK household.<br />
Box 1.2 on p.11 gives details of the negative effects of setting green taxes<br />
above the social cost of carbon.<br />
Box 1.3 on p.12 shows why the estimate of the social cost of carbon<br />
emissions given by Stern should be seen as less credible than the other,<br />
lower, estimates, such as that from the Intergovernmental Panel on Climate<br />
Change. By including Stern’s social cost figures, our report produces a<br />
cautious estimate of how far green taxes are already in excess of the level<br />
needed to cover Britain’s CO 2 emissions.<br />
7 Source: Office of the Deputy Prime Minister; National Assembly for Wales and Scottish Executive<br />
43 Old Queen Street, London SW1H 9JA www.taxpayersalliance.com<br />
0845 330 9554 (office hours) 07795 084 113 (media – 24 hours)<br />
10
Box 1.2: Negative effects of setting green taxes above the<br />
social cost of carbon<br />
Unfairness<br />
<br />
<br />
<br />
All of the products subject to “green taxes” also pay VAT. Often, as with fuel duty,<br />
VAT will actually be charged on the post-“green tax” price which magnifies the<br />
green tax’s effect and results in an effective double taxation. Companies that pay<br />
green taxes like the Climate Change Levy or pay for credits under the EU Emissions<br />
Trading Scheme also pay other corporate taxes. <strong>The</strong>y have paid their way.<br />
While it is possible to justify singling out consumers of carbon-emitting products and<br />
carbon-emitting companies in order to offset the social cost of carbon, taxing them<br />
radically more, as is the case for motorists with Fuel Duty for example, is unjust.<br />
This unfairness is compounded by the fact that these taxes are often regressive.<br />
<strong>The</strong>y either hit the poorest regions disproportionately, as with the Climate Change<br />
Levy, or poorer people, as with Fuel Duty.<br />
Economic Distortion<br />
<br />
<br />
By putting disproportionate taxes on particular industries excess green taxes (i.e.<br />
green taxes set above the social cost of carbon) distort the economy. Successful<br />
industries and technologies will increasingly be the ones that manage to avoid the<br />
excess green taxes rather than those that make economic sense.<br />
One example of such a distortion, discussed in more detail in Chapter 3, is a shift in<br />
taxation which will particularly hurt manufacturing firms. This will exacerbate<br />
existing trends and cause all the serious social problems that are associated with<br />
industries and regions in decline.<br />
Competitiveness<br />
<br />
<br />
Many other countries have imposed no green taxes at all and most others have not<br />
imposed green taxes at rates as high as Britain's. <strong>The</strong> difference can be seen most<br />
clearly with the EU Emissions Trading Scheme where other countries set much lower<br />
targets and, hence, placed far less of a burden upon their industries.<br />
<strong>The</strong> difference in the burden of green taxation between Britain and other countries<br />
will result in British firms finding it harder to compete with other firms abroad.<br />
<strong>Green</strong> taxes may even make them unable to compete with foreign firms that put out<br />
greater quantities of greenhouse gases. This would lead to increased global<br />
emissions.<br />
Efficiency<br />
Many green taxes are highly inefficient. <strong>The</strong>y cause relatively large social and<br />
economic harms for a given amount of income raised. One example is Air<br />
Passenger Duty which discourages foreign tourists from visiting Britain. Another<br />
example is the EU Emissions Trading Scheme which creates huge administrative<br />
costs. Both of these examples are discussed in the relevant chapters of this report.<br />
43 Old Queen Street, London SW1H 9JA www.taxpayersalliance.com<br />
0845 330 9554 (office hours) 07795 084 113 (media – 24 hours)<br />
11
Box 1.3: Stern versus the IPCC<br />
Our report uses a linear average of four studies which assess the social cost of carbon:<br />
Nordhaus (2007), the Intergovernmental Panel on Climate Change (2007), Tol (2005)<br />
and Stern (2006). This average accounts for a range of views between the estimates of<br />
Nordhaus, “father of climate change economics”, the IPCC, the body usually cited as the<br />
“scientific consensus” view of climate change, and Stern’s outlier estimate.<br />
However, by treating the extremely high estimate of social cost arrived at in the Stern<br />
report as equally credible to the IPCC and other estimates we are probably giving a<br />
distinctly cautious estimate of the extent to which green taxes in Britain are excessive.<br />
Another approach would be to use the IPCC estimate of the social cost of CO 2<br />
emissions. This would mean significantly larger estimates of how excessive British<br />
green taxes are, as can be seen from the tables throughout this report.<br />
<strong>The</strong> IPCC<br />
<br />
<br />
<strong>The</strong> United Nations body usually cited as the “scientific consensus” on climate<br />
change. Most of the criticism it has received has been from sceptics of<br />
anthropogenic global warming, who would certainly not believe that its estimate of<br />
social cost is too low.<br />
Stern<br />
<br />
Estimate of the social cost of carbon based upon an average of over 100 peerreviewed<br />
academic estimates of social cost.<br />
A temporary British government team established by the Treasury in July 2005. Its<br />
final report has received criticism from “eminent” climate-change economist Richard<br />
Tol and the “father of climate-change economics” William Nordhaus (descriptions<br />
from the Economist 8 ):<br />
Nordhaus: 9<br />
- Pointed out that the study’s conclusions rely entirely upon a controversial ethical<br />
assumption, that utility should be treated as equally valuable across generations.<br />
- This assumption appears not to be shared by ordinary people who discount<br />
utility over time when, for example, planning what to leave to their children.<br />
- A majority of the harms described in Stern occur after 2800. Under the same<br />
logic of taking costly action to prevent uncertain harms far into the future<br />
extreme positions could be justified in, for example, foreign policy.<br />
Tol (frequently cited within the Stern report): 10<br />
- Called the study “alarmist and incompetent”.<br />
- Described how the study takes no account of the potential of adaptation to<br />
minimise the harms of climate change.<br />
- Accused the report of “cherry-picking”, always taking the most pessimistic<br />
estimates of potential damage from the reports it studied.<br />
- Noted that Stern’s social cost estimate is an outlier in the marginal damage cost<br />
literature and little explanation is given to justify such an extreme estimate.<br />
8 Economist, “How to value a grandchild”, December 2006<br />
9 Nordhaus, W. “<strong>The</strong> Stern Review on the Economics of Climate Change”, May 2007<br />
10 Tol, R. S. J. “<strong>The</strong> Stern Review of the Economics of Climate Change: A Comment”, November 2006,<br />
http://www.fnu.zmaw.de/fileadmin/fnu-files/reports/sternreview.pdf<br />
43 Old Queen Street, London SW1H 9JA www.taxpayersalliance.com<br />
0845 330 9554 (office hours) 07795 084 113 (media – 24 hours)<br />
12
2. Fuel Duty and Vehicle Excise Duty<br />
Fuel duty is the largest indirect tax after VAT and raises £23.6 billion a year,<br />
£901 per motorist in the United Kingdom. 11 Vehicle Excise Duty raises a<br />
further £5.1 billion, bringing the total revenue raised from motoring taxes to<br />
£28.7 billion, £1,095 per motorist. 12<br />
Table 2.1: Revenue raised from motoring taxes 13<br />
Year<br />
Fuel Duty revenue,<br />
£ billion<br />
Vehicle Excise Duty<br />
revenue, £ billion<br />
Total, £ billion<br />
2005-06 £23.4 billion £5.0 billion £28.4 billion<br />
2006-07 £23.6 billion £5.1 billion £28.7 billion<br />
Part of the revenue raised by Fuel Duty and Vehicle Excise Duty is spent on<br />
road building and maintenance, which can be seen as a subsidy to road<br />
transport. Motoring taxes, however, are far in excess of spending on roads;<br />
the difference amounts to around £755 per motorist.<br />
Table 2.2: Revenue raised from motoring taxes, net of road spending 14<br />
Year<br />
Total revenue from<br />
motoring taxes,<br />
£ billion<br />
Total road spending,<br />
£ billion<br />
Net motoring<br />
taxes, £ billion<br />
2005-06 £28.4 billion £8.4 billion £20.0 billion<br />
2006-07 £28.7 billion £8.9 billion £19.8 billion<br />
Earlier assessments of whether motoring taxes are set at the appropriate<br />
level have compared them to a range of different externalities from noise to<br />
air pollution and congestion: 15<br />
Noise and air pollution are created by a vast spectrum of industrial<br />
activity. <strong>The</strong>y are controlled by regulation which limits acceptable levels<br />
of noise and particle emissions in different geographical areas. If Fuel<br />
Duty is intended to correct for these localised externalities then two<br />
questions need to be asked. Why is road transport taxed for localised<br />
externalities while other industries are not? And, if these externalities are<br />
being corrected for by motoring taxes, why are they also regulated?<br />
By far the largest externality identified in the earlier study is congestion.<br />
<strong>The</strong>re are problems with using Fuel Duty or Vehicle Excise Duty to correct<br />
for congestion. First, the taxes do not alter by the time of day or the<br />
location of the road. Second, the costs of congestion are internalised<br />
11 WhatCar? “Number of cars on UK roads increases”, March 2006<br />
12 Ibid.<br />
13 HM Treasury, Budget 2007, Table C8: Current receipts, March 2007.<br />
14 HM Treasury, Public Expenditure Statistical Analyses 2007, April 2007<br />
15 Leicester, A. “<strong>The</strong> UK Tax System and the Environment”, Institute for Fiscal Studies, November<br />
2006. http://www.ifs.org.uk/comms/r68.pdf<br />
43 Old Queen Street, London SW1H 9JA www.taxpayersalliance.com<br />
0845 330 9554 (office hours) 07795 084 113 (media – 24 hours)<br />
13
within the body of road users and create an incentive to use other<br />
methods of travel, as such they are not a pure externality.<br />
<strong>The</strong> only externality that Fuel Duty and Vehicle Excise Duty can effectively<br />
correct for is CO 2 emissions by raising the cost of road fuels and of owning a<br />
car.<br />
<strong>The</strong> social costs of CO 2 emissions given in Table 1.1 can be compared with<br />
CO 2 emissions from road transport and revenue raised from Fuel Duty and<br />
Vehicle Excise Duty, net of road spending.<br />
Given the number of tonnes of CO 2 emissions currently produced by UK road<br />
transport, a range of estimates of the total social cost of UK road transport<br />
CO 2 emissions can be generated. <strong>The</strong>se estimates range from £488 million<br />
to £5.6 billion.<br />
Table 2.3: Estimates of the social cost of CO 2 from UK road transport 16<br />
Organisation/<br />
person<br />
Social cost of<br />
CO 2 , per tonne, £<br />
CO 2 emissions<br />
from UK road<br />
transport, 2005,<br />
millions of tonnes<br />
Social cost of CO 2<br />
emissions from UK road<br />
transport, 2005,<br />
£ billion<br />
Nordhaus £4.07 119.9 million £0.5 billion<br />
IPCC £6.59 119.9 million £0.8 billion<br />
Tol £13.94 119.9 million £1.7 billion<br />
Stern £46.70 119.9 million £5.6 billion<br />
This range of social cost estimates can then be compared with the £20 billion<br />
raised from Fuel Duty and Vehicle Excise Duty, net of road spending, in the<br />
corresponding year.<br />
Table 2.4: Social cost of UK road transport compared with Fuel Duty revenue<br />
Organisation/<br />
person<br />
Social cost of CO 2<br />
emissions from UK<br />
road transport, 2005,<br />
£ billion<br />
Net motoring<br />
taxes, 2005-06,<br />
£ billion<br />
Net motoring taxes/<br />
Social cost of CO 2<br />
emissions from UK<br />
road transport, 2005<br />
Nordhaus £0.5 billion £20.0 billion 40.9<br />
IPCC £0.8 billion £20.0 billion 25.2<br />
Tol £1.7 billion £20.0 billion 11.9<br />
Stern £5.6 billion £20.0 billion 3.6<br />
Such a comparison shows that net motoring taxes are between 3.6 and 40.9<br />
times the level needed to correct for the negative externality of CO 2<br />
emissions, meaning that the average motorist is paying between £548 and<br />
£743 each year in excess motoring taxes. <strong>The</strong>refore, the current level of tax<br />
16 DEFRA, “e-Digest Statistics about: Climate Change – UK Emissions of <strong>Green</strong>house Gases”, January<br />
2007, http://www.defra.gov.uk/environment/statistics/globatmos/gagccukem.htm<br />
43 Old Queen Street, London SW1H 9JA www.taxpayersalliance.com<br />
0845 330 9554 (office hours) 07795 084 113 (media – 24 hours)<br />
14
on road transport does not have an environmental justification and further<br />
rises would simply be a revenue-raising measure. Indeed, the estimates<br />
presented above suggest that Fuel Duty and Vehicle Excise Duty rates should<br />
actually be significantly reduced.<br />
Table 2.5: Excess Fuel Duty paid per motorist 17<br />
Organisation/<br />
person<br />
Net motoring taxes in<br />
excess of social cost of UK<br />
road transport CO 2<br />
emissions, 2005, £ billion<br />
Number of cars<br />
on the road,<br />
million<br />
Excess<br />
motoring taxes<br />
paid per<br />
motorist, 2005<br />
Nordhaus £19.5 billion 26.2 million £742.71<br />
IPCC £19.2 billion 26.2 million £731.17<br />
Tol £18.3 billion 26.2 million £697.54<br />
Stern £14.4 billion 26.2 million £547.68<br />
Average £17.8 billion £679.78<br />
As Fuel Duty and Vehicle Excise Duty raise so much more than can be<br />
justified on environmental grounds they should not be understood as green<br />
taxes. <strong>The</strong>y are just two more regressive taxes that take money,<br />
disproportionately from poorer people in Britain, 18 to go into the pot of<br />
general taxation. Reducing these taxes would be a progressive move.<br />
As Chart 2.1 below shows, middle class and poorer households spend more<br />
of their gross income on motor oils (including petrol) than richer households,<br />
meaning that they face a relatively higher Fuel Duty burden.<br />
Chart 2.1: Spending on motor oils as a percentage of gross weekly income<br />
by household income decile, 2005-06 19<br />
4.0%<br />
3.5%<br />
3.0%<br />
2.5%<br />
2.0%<br />
1.5%<br />
1.0%<br />
0.5%<br />
0.0%<br />
Bottom 2nd 3rd 4th 5th 6th 7th 8th 9th Top<br />
17 WhatCar? “Number of cars on UK roads increases”, March 2006<br />
18 Tindale, S. “Can the left learn to love the car?” Prospect Magazine, Issue 57, November 2000.<br />
19 Office for National Statistics, <strong>The</strong> Effects of <strong>Taxes</strong> and Benefits on Household Income 2005-06, Table<br />
24, Appendix 1; Office for National Statistics, Family Spending 2005-06, Table A8<br />
43 Old Queen Street, London SW1H 9JA www.taxpayersalliance.com<br />
0845 330 9554 (office hours) 07795 084 113 (media – 24 hours)<br />
15
3. Climate Change Levy<br />
On 1 April 2001 the government introduced the Climate Change Levy. Under<br />
the levy the use of energy in industry, commerce and the public sector is<br />
taxed. <strong>The</strong> rates vary depending upon the fuel being used. For very energyintensive<br />
sectors of the economy Climate Change Agreements can be<br />
negotiated which include a discount on the Climate Change Levy.<br />
<strong>The</strong> Climate Change Levy raised £772 million in 2004 (the latest year for<br />
which regional energy use figures are available). This charge was not<br />
supposed to represent a net cost to business as it was compensated with a<br />
cut in employer National Insurance Contributions. It can therefore be said to<br />
represent a prototype for the revenue-neutral shift towards green taxation<br />
that is being promoted across the political spectrum. But analysing the<br />
effect of the Climate Change Levy on the various regions in England presents<br />
a rather different picture.<br />
<strong>The</strong> amounts raised by the Climate Change Levy in different regions are not<br />
published. It is possible, however, to estimate the regional breakdown using<br />
official numbers for commercial and industrial energy usage by region. Total<br />
levies for each region are then estimated by multiplying the amount of<br />
energy from a given source by that source’s Climate Change Levy rate. That<br />
total is then divided by regional Gross Value Added (GVA), to give a raw<br />
amount for the regional Climate Change Levy without Climate Change<br />
Agreements. 20<br />
<strong>The</strong> totals are then adjusted for Climate Change Agreements using the raw<br />
Climate Change Levy/GVA estimate as a measure of the region’s energy<br />
intensity. This regional energy intensity is used as a proxy for the number<br />
and size of Climate Change Agreements. Each region’s levy estimate is<br />
reduced, in line with its energy intensity, until the total cost is the same as in<br />
the HMRC figures. 21<br />
20 NB: Liquefied Petroleum Gas (LPG) is not included in this survey as regional data on its commercial<br />
and industrial use is not available. This is not ideal but it is highly unlikely that the inclusion of LPG<br />
would make a significant difference to the results.<br />
21 DEFRA, Climate change agreements: <strong>The</strong> Climate Change Levy,<br />
http://www.defra.gov.uk/environment/climatechange/uk/business/ccl/intro.htm; Department for<br />
Business, Enterprise and Regulatory Reform, Regional Energy Consumption Statistics 2004,<br />
http://www.dti.gov.uk/energy/statistics/regional/; HMRC, Table T1.2a,<br />
http://www.hmrc.gov.uk/stats/tax_receipts/1_2a_dec05.pdf (2004-05 CCL revenue used).<br />
43 Old Queen Street, London SW1H 9JA www.taxpayersalliance.com<br />
0845 330 9554 (office hours) 07795 084 113 (media – 24 hours)<br />
16
Table 3.1: Regions with Climate Change Levy as a percentage of GVA<br />
Region<br />
Total Climate Change<br />
Levy payments, 2004,<br />
£ million<br />
Climate Change Levy as a<br />
% of regional GVA<br />
1 North East £32.4 million 0.094%<br />
2 Yorkshire £69.9 million 0.093%<br />
3 East Midlands £61.5 million 0.091%<br />
4 North West £92.2 million 0.090%<br />
5 West Midlands £71.6 million 0.088%<br />
6 South West £64.9 million 0.080%<br />
7 East of England £74.6 million 0.074%<br />
8 Greater London £120.7 million 0.070%<br />
9 South East £111.5 million 0.069%<br />
<strong>The</strong> final results show that this tax produces very real losers. Our estimates<br />
suggest that in 2004 under the Climate Change Levy the North East paid<br />
over 35 per cent more, as a proportion of regional GVA, than the South East.<br />
<strong>The</strong> map below shows our estimate of the Climate Change Levy as a<br />
proportion of Gross Value Added for the different regions in England. Each<br />
region is shaded with its brightness proportional to the share of GVA it pays<br />
under the Climate Change Levy. Darker areas pay more:<br />
Chart 3.1: Regional breakdown of charges under the Climate Change Levy,<br />
2004<br />
43 Old Queen Street, London SW1H 9JA www.taxpayersalliance.com<br />
0845 330 9554 (office hours) 07795 084 113 (media – 24 hours)<br />
17
<strong>The</strong>re is also a clear North-South divide, with the North and Midlands paying<br />
0.091 per cent of GVA and the South paying 0.072 per cent. <strong>The</strong> scale on<br />
Chart 2.2 may seem small but as it is a percentage of total regional income it<br />
represents millions of pounds. This percentage will only increase with any<br />
further revenue shift towards green taxation.<br />
Chart 3.2: <strong>The</strong> North-South Divide under the Climate Change Levy<br />
0.095%<br />
Climate Change Levy as % of GVA, 2004<br />
0.090%<br />
0.085%<br />
0.080%<br />
0.075%<br />
0.070%<br />
0.065%<br />
0.060%<br />
0.055%<br />
0.050%<br />
North<br />
South<br />
<strong>The</strong> Climate Change Levy has therefore hit businesses in the North hardest.<br />
<strong>The</strong> compensating reduction in employer National Insurance Contributions is<br />
spread evenly across all business so will not fully compensate Northern firms.<br />
Many of them compete with foreign companies in countries such as India<br />
and China that don’t face the levy so they cannot pass on the costs to<br />
retailers.<br />
Chart 3.3: Manufacturing Employment since the announcement of the<br />
Climate Change Levy 22<br />
Employment in manufacturing (thousands)<br />
5000<br />
4500<br />
4000<br />
3500<br />
3000<br />
2500<br />
2000<br />
1500<br />
1000<br />
500<br />
0<br />
1999 2000 2001 2002 2003 2004 2005 2006<br />
22 Office for National Statistics, Workforce jobs by industry (LOLO) time series,<br />
http://www.statistics.gov.uk/StatBase/tsdataset.asp?vlnk=495&More=N&All=Y<br />
43 Old Queen Street, London SW1H 9JA www.taxpayersalliance.com<br />
0845 330 9554 (office hours) 07795 084 113 (media – 24 hours)<br />
18
<strong>The</strong> Climate Change Levy has contributed to the continuing decline in<br />
manufacturing employment. Since the Climate Change Levy was announced<br />
manufacturing employment has declined by over one million jobs, from 4.4<br />
million to 3.3 million.<br />
One of the main effects of the levy will therefore be to transfer greenhouse<br />
emissions from firms operating in the UK to those operating overseas. To<br />
the extent that the overseas firms are less energy-efficient (emitting a<br />
greater quantity of emissions for each unit of output), the net effect of the<br />
Climate Change Levy may actually be to increase global emissions.<br />
<strong>The</strong> Climate Change Levy is seen as a benign, revenue-neutral way of<br />
reducing CO 2 emissions, and therefore as a prototype for future green taxes.<br />
In reality, it is a highly regressive tax on already struggling manufacturing<br />
industries in the North of England.<br />
Box 3.1 on pp.20-21 shows how the Climate Change Levy and other green<br />
taxes and charges can result in production shifting to other countries that<br />
may be less energy-efficient, which could lead to rises in global emissions.<br />
43 Old Queen Street, London SW1H 9JA www.taxpayersalliance.com<br />
0845 330 9554 (office hours) 07795 084 113 (media – 24 hours)<br />
19
Box 3.1: <strong>The</strong> dangers of exporting emissions<br />
<strong>The</strong>re are three possible ways that UK emissions can be reduced by green taxes:<br />
1. British firms produce the same with greater energy efficiency.<br />
2. Less is produced overall.<br />
3. Goods previously produced in Britain are instead produced abroad.<br />
<br />
<br />
<br />
<strong>The</strong> best result would be for British firms to produce the same with greater energy<br />
efficiency as it does not involve accepting economic damage:<br />
- Unfortunately, opportunities for firms faced by green taxes to make big<br />
efficiency gains are likely to be limited. Firms in competitive industries (many<br />
competing with firms in developing countries that have far lower labour costs)<br />
and facing high energy prices already have a big incentive to save money by<br />
using energy efficiently. This is particularly true in an economy like Britain’s<br />
which is relatively open to international competition.<br />
- A common method for assessing the plausible scope of efficiency savings is to<br />
look at international standards. Emissions intensity is one way of assessing how<br />
efficient, in terms of emissions, an economy is. By that measure British industry<br />
is already relatively efficient (see Table 3.2 below). Part of this will be due to<br />
Britain’s economy focussing more than others on service industries but it also<br />
suggests that many affordable efficiency savings have already been made in<br />
Britain.<br />
Industries that are not internationally competitive, for example road haulage, are<br />
likely to produce less overall as a result of environmental taxes. If green taxes<br />
make buying a product from British firms more expensive and there are no costeffective<br />
alternatives consumers may simply consume less of it. This is the result<br />
that leads to the biggest emissions saving but is a direct cost to people’s<br />
consumption.<br />
If goods previously produced in Britain are instead produced abroad, it poses a<br />
challenge to any green tax policies not formed at a global level:<br />
- In many industries British firms compete with others abroad. While British firms<br />
have advantages such as easy access to the British and European market they<br />
also have disadvantages such as high labour costs. It is entirely possible that<br />
green taxes on firms, whether directly or indirectly (fuel duty increases the costs<br />
of firms that need to move goods about the country, for example) will tip the<br />
balance in many competitive industries and move economic activity abroad.<br />
- This will not only reduce prosperity in Britain but will also lead to an increase in<br />
total emissions if the foreign firm that benefits is less energy-efficient. If green<br />
taxes move British economic activity to China, which has no green taxes, global<br />
emissions from that activity may more than double as China’s emissions<br />
intensity is more than twice Britain’s. Emissions will also be further increased by<br />
the need to transport goods further if production is for the British or European<br />
market.<br />
43 Old Queen Street, London SW1H 9JA www.taxpayersalliance.com<br />
0845 330 9554 (office hours) 07795 084 113 (media – 24 hours)<br />
20
Table 3.2 – Emissions intensity by country for the 25 largest emitters 23<br />
Country<br />
Emissions intensity:<br />
tonnes of CO 2 eq. / $m GDP (PPP)<br />
Ukraine 2,369<br />
Russia 1,817<br />
Iran 1,353<br />
Saudi Arabia 1,309<br />
Pakistan 1,074<br />
China 1,023<br />
South Africa 1,006<br />
Poland 991<br />
Australia 977<br />
Turkey 844<br />
Indonesia 799<br />
Canada 793<br />
India 768<br />
South Korea 729<br />
United States 720<br />
Brazil 679<br />
Argentina 659<br />
Mexico 586<br />
Spain 471<br />
Germany 471<br />
United Kingdom 450<br />
Japan 400<br />
Italy 369<br />
France 344<br />
For green taxes to reduce emissions even by a small amount it is necessary that the<br />
reductions in emissions that come from energy efficiency and lower production outweigh<br />
any increase due to production being transferred to less efficient plants abroad. If they do<br />
not then green taxes can increase global emissions.<br />
23 Baumert, K. A., Herzog, T. & Pershing, J. “Navigating the Numbers: <strong>Green</strong>house Gas Data and<br />
International Climate Policy”, Chapter 5, http://pdf.wri.org/navigating_numbers_chapter5.pdf, World<br />
Resources Institute<br />
43 Old Queen Street, London SW1H 9JA www.taxpayersalliance.com<br />
0845 330 9554 (office hours) 07795 084 113 (media – 24 hours)<br />
21
4. Air Passenger Duty<br />
Air Passenger Duty raised £1 billion in 2006-07. 24 <strong>The</strong> 2006 Pre-Budget<br />
Report announced a doubling of the rates to £10 for an economy short-haul<br />
flight and £40 for an economy long-haul flight, while non-economy class<br />
passengers pay twice these rates. In 2007-08, revenue from Air Passenger<br />
Duty is consequently set to double, to £2.1 billion. 25<br />
Table 4.1: Air Passenger Duty rates 26<br />
Type of flight<br />
Air Passenger Duty rate<br />
pre-February 2007, £<br />
Air Passenger Duty rate<br />
post-February 2007, £<br />
Intra-EU economy £5 £10<br />
Intra-EU non-economy £10 £20<br />
Long-haul economy £20 £40<br />
Long-haul non-economy £40 £80<br />
Table 4.2: Revenue raised from Air Passenger Duty 27<br />
Year<br />
Air Passenger Duty revenue, £ billion<br />
2005-06 £0.9 billion<br />
2006-07 £1.0 billion<br />
2007-08 £2.1 billion<br />
This increase in Air Passenger Duty, however, is unlikely to have the<br />
environmentally-friendly effects its proponents would suppose. In fact,<br />
according to a recent paper published by the Economic and Social Research<br />
Institute in Dublin, its effect is likely to be counter-productive, increasing<br />
rather than reducing total emissions. 28<br />
<strong>The</strong> blunt way in which the duty operates explains why it functions poorly as<br />
a green tax. Air Passenger Duty applies one charge to all short-haul flights<br />
and another to all long-haul flights, while rates are double for non-economy<br />
passengers. Two problems ensue:<br />
Firstly, the vast disparities in distance flown, and emissions generated,<br />
between flying from London to Paris and Rome (both within the shorthaul<br />
band) and London to New York and Sydney (both within the longhaul<br />
band) are ignored. Air Passenger Duty therefore reduces the<br />
difference in price between trips of different distances within the shorthaul<br />
and long-haul bands. In this way, it actually incentivises flying<br />
longer distances.<br />
24 HM Treasury, Budget 2007, Table C8: Current receipts, March 2007.<br />
25 Ibid.<br />
26 HM Treasury, Pre-Budget Report 2006: Chapter 7 – Protecting the Environment, paragraph 7.82<br />
27 HM Treasury, Budget 2007, Table C8: Current receipts, March 2007.<br />
28 Mayor, K. & Tol, R. S. J. “<strong>The</strong> impact of the UK aviation tax on carbon dioxide emissions and visitor<br />
numbers” Working Paper FNU-131, Economic and Social Research Institute, Dublin, April 2007<br />
43 Old Queen Street, London SW1H 9JA www.taxpayersalliance.com<br />
0845 330 9554 (office hours) 07795 084 113 (media – 24 hours)<br />
22
Secondly, although the number of flights determines the amount of<br />
emissions generated by air travel, the charge is levied per passenger<br />
journey, not per aircraft journey. Airline companies are therefore given<br />
no incentive to completely fill aircraft. In one of the most extreme cases,<br />
a British Airways franchise operated an empty flight daily from London to<br />
Cardiff simply to hold on to its lucrative slots at Heathrow. 29<br />
<strong>The</strong> first of these problems is by far the most serious. <strong>The</strong> Economic and<br />
Social Research Institute analysed the effect of the doubling of Air Passenger<br />
Duty using the Hamburg Tourism Model. 30 <strong>The</strong>ir analysis showed that the<br />
Air Passenger Duty increase would direct passengers from the UK to more<br />
distant destinations and passengers to the UK to other destinations. This<br />
would have two harmful effects:<br />
<strong>The</strong> increase in Air Passenger Duty was found to have only a slight effect<br />
on emissions, but in the form of an increase. In other words the effect of<br />
the tax rise is directly counter-productive. 31<br />
Abolishing Air Passenger Duty would increase arrivals to the UK by<br />
332,000 per year compared to doubling it. 32 <strong>The</strong> average visitor spends<br />
£470 while they are in the UK. 33 Abolishing Air Passenger Duty would<br />
therefore provide a £156 million boost to Britain’s tourism industry.<br />
It is again clear that Air Passenger Duty, like Fuel Duty, is functioning not as<br />
a green tax but as another device to raise revenue, hitting those for whom<br />
budget airlines have made flying affordable for the first time.<br />
29 O’Connell, D. and Chittenden, M., <strong>The</strong> Flight Now Leaving Heathrow is … Empty, <strong>The</strong> Times, 11<br />
March 2007 http://www.timesonline.co.uk/tol/news/uk/article1496766.ece<br />
30 Mayor, K. & Tol, R. S. J. “<strong>The</strong> impact of the UK aviation tax on carbon dioxide emissions and visitor<br />
numbers” Working Paper FNU-131, Economic and Social Research Institute, Dublin, April 2007<br />
31 Ibid.<br />
32 Ibid.<br />
33 Visit Britain, “Britain’s tourism deficit soars despite record visitor numbers”, December 2005<br />
43 Old Queen Street, London SW1H 9JA www.taxpayersalliance.com<br />
0845 330 9554 (office hours) 07795 084 113 (media – 24 hours)<br />
23
5. “Bin taxes” and the Landfill Tax<br />
<strong>The</strong> idea of imposing charges for the collection of household rubbish has<br />
been gaining ground in all layers of government:<br />
Local authorities are keen to find a new way to raise revenue, given that<br />
council tax increases are capped at 5 per cent. <strong>The</strong> Local Government<br />
Association has said “the Chancellor’s three-year spending review has<br />
awarded councils a funding rise of just 0.6 per cent in the first year – a<br />
cut in real terms […] <strong>The</strong> settlement for the next two years – around one<br />
per cent over inflation – will be quickly eaten up by already cash starved<br />
services.” 34<br />
Central government has also supported the idea of reducing weekly bin<br />
collections and charging for non-recyclable waste. 35 <strong>The</strong> Government has<br />
increased Landfill Tax rates by £3 per tonne to £24 per tonne from April<br />
2007 and plans to increase it by £8 per tonne in each year from 2008<br />
until at least 2010-11 36 while revenue from the tax has risen from £700<br />
million in 2005-06 to a projected £900 million in 2007-08. 37<br />
<strong>The</strong> EU’s Landfill Directive sets stringent targets to reduce landfill waste.<br />
<strong>The</strong> National Audit Office noted that “the Prime Minister’s Strategy Unit<br />
suggested that the United Kingdom could be fined up to £180 million a<br />
year”. 38<br />
<strong>The</strong> final cost that households could face under a “bin tax” scheme is<br />
unclear. A number of estimates have put it at around £120 per household<br />
per year. 39 Richard Hobbs, Chief Waste Officer of Wandsworth Council, has<br />
looked at the cost of administering the scheme and charges in the areas of<br />
the Republic of Ireland where it has been introduced and, in a letter passed<br />
to the TaxPayers’ <strong>Alliance</strong> by an anonymous supporter, predicted that the<br />
final charge could be as high as £1,000 per year. (40)<br />
As well as these direct financial costs to households there are wider costs, in<br />
terms of harms to the physical environment, if bin taxes encourage flytipping.<br />
<strong>The</strong> risk of this happening has been recognised for some time.<br />
Increases in fly-tipping around Dartmoor were attributed to charges for<br />
disposing of business waste as far back as 2002. 41<br />
34 Bird, H. “Waste targets cannot be delivered without funding, says LGA”, Local Government<br />
Association, August 2004, http://www.lga.gov.uk/PressRelease.asp?lSection=0&id=SX95EE-A7826EF9<br />
35 BBC News, “Bin charges ‘to boost recycling’”, May 2007<br />
36 HM Treasury, Budget 2007, Paragraph 7.90: Landfill Tax, March 2007.<br />
37 HM Treasury, Budget 2007, Table C8: Current receipts, March 2007.<br />
38 National Audit Office, “Department for Environment, Food and Rural Affairs: Reducing the reliance<br />
on landfill in England”, July 2006<br />
39 Wilson, G. “Families face £120 a year tax on their rubbish”, Daily Telegraph, February 2007<br />
40 See Appendix for a copy of the letter in full.<br />
41 BBC News, “Fly tipping blights Dartmoor”, http://news.bbc.co.uk/1/hi/england/2586393.stm,<br />
December 2002<br />
43 Old Queen Street, London SW1H 9JA www.taxpayersalliance.com<br />
0845 330 9554 (office hours) 07795 084 113 (media – 24 hours)<br />
24
Despite claims to the contrary, the experience of the introduction and<br />
increase of local authority parking charges in the 1990s suggests that any<br />
introduction of charges for rubbish collection will not result in an equal and<br />
compensatory reduction in council tax:<br />
In 2005 councils raised a record £1.2 billion from parking charges, an<br />
increase of 82 per cent over the amount nine years earlier. 42<br />
Over the same period average council tax bills rose by 76 per cent. 43<br />
It is clear, therefore, that new bin taxes are likely to be levied in addition to<br />
rising council tax. This is partly due to local authorities’ demand for more<br />
revenue, and partly because higher landfill charges are being imposed upon<br />
town halls, both from the Government’s Landfill Tax increases and from the<br />
threat of fines under the EU’s Landfill Directive.<br />
<strong>The</strong> objective of both the Landfill Tax and proposed new measures such as<br />
bin taxes is supposed to be to increase the amount of recycling and cut the<br />
amount of waste going to landfill. New measures, or an increase in Landfill<br />
Tax, can be justified if there are significant externalities to people choosing<br />
to dispose of their rubbish at landfill instead of by recycling, that are not<br />
accounted for under the present system. This, however, is unlikely to be the<br />
case:<br />
More energy is generally used in producing new products rather than<br />
recycling old ones but this energy use will be taxed, when the new good<br />
is produced, by other green measures such as the EU Emissions Trading<br />
Scheme and the Climate Change Levy.<br />
<strong>The</strong>re may be externalities to those living or working in a small<br />
geographical area around a landfill site; one possible example is the<br />
smell. However, in this regard landfill is little different to other industrial<br />
sites that also produce noise or smells. Planning regulation is the<br />
accepted way in which Britain, along with most other countries, regulates<br />
where such externalities are acceptable.<br />
<strong>The</strong>refore, the only externality which Landfill Tax, bin taxes and other<br />
measures designed to encourage recycling are appropriate measures to<br />
correct is any global warming effect of methane emissions from landfill sites.<br />
It can be shown, however, that the existing Landfill Tax is already more than<br />
sufficient to cover this externality.<br />
Methane emissions are converted to CO 2 equivalent at a rate of 1 tonne of<br />
methane:21 tonnes of CO 2 . 44 Given the amount of methane produced by UK<br />
42 Daily Telegraph, “Motorists pay record £1bn parking bill”, June 2006<br />
43 Office of the Deputy Prime Minister, “Statistical Release: Levels of council tax set by local authorities<br />
in England, 2006-07”, March 2006<br />
44 European Environment Agency, “carbon dioxide equivalent – Glossary – EEA”, downloaded from<br />
http://glossary.eea.europa.eu/EEAGlossary/C/carbon_dioxide_equivalent on 8/8/2007<br />
43 Old Queen Street, London SW1H 9JA www.taxpayersalliance.com<br />
0845 330 9554 (office hours) 07795 084 113 (media – 24 hours)<br />
25
landfill in 2005, a range of estimates of the total social cost of landfill<br />
methane emissions can be generated based on the estimates of the social<br />
cost of carbon shown in Table 1.1. <strong>The</strong>se estimates range from £79.3 million<br />
to £910.1 million.<br />
Table 5.1: Estimates of the social cost of methane from UK landfill 45<br />
Organisation/<br />
person<br />
Methane<br />
emissions<br />
from UK<br />
landfill,<br />
2005,<br />
tonnes<br />
CO 2 equivalent<br />
emissions from<br />
UK landfill, 2005,<br />
millions of<br />
tonnes<br />
Social cost<br />
of CO 2 , per<br />
tonne, £<br />
Social cost of<br />
methane<br />
emissions from<br />
UK landfill, 2005,<br />
£ million<br />
Nordhaus 928,000 19.5 million £4.07 £79.3 million<br />
IPCC 928,000 19.5 million £6.59 £128.4 million<br />
Tol 928,000 19.5 million £13.94 £271.8 million<br />
Stern 928,000 19.5 million £46.70 £910.1 million<br />
This range of social cost estimates can then be compared with the £700<br />
million raised from Landfill Tax in the corresponding year.<br />
Table 5.2: Social cost of UK landfill compared with Landfill Tax revenue 46<br />
Organisation/<br />
person<br />
Social cost of methane<br />
emissions from UK<br />
landfill, 2005,<br />
£ million<br />
Total revenue<br />
from Landfill<br />
Tax, 2005-06,<br />
£ million<br />
Landfill Tax revenue<br />
in excess of social<br />
cost of methane<br />
emissions from UK<br />
landfill, 2005,<br />
£ million<br />
Nordhaus £79.3 million £700 million £620.7 million<br />
IPCC £128.4 million £700 million £571.6 million<br />
Tol £271.8 million £700 million £428.2 million<br />
Stern £910.1 million £700 million -£210.1 million<br />
Average 347.4 million £352.6 million<br />
This comparison shows that only under Stern’s unusually high social cost<br />
estimate does Landfill Tax alone not account for the entire social cost of<br />
landfill methane emissions. Even then the difference is very small and will<br />
probably have been wiped out by further rises in Landfill Tax revenues since<br />
2005, given that landfill emissions have declined every year since 1990. 47<br />
Other estimates suggest that the tax should be significantly reduced. <strong>The</strong><br />
Intergovernmental Panel on Climate Change estimate implies that Landfill<br />
Tax should only be levied at a rate that raises a fifth of its current revenue.<br />
45 DEFRA, “e-Digest Statistics about: Climate Change - UK Emissions of <strong>Green</strong>house Gases”, January<br />
2007, http://www.defra.gov.uk/environment/statistics/globatmos/gagccukem.htm<br />
46 HM Treasury, Budget 2007, Table C8: Current receipts, March 2007.<br />
47 DEFRA, “e-Digest Statistics about: Climate Change - UK Emissions of <strong>Green</strong>house Gases”, January<br />
2007, downloaded from http://www.defra.gov.uk/environment/statistics/globatmos/gagccukem.htm on<br />
8/8/2007<br />
43 Old Queen Street, London SW1H 9JA www.taxpayersalliance.com<br />
0845 330 9554 (office hours) 07795 084 113 (media – 24 hours)<br />
26
Once again, planned bin taxes and the Landfill Tax are in excess of the level<br />
they need to be to correct for environmental externalities. <strong>The</strong>y have<br />
become simply another revenue-raising measure.<br />
43 Old Queen Street, London SW1H 9JA www.taxpayersalliance.com<br />
0845 330 9554 (office hours) 07795 084 113 (media – 24 hours)<br />
27
6. Emissions trading<br />
<strong>The</strong> European Union Emissions Trading Scheme (ETS), designed to help EU<br />
countries reduce greenhouse gas emissions, has been in operation since<br />
2005. <strong>The</strong> first stage of the Emissions Trading Scheme is due to be<br />
completed by the end of this year. It will be followed by a second stage<br />
running from 2008 to 2012.<br />
<strong>The</strong> first stage has suffered from a number of problems, as highlighted by<br />
the Open Europe think tank:<br />
<strong>The</strong> EU ETS has meant an annual £470 million subsidy from the UK to the<br />
rest of the EU. Each country was allowed to set its own targets for<br />
emissions reduction and the UK, which set a strict target, paid a subsidy<br />
to other countries which did not. Almost every other nation participating<br />
in the scheme made a profit. 48<br />
Public sector organisations proved unable to effectively trade emissions.<br />
<strong>The</strong> Russells Hall Hospital in Dudley lost £284,390 under the EU ETS.<br />
Many other hospitals in the UK bought permits at the top of the market<br />
and the total cost to the NHS was nearly £6 million. 49<br />
More experienced traders, including major oil companies such as BP and<br />
Shell, managed to make a profit. Shell made £49.9 million out of selling<br />
its unused allocation. 50<br />
<strong>The</strong> government’s preliminary Regulatory Impact Assessment suggests<br />
that the ETS is costing £62 million per year in administrative costs to<br />
British firms and public sector bodies alone. 51<br />
Unfortunately, as the following evidence shows, the second stage is unlikely<br />
to prove any more effective:<br />
Phase II includes a mechanism for “importing external Kyoto credits”,<br />
often from Third World projects that would have gone ahead anyway.<br />
<strong>The</strong> House of Commons Environmental Audit Committee argued that<br />
there is “compelling evidence” that Kyoto-credit projects “should be<br />
subject to serious doubt”. 52<br />
<strong>The</strong> system subsidises some high-emission industries. Economist Karsten<br />
Neuhoff describes how “the level of such subsidies under proposed<br />
second-phase NAP is so high that the construction of coal power stations<br />
48 Open Europe, “<strong>The</strong> high price of hot air: Why the EU Emissions Trading Scheme is an environmental<br />
and economic failure”, July 2006<br />
49 Kite, M. “NHS carbon trading sees millions go up in smoke”, Daily Telegraph, November 2006<br />
50 Open Europe, “<strong>The</strong> high price of hot air: Why the EU Emissions Trading Scheme is an environmental<br />
and economic failure”, July 2006<br />
51 Ibid.<br />
52 Open Europe, “Europe’s dirty secret: why the EU Emissions Trading Scheme isn’t working”, August<br />
2007<br />
43 Old Queen Street, London SW1H 9JA www.taxpayersalliance.com<br />
0845 330 9554 (office hours) 07795 084 113 (media – 24 hours)<br />
28
is more profitable under the ETS with such distorting allocation decisions<br />
than in the absence of ETS”. 53<br />
Germany, despite emitting 75 per cent more CO 2 than the UK, will pay at<br />
least €150 million less than Britain under a high emissions price scenario,<br />
or almost €200 million less than Britain under a low emissions price<br />
scenario. France may make a profit as its emissions target is actually<br />
above its current level of emissions. 54<br />
<strong>The</strong> EU Emissions Trading Scheme may be a particularly bad example of<br />
such trading schemes, but there are a number of common problems in<br />
attempts to create a market for emissions.<br />
Any international trading scheme will result in some nations paying money to<br />
others whether for just reasons, when they are moving more slowly in<br />
cutting emissions, or unjust ones, when the system is set up unfairly as it<br />
has been for the United Kingdom under the EU scheme. <strong>The</strong>se kinds of<br />
transfers from country to country will make emissions trading particularly<br />
difficult as each country attempts to ensure that its interests are not<br />
compromised. Six member states are currently suing the European<br />
Commission over their allocations<br />
Emissions trading schemes are also subject to large amounts of<br />
unpredictability. A study for the American Enterprise Institute found that<br />
under the Californian RECLAIM emissions trading scheme, permit prices<br />
ranged between $1,000 and $45,000 per tonne. 55 Open Europe report that<br />
prices in the EU ETS fell from €30.50 to €9.25 per tonne over the course of a<br />
few days. 56 Longer-term uncertainty is created by the periodic reviews of<br />
the method by which annual allocations are set. This instability creates a<br />
series of problems:<br />
Undermines business confidence in investing for the future which will do<br />
significant medium-term damage to industry.<br />
Makes it more likely that organisations taking part in the cap and trade<br />
system that have limited trading experience will get things wrong and<br />
make significant trading losses.<br />
Even with a well-constructed emissions trading scheme, one of the main<br />
effects will be to transfer emissions from firms operating within the scheme<br />
to firms in other countries. To the extent that the overseas firms are less<br />
energy-efficient (emitting a greater quantity of emissions for each unit of<br />
output), the net effect of emissions trading schemes can be to increase<br />
global emissions.<br />
53 Ibid.<br />
54 Ibid.<br />
55 <strong>Green</strong>, K. P., Hayward, S. F. & Hassett, K. A., “Climate Change: Caps vs. <strong>Taxes</strong>”, June 2007<br />
56 Open Europe, “<strong>The</strong> high price of hot air: Why the EU Emissions Trading Scheme is an environmental<br />
and economic failure”, July 2006<br />
43 Old Queen Street, London SW1H 9JA www.taxpayersalliance.com<br />
0845 330 9554 (office hours) 07795 084 113 (media – 24 hours)<br />
29
Emissions trading schemes, and other measures, such as the Renewables<br />
Obligation, increase the price of electricity for domestic consumers. As such,<br />
they are highly regressive. As Chart 6.1 below shows, poorer households<br />
spend far more of their gross income on electricity than richer households,<br />
meaning that electricity price rises have a much greater impact on their<br />
finances. Indeed, concerns have recently been raised about the impact of<br />
fuel poverty. Britain has the highest number of avoidable deaths from winter<br />
cold in Western Europe. 57<br />
Chart 6.1: Spending on electricity as a percentage of gross weekly income by<br />
household income decile, 2005-06 58<br />
4.0%<br />
3.5%<br />
3.0%<br />
2.5%<br />
2.0%<br />
1.5%<br />
1.0%<br />
0.5%<br />
0.0%<br />
Bottom 2nd 3rd 4th 5th 6th 7th 8th 9th Top<br />
When emissions trading schemes have been badly set up, as in the case of<br />
the EU Emissions Trading Scheme, the results are very much worse. <strong>The</strong> EU<br />
ETS has resulted in an enormous subsidy from Britain to other EU countries,<br />
has cost the NHS millions of pounds, and has proved expensive to<br />
administer. <strong>The</strong> second phase of the scheme is unlikely to bring with it<br />
either improvements or lower costs to British firms.<br />
57 BBC News, Fuel poverty is new “social evil”, August 2005<br />
http://news.bbc.co.uk/1/hi/business/4656517.stm<br />
58 Office for National Statistics, <strong>The</strong> Effects of <strong>Taxes</strong> and Benefits on Household Income 2005-06, Table<br />
24, Appendix 1; Office for National Statistics, Family Spending 2005-06, Table A8<br />
43 Old Queen Street, London SW1H 9JA www.taxpayersalliance.com<br />
0845 330 9554 (office hours) 07795 084 113 (media – 24 hours)<br />
30
7. Conclusion<br />
This report has presented a case against the imposition of further green<br />
taxes in Britain. It has outlined, for the first time, the negative impact of<br />
environmental taxes on consumers, businesses and public sector<br />
organisations such as the NHS.<br />
Overall, comparing an average of official and academic estimates of the<br />
social costs of the UK’s entire output of CO 2 emissions with the revenue<br />
raised from green taxes and charges (excluding Air Passenger Duty and net<br />
of road spending), environmental levies are already £10.2 billion in excess of<br />
the level they need to be to cover these social costs. This excess is<br />
equivalent to over £400 for each household in Britain. <strong>Green</strong> taxes are<br />
therefore already too high unless they are seen simply as revenue-raising<br />
measures.<br />
In many cases, individual green taxes and charges are failing to meet their<br />
objectives, are set at a level in excess of that needed to meet the social cost<br />
of CO 2 emissions, and are causing serious harm to areas of the country and<br />
industries least able to cope:<br />
Fuel Duty and Vehicle Excise Duty, net of spending on roads, are already<br />
between 3.6 and 40.9 times higher than the level needed to ensure that<br />
drivers cover the official and academic estimates of the social cost of CO 2<br />
emissions, costing each motorist an average of between £548 and £743<br />
each year.<br />
Under the Climate Change Levy, the North East, England’s poorest region,<br />
pays over 35 per cent more as a proportion of regional Gross Value<br />
Added, than the South East, England’s richest region outside London.<br />
<strong>The</strong> doubling of Air Passenger Duty announced in last year’s Pre-Budget<br />
Report is actually likely to have increased total emissions from air travel,<br />
incentivising longer flights within the short-haul and long-haul bands.<br />
Landfill Tax, which has been increased a number of times by the current<br />
government, is already raising up to £620 million more than would be<br />
sufficient to meet the social costs of methane emissions from landfill.<br />
Planned new bin taxes are likely to represent yet another supplementary<br />
charge on stretched household finances.<br />
<strong>The</strong> EU’s Emissions Trading Scheme has resulted in an annual £470<br />
million subsidy from the UK to the majority of EU countries that have not<br />
placed strict targets for overall reductions in emissions.<br />
This report has raised serious questions about the merits of imposing new or<br />
higher environmental taxes. In many cases, green taxes are not a benign<br />
alternative to taxes on income or profits. In the worst cases, they can even<br />
be counter-productive.<br />
43 Old Queen Street, London SW1H 9JA www.taxpayersalliance.com<br />
0845 330 9554 (office hours) 07795 084 113 (media – 24 hours)<br />
31
Appendix<br />
A letter from Richard Hobbs, Chief Waste Officer of Wandsworth Council, to a<br />
<strong>TaxPayers'</strong> <strong>Alliance</strong> supporter, makes the case against charges for rubbish<br />
collection:<br />
43 Old Queen Street, London SW1H 9JA www.taxpayersalliance.com<br />
0845 330 9554 (office hours) 07795 084 113 (media – 24 hours)<br />
32
43 Old Queen Street, London SW1H 9JA www.taxpayersalliance.com<br />
0845 330 9554 (office hours) 07795 084 113 (media – 24 hours)<br />
33