WAGRA Annual Report 2008-2009 - Greyhounds WA
WAGRA Annual Report 2008-2009 - Greyhounds WA
WAGRA Annual Report 2008-2009 - Greyhounds WA

Create successful ePaper yourself
Turn your PDF publications into a flip-book with our unique Google optimized e-Paper software.
WESTERN AUSTRALIAN GREYHOUND RACING ASSOCIATION<br />
<strong>Annual</strong> <strong>Report</strong> <strong>2008</strong>/<strong>2009</strong><br />
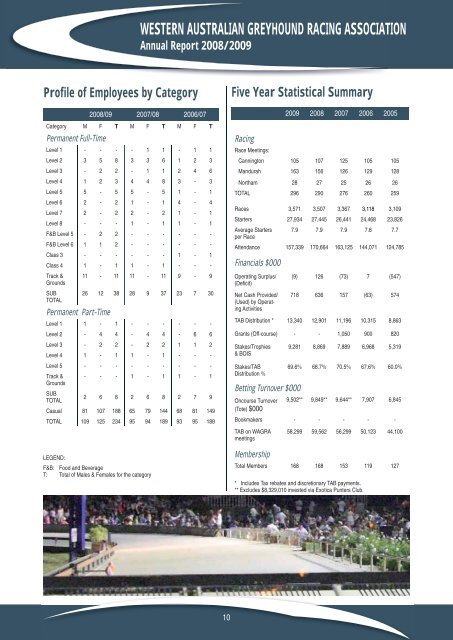
Profi le of Employees by Category<br />
<strong>2008</strong>/09 2007/08 2006/07<br />
Category M F T M F T M F T<br />
Permanent Full-Time<br />
Level 1 - - - - 1 1 - 1 1<br />
Level 2 3 5 8 3 3 6 1 2 3<br />
Level 3 - 2 2 - 1 1 2 4 6<br />
Level 4 1 2 3 4 4 8 3 - 3<br />
Level 5 5 - 5 5 - 5 1 - 1<br />
Level 6 2 - 2 1 - 1 4 - 4<br />
Level 7 2 - 2 2 - 2 1 - 1<br />
Level 8 - - - 1 - 1 1 - 1<br />
F&B Level 5 - 2 2 - - - - - -<br />
F&B Level 6 1 1 2 - - - - - -<br />
Class 3 - - - - - - 1 - 1<br />
Class 4 1 - 1 1 - 1 - - -<br />
Track & 11 - 11 11 - 11 9 - 9<br />
Grounds<br />
SUB<br />
TOTAL<br />
26 12 38 28 9 37 23 7 30<br />
Permanent Part-Time<br />
Level 1 1 - 1 - - - - - -<br />
Level 2 - 4 4 - 4 4 - 6 6<br />
Level 3 - 2 2 - 2 2 1 1 2<br />
Level 4 1 - 1 1 - 1 - - -<br />
Level 5 - - - - - - - - -<br />
Track & - - - 1 - 1 1 - 1<br />
Grounds<br />
SUB<br />
TOTAL<br />
2 6 8 2 6 8 2 7 9<br />
Casual 81 107 188 65 79 144 68 81 149<br />
TOTAL 109 125 234 95 94 189 93 95 188<br />
LEGEND:<br />
F&B: Food and Beverage<br />
T: Total of Males & Females for the category<br />
Five Year Statistical Summary<br />
Racing<br />
<strong>2009</strong> <strong>2008</strong> 2007 2006 2005<br />
Race Meetings:<br />
Cannington 105 107 125 105 105<br />
Mandurah 163 156 126 129 128<br />
Northam 28 27 25 26 26<br />
TOTAL 296 290 276 260 259<br />
Races 3,571 3,507 3,367 3,118 3,109<br />
Starters 27,934 27,445 26,441 24,468 23,826<br />
Average Starters 7.9 7.9 7.9 7.8 7.7<br />
per Race<br />
Attendance 157,339 170,664 163,125 144,071 124,785<br />
Financials $000<br />
Operating Surplus/<br />
(Defi cit)<br />
Net Cash Provided/<br />
(Used) by Operating<br />
Activities<br />
(9) 126 (73) 7 (547)<br />
718 636 157 (63) 574<br />
TAB Distribution * 13,340 12,901 11,196 10,315 8,863<br />
Grants (Off-course) - - 1,050 900 820<br />
Stakes/Trophies<br />
& BOIS<br />
Stakes/TAB<br />
Distribution %<br />
Betting Turnover $000<br />
Oncourse Turnover<br />
(Tote) $000<br />
9,281 8,869 7,889 6,968 5,319<br />
69.6% 68.7% 70.5% 67.6% 60.0%<br />
9,502** 9,849** 9,644** 7,907 6,845<br />
Bookmakers - - - - -<br />
TAB on <strong><strong>WA</strong>GRA</strong><br />
meetings<br />
Membership<br />
58,299 59,562 56,299 50,123 44,100<br />
Total Members 168 168 153 119 127<br />
* Includes Tax rebates and discretionary TAB payments.<br />
** Excludes $8,329,010 invested via Exotica Punters Club.<br />
10