2009 Annual Report: Full Report - EOG Resources, Inc.
2009 Annual Report: Full Report - EOG Resources, Inc.
2009 Annual Report: Full Report - EOG Resources, Inc.

You also want an ePaper? Increase the reach of your titles
YUMPU automatically turns print PDFs into web optimized ePapers that Google loves.
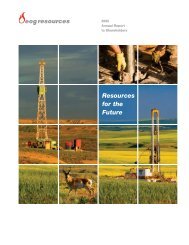
Developing New Frontiers<br />
in Horizontal Oil<br />
2 0 0 9 A n n u a l R e p o r t
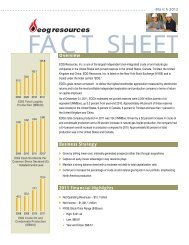
F i n a n c i a l a n d O p e r a t i n g H i g h l i g h t s<br />
(In millions, except per share data, unless otherwise indicated) <strong>2009</strong> 2008 2007<br />
Net Operating Revenues ..................................................................................... $ 4,787 $ 7,127 $ 4,239<br />
<strong>Inc</strong>ome Before Interest Expense and <strong>Inc</strong>ome Taxes ........................................... $ 973 $ 3,798 $ 1,678<br />
Net <strong>Inc</strong>ome Available to Common Stockholders ................................................ $ 547 $ 2,436 $ 1,083<br />
Total Exploration and Development Expenditures .............................................. $ 3,908 $ 5,093 $ 3,599<br />
Other Property, Plant and Equipment Expenditures ........................................... $ 326 $ 477 $ 277<br />
Wellhead Statistics<br />
Natural Gas Volumes (MMcfd) ........................................................................ 1,645 1,619 1,470<br />
Average Natural Gas Prices ($/Mcf) ................................................................ $ 3.42 $ 7.51 $ 5.65<br />
Crude Oil and Condensate Volumes (MBbld) .................................................. 55.2 45.5 31.2<br />
Average Crude Oil and Condensate Prices ($/Bbl) ......................................... $ 54.46 $ 88.18 $ 68.69<br />
Natural Gas Liquids Volumes (MBbld) ............................................................. 23.6 16.0 12.2<br />
Average Natural Gas Liquids Prices ($/Bbl) ..................................................... $ 30.05 $ 53.42 $ 47.36<br />
NYSE Price Range ($/Share)<br />
High................................................................................................................... $ 101.76 $ 144.99 $ 91.63<br />
Low .................................................................................................................. $ 45.03 $ 54.42 $ 59.21<br />
Close ................................................................................................................ $ 97.30 $ 66.58 $ 89.25<br />
Cash Dividends Per Common Share Declared ................................................... $ 0.58 $ 0.51 $ 0.36<br />
Diluted Average Number of Common Shares Outstanding ................................ 251.9 250.5 247.6<br />
The Company<br />
<strong>EOG</strong> <strong>Resources</strong>, <strong>Inc</strong>. (<strong>EOG</strong>) is one<br />
of the largest independent (nonintegrated)<br />
oil and natural gas<br />
companies in the United States<br />
with proved reserves in the United<br />
States, Canada, Trinidad, the United<br />
Kingdom and China. <strong>EOG</strong> is listed<br />
on the New York Stock Exchange<br />
and is traded under the ticker symbol<br />
“<strong>EOG</strong>.”<br />
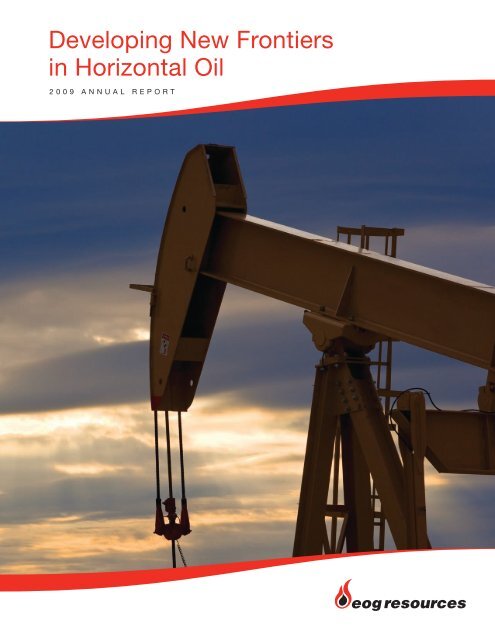
On the Cover<br />
A crude oil pumping unit symbolizes<br />
the shift toward a more balanced mix<br />
of crude oil and natural gas in <strong>EOG</strong>’s<br />
North American production portfolio.<br />
Highlights<br />
• In <strong>2009</strong>, <strong>EOG</strong> reported net income<br />
available to common stockholders<br />
of $546.6 million as compared to<br />
$2,436.5 million for 2008.<br />
• <strong>EOG</strong> delivered 6.5 percent yearover-year<br />
total company organic<br />
production growth.<br />
• Total North American liquids<br />
production increased 30 percent,<br />
comprised of 23 percent growth in<br />
crude oil and condensate and 48<br />
percent in natural gas liquids, driven<br />
by ongoing exploration and development<br />
drilling in the North Dakota<br />
Bakken and Fort Worth Barnett<br />
Shale Combo Plays.<br />
• Total company proved reserves<br />
were approximately 10.8 Tcfe, an increase<br />
of 2,087 Bcfe, or 24 percent<br />
higher than year-end 2008.<br />
• <strong>EOG</strong> maintained a conservative<br />
balance sheet, ending the year with<br />
a net debt-to-total capitalization<br />
ratio (1) of 17 percent.<br />
• Following an increase in the common<br />
stock dividend in <strong>2009</strong>, <strong>EOG</strong>’s<br />
Board of Directors again increased<br />
the cash dividend on the common<br />
stock. Effective with the dividend<br />
payable on April 30, 2010 to holders<br />
of record as of April 16, 2010, the<br />
quarterly dividend on the common<br />
stock will be $0.155 per share, an<br />
increase of 7 percent over the previous<br />
indicated annual rate. The current<br />
indicated annual rate of $0.62<br />
per share reflects the 11th increase<br />
in 11 years.<br />
• <strong>EOG</strong> was named to Fortune’s list of<br />
“100 Best Companies to Work For ® ”<br />
for the fourth consecutive year it has<br />
been eligible for consideration.<br />
(1)<br />
Refer to reconciliation schedule on<br />
page 105.<br />
For information regarding forward-looking statements, see pages 43-44 of <strong>EOG</strong>’s<br />
Form 10-K included herein.<br />
E O G R e s o u r c e s , I n c .<br />
For a glossary of terms, see page 106.
L e t t e r t o S t o c k h o l d e r s<br />
Developing New Frontiers in Horizontal Oil<br />
Our strategy shift toward a more balanced portfolio<br />
with an increased focus on crude oil<br />
and natural gas liquids is well underway.<br />
While our long-standing fundamentals remain intact,<br />
<strong>EOG</strong> can no longer be considered primarily a natural<br />
gas company. Our strategy shift toward a more<br />
decision, we have captured commanding positions in<br />
several proved and prospective oil plays that will drive<br />
our liquids production growth for many years to come.<br />
balanced portfolio with an increased focus on crude oil<br />
and natural gas liquids is well underway.<br />
We are accomplishing this significant transformation<br />
by successfully adapting the same technological skill<br />
set that we honed in horizontal natural gas shale plays<br />
to unlock challenging new liquids-rich unconventional<br />
reservoirs. Our proficiency in identifying viable geologic<br />
play candidates and the application of industry<br />
leading completion techniques is providing <strong>EOG</strong><br />
with a competitive advantage<br />
in a number of different North<br />
American petroleum basins. <strong>EOG</strong><br />
is at the forefront of the industry<br />
in developing new frontiers in<br />
horizontal oil.<br />
The decision to move a<br />
greater portion of <strong>EOG</strong>’s capital<br />
expenditures and exploration<br />
budget away from natural gas<br />
toward crude oil and natural gas<br />
liquids began several years ago.<br />
It was based not only on <strong>EOG</strong>’s<br />
demonstrated technical edge but<br />
also our long-term view of North<br />
Outlook for North American Markets<br />
<strong>EOG</strong> expects North American natural gas prices to be<br />
fairly static during the first half of 2010 but rebound<br />
in the second half of the year as the decline in North<br />
America’s natural gas supply becomes more apparent.<br />
However, due to the industry’s overwhelming horizontal<br />
drilling success in natural gas shale plays, our longterm<br />
view of North American natural gas continues<br />
to be that future price growth will<br />
be less robust than that of crude<br />
oil. By decreasing our exposure<br />
to natural gas, <strong>EOG</strong> will be less<br />
dependent on vagaries such as<br />
weather, as well as the impact from<br />
liquefied natural gas and Canadian<br />
imports. Factors such as these<br />
have caused extreme volatility<br />
in natural gas prices and wide<br />
revenue swings.<br />
In contrast, NYMEX crude oil<br />
prices have been surprisingly<br />
robust with the second half of<br />
<strong>2009</strong> averaging over $72 per<br />
American natural gas and global Loren M. Leiker Mark G. Papa Gary L. Thomas<br />
Senior Executive Chairman Senior Executive<br />
barrel. We anticipate that prices<br />
crude oil market fundamentals. Vice President,<br />
Exploration<br />
and Chief<br />
Executive<br />
Vice President,<br />
Operations<br />
will average over $75 per barrel<br />
Since we made this strategic<br />
Officer<br />
during 2010 and likely increase<br />
1 2 0 0 9 A n n u a l R e p o r t
L e t t e r t o S t o c k h o l d e r s<br />
further over the next 10 years and beyond. Global<br />
demographic trends, particularly in Asia, suggest that<br />
total worldwide demand for crude oil is expected<br />
to significantly increase over the next 20 years as<br />
population growth and per capita utilization increase<br />
in the developing world.<br />
The fiscal discipline that is one of <strong>EOG</strong>’s key<br />
attributes provides us with the balance sheet flexibility<br />
to pursue exploration concepts in a variety of market<br />
conditions. This provides <strong>EOG</strong> with the ability to<br />
maintain a steady exploration program and expand<br />
acreage positions at favorable early-mover costs<br />
<strong>EOG</strong>’s transformation into a more balanced crude oil and natural gas<br />
company will be accomplished without significantly changing the<br />
precepts on which our company has been built.<br />
Changing Strategy but Not Focus<br />
For the past decade, <strong>EOG</strong> has been a heavily weighted<br />
North American natural gas producer. In 1999, 81<br />
percent of our total wellhead revenues and 86 percent<br />
of our North American volumes were natural gas. In<br />
<strong>2009</strong>, 60 percent of our total wellhead revenues and 75<br />
percent of our North American volumes were derived<br />
from natural gas.<br />
In 2010, we expect <strong>EOG</strong>’s North American revenue<br />
mix to be divided almost equally between liquids<br />
and natural gas. However, <strong>EOG</strong> is<br />
not walking away from natural gas.<br />
when there is little competition. At year-end <strong>2009</strong>,<br />
<strong>EOG</strong> had a net debt-to-total capitalization ratio (2)<br />
of 17 percent.<br />
<strong>EOG</strong>’s transformation into a more balanced crude<br />
oil and natural gas company will be accomplished<br />
without significantly changing the precepts on<br />
which our company has been built. We will maintain<br />
<strong>EOG</strong>’s long-standing high rate of return organic<br />
approach – by growing through the drillbit – rather<br />
than seeking major mergers and/or acquisitions.<br />
We will continue to pursue <strong>EOG</strong>’s<br />
consistent <strong>EOG</strong> CASH game DIVIDENDS plan PER because it yields <strong>EOG</strong> DAILY CRUDE OIL AND<br />
<strong>EOG</strong> DAILY PRODUCTION<br />
COMMON SHARE DECLARED<br />
CONDENSATE PRODUCTION<br />
Over the years, we have organically<br />
consistent results for our stockholders<br />
(MMcfed)<br />
($)<br />
(MBbld)<br />
developed and captured early-mover<br />
by generating strong debt-adjusted<br />
2,118<br />
.62<br />
55.<br />
acreage positions in such outstanding<br />
1,988<br />
production growth .58 per share. We will<br />
shale plays as the Fort Worth Barnett,<br />
1,729<br />
still add value .51 by remaining a low<br />
45.5<br />
British Columbia Horn River Basin,<br />
1,561<br />
cost producer, monitoring the balance<br />
Haynesville and Marcellus. While<br />
sheet, maintaining .36 a low debt level<br />
31.2<br />
these plays will drive <strong>EOG</strong>’s North<br />
American natural gas production<br />
growth in 2010, we will continue to<br />
access our deep inventory of high<br />
rate-of-return natural gas assets<br />
when markets are favorable.<br />
06 07 08 09<br />
and focusing on return on capital<br />
employed (ROCE).<br />
Fueling <strong>EOG</strong>’s Momentum<br />
The two biggest contributors to <strong>EOG</strong>’s<br />
2010 crude 07 oil 08 and 09natural 10* gas liquids<br />
28.1<br />
06 07 08 09<br />
* Indicated current level<br />
E O G R e s o u r c e s , I n c .<br />
2
L e t t e r t o S t o c k h o l d e r s<br />
3 2 0 0 9 A n n u a l R e p o r t
L e t t e r t o S t o c k h o l d e r s<br />
E O G R e s o u r c e s , I n c .<br />
4
L e t t e r t o S t o c k h o l d e r s<br />
growth will be the Fort Worth Barnett Shale Combo<br />
and North Dakota Bakken Plays.<br />
<strong>EOG</strong> holds a major position in the Fort Worth Barnett<br />
Shale Combo, a crude oil and liquids-rich natural gas<br />
trend in the Fort Worth Basin, outside the core natural<br />
to implement solutions to resolve issues that might<br />
stymie other operators.<br />
While the Fort Worth Barnett Shale Combo and<br />
North Dakota Bakken Plays are expected to provide<br />
significant momentum for the foreseeable future, <strong>EOG</strong><br />
<strong>EOG</strong>’s persistence in managing costs<br />
and maximizing reserve recoveries has resulted<br />
in superior returns, year after year.<br />
DAILY PRODUCTION<br />
cfed)<br />
1,729<br />
61<br />
6<br />
07<br />
2,118<br />
1,988<br />
08<br />
09<br />
gas area. In 2010, we will move into development<br />
drilling of both vertical and horizontal wells in eastern<br />
is pursuing additional horizontal crude oil and liquidsrich<br />
concepts in basins across North America.<br />
Montague and western Cooke Counties.<br />
With a position of over 500,000 net acres in<br />
the North Dakota Bakken, we have expanded our<br />
development activities beyond Bakken wells in the<br />
Core Parshall Field by drilling wells in the Bakken Lite<br />
and Three Forks Formation. Initial production profiles<br />
from the Three Forks are encouraging with recoverable<br />
reserves expected to be similar to the Bakken Lite.<br />
Last year when <strong>EOG</strong> recognized that crude oil<br />
production in the North Dakota Bakken<br />
Returns Still Matter<br />
<strong>EOG</strong>’s goal always has been to be the best rather than<br />
the biggest exploration and production company. We<br />
continue to define “best” as measured by delivering<br />
superior stockholder value.<br />
For the three, five and 10-year periods ended<br />
December 31, <strong>2009</strong>, <strong>EOG</strong>’s stock appreciation<br />
was 56 percent, 173 percent and 1,008 percent,<br />
respectively, significantly exceeding<br />
exceeded the <strong>EOG</strong> pipeline CASH DIVIDENDS capacity PER in the<br />
<strong>EOG</strong> DAILY CRUDE OIL AND the performance of the S&P 500 Oil<br />
COMMON SHARE DECLARED<br />
CONDENSATE PRODUCTION<br />
basin, we built ($) and placed in operation (MBbld)<br />
and Gas Exploration and Production<br />
a rail transportation system. Designed<br />
.62<br />
to initially facilitate one unit .58 train per<br />
55.2<br />
Index for these three periods.<br />
<strong>EOG</strong>’s persistence in managing<br />
day with a maximum .51capacity of 60,000<br />
gross barrels, the system is comprised<br />
45.5<br />
costs and maximizing reserve<br />
recoveries has resulted in superior<br />
of a crude oil loading .36 facility in Stanley,<br />
31.2<br />
returns, year after year. Our average<br />
North Dakota, an unloading facility<br />
in Stroud, Oklahoma and a 17-mile<br />
pipeline running from that point to a<br />
terminal in Cushing, Oklahoma. The<br />
project is an example of <strong>EOG</strong>’s agility,<br />
its ability to make 07 decisions 08 09 quickly 10* and<br />
28.1<br />
06 07 08 09<br />
ROCE (2) for the 10-year period<br />
ended December 31, <strong>2009</strong> was 18<br />
percent. <strong>EOG</strong>’s outperformance<br />
on stockholder returns and ROCE<br />
validates its long-term organic<br />
growth strategy.<br />
* Indicated current level<br />
5 2 0 0 9 A n n u a l R e p o r t
L e t t e r t o S t o c k h o l d e r s<br />
<strong>EOG</strong> reported net income available to common<br />
stockholders of $547 million in <strong>2009</strong>, or $2.17 per share<br />
as compared to $2,436 million, or $9.72 per share in<br />
2008. For the year, total company production increased<br />
6.5 percent, with a 28 percent increase in total company<br />
crude oil and natural gas liquids production.<br />
increasing stockholder value and safeguarding the<br />
environment. They also make a positive difference in<br />
their communities by contributing their talent, time and<br />
resources. Although <strong>EOG</strong> recently was named again to<br />
Fortune’s list of “100 Best Companies to Work For ® ”<br />
for the fourth consecutive year that it has been eligible,<br />
<strong>EOG</strong> delivers strong, steady results year-in and year-out because of the<br />
tenacity, creativity and commitment of approximately 2,100 employees,<br />
whom we consider unparalleled in any industry.<br />
At December 31, <strong>2009</strong>, <strong>EOG</strong>’s total proved reserves<br />
were approximately 10.8 Tcfe, an increase of 2.1 Tcfe,<br />
or 24 percent higher than year-end 2008. Total reserve<br />
replacement from all sources (2) was 364 percent at<br />
attractive total reserve replacement costs.<br />
Following an increase in <strong>2009</strong>, the <strong>EOG</strong> Board of<br />
Directors again increased the cash dividend on the<br />
common stock in February 2010. Effective with the<br />
dividend payable on April 30, 2010 to holders of record<br />
as of April 16, 2010, the quarterly dividend<br />
the laurels rightfully go to our employees. They have<br />
made <strong>EOG</strong> what it is, and we salute their efforts.<br />
We all are proud of what <strong>EOG</strong> has accomplished as<br />
primarily a natural gas company over the past decade.<br />
Looking ahead, we have an early-mover position in<br />
several horizontal crude oil concepts, plus we are<br />
optimistic about the strength of crude oil prices in the<br />
future. Therefore, our long-term ROCE outperformance<br />
versus our peers can be perpetuated over the next<br />
decade, which should continue to be<br />
on the common stock will be $0.155 per<br />
reflected in superior stockholder returns.<br />
<strong>EOG</strong> CASH DIVIDENDS PER<br />
<strong>EOG</strong> DAILY CRUDE OIL AND<br />
share, an increase <strong>EOG</strong> DAILY of 7 PRODUCTION percent over the<br />
COMMON SHARE DECLARED At <strong>EOG</strong>, CONDENSATE we are PRODUCTION energized by the<br />
(MMcfed)<br />
($)<br />
(MBbld)<br />
previous indicated annual rate. The current<br />
challenge of developing new frontiers in<br />
2,118<br />
.62<br />
55.2<br />
indicated annual rate of $0.62 1,988 per share<br />
.58<br />
horizontal oil.<br />
reflects the 11th increase 1,729 in 11 years.<br />
.51<br />
45.5<br />
1,561<br />
<strong>EOG</strong>’s People Make the Difference<br />
<strong>EOG</strong> delivers strong, steady results<br />
year-in and year-out because of the<br />
tenacity, creativity and commitment<br />
of approximately 2,100 employees,<br />
whom we consider unparalleled in<br />
any industry. They 06 work 07 hard, 08 they 09<br />
work safely and they are committed to<br />
.36<br />
31.2<br />
07 08 09 10*<br />
Mark G. Papa 28.1<br />
Chairman and Chief Executive Officer<br />
February 25, 2010<br />
Footnotes<br />
(2)<br />
Refer to 06 reconciliation 07 08 schedule 09 on<br />
* Indicated current level<br />
page 105.<br />
E O G R e s o u r c e s , I n c .<br />
6
L e t t e r t o S t o c k h o l d e r s<br />
7 2 0 0 9 A n n u a l R e p o r t
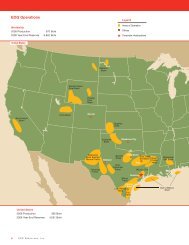
E O G O p e r a t i o n s<br />
Legend<br />
Areas of Operation<br />
Offices<br />
★ Corporate Headquarters<br />
E O G R e s o u r c e s , I n c .<br />
8
Worldwide<br />
<strong>2009</strong> Production 773 Bcfe<br />
<strong>2009</strong> Year-End Proved Reserves 10,776 Bcfe<br />
United States<br />
<strong>2009</strong> Production 568 Bcfe<br />
<strong>2009</strong> Year-End Proved Reserves 8,030 Bcfe<br />
Canada<br />
<strong>2009</strong> Production 93 Bcfe<br />
<strong>2009</strong> Year-End Proved Reserves 1,715 Bcfe<br />
Trinidad and Tobago<br />
<strong>2009</strong> Production 106 Bcfe<br />
<strong>2009</strong> Year-End Proved Reserves 1,018 Bcfe<br />
Other International<br />
<strong>2009</strong> Production 6 Bcfe<br />
<strong>2009</strong> Year-End Proved Reserves 13 Bcfe<br />
9 2 0 0 9 A n n u a l R e p o r t
L e t t e r t o S t o c k h o l d e r s<br />
E O G R e s o u r c e s , I n c .<br />
10
UNITED STATES<br />
SECURITIES AND EXCHANGE COMMISSION<br />
Washington, D.C. 20549<br />
FORM 10-K<br />
(Mark One)<br />
ANNUAL REPORT PURSUANT TO SECTION 13 OR 15(d) OF THE SECURITIES EXCHANGE ACT OF 1934<br />
For the fiscal year ended December 31, <strong>2009</strong><br />
TRANSITION REPORT PURSUANT TO SECTION 13 OR 15(d) OF THE SECURITIES EXCHANGE ACT OF 1934<br />
or<br />
Commission file number: 1-9743<br />
<strong>EOG</strong> RESOURCES, INC.<br />
(Exact name of registrant as specified in its charter)<br />
Delaware 47-0684736<br />
(State or other jurisdiction of<br />
(I.R.S. Employer<br />
incorporation or organization)<br />
Identification No.)<br />
1111 Bagby, Sky Lobby 2, Houston, Texas 77002<br />
(Address of principal executive offices) (Zip Code)<br />
Registrant's telephone number, including area code: 713-651-7000<br />
Securities registered pursuant to Section 12(b) of the Act:<br />
Title of each class<br />
Common Stock, par value $0.01 per share<br />
Preferred Share Purchase Rights<br />
Name of each exchange on which registered<br />
New York Stock Exchange<br />
New York Stock Exchange<br />
Securities registered pursuant to Section 12(g) of the Act:<br />
None.<br />
Indicate by check mark if the registrant is a well-known seasoned issuer, as defined in Rule 405 of the Securities Act. Yes No <br />
Indicate by check mark if the registrant is not required to file reports pursuant to Section 13 or Section 15(d) of the Exchange Act.<br />
Yes No <br />
Indicate by check mark whether the registrant (1) has filed all reports required to be filed by Section 13 or 15(d) of the Securities<br />
Exchange Act of 1934 during the preceding 12 months (or for such shorter period that the registrant was required to file such reports), and (2)<br />
has been subject to such filing requirements for the past 90 days. Yes No <br />
Indicate by check mark whether the registrant has submitted electronically and posted on its corporate Website, if any, every<br />
Interactive Data File required to be submitted and posted pursuant to Rule 405 of Regulation S-T (§ 232.405 of this chapter) during the<br />
preceding 12 months (or for such shorter period that the registrant was required to submit and post such files). Yes No <br />
Indicate by check mark if disclosure of delinquent filers pursuant to Item 405 of Regulation S-K (§ 229.405 of this chapter) is not<br />
contained herein, and will not be contained, to the best of the registrant's knowledge, in definitive proxy or information statements incorporated<br />
by reference in Part III of this Form 10-K or any amendment to this Form 10-K. <br />
Indicate by check mark whether the registrant is a large accelerated filer, an accelerated filer, a non-accelerated filer, or a smaller<br />
reporting company. See the definitions of "large accelerated filer," "accelerated filer" and "smaller reporting company" in Rule 12b-2 of the<br />
Exchange Act.<br />
Large accelerated filer Accelerated filer Non-accelerated filer Smaller reporting company <br />
Indicate by check mark whether the registrant is a shell company (as defined in Rule 12b-2 of the Exchange Act).<br />
Yes No <br />
State the aggregate market value of the voting and non-voting common equity held by non-affiliates computed by reference to the<br />
price at which the common equity was last sold, or the average bid and asked price of such common equity, as of the last business day of the<br />
registrant's most recently completed second fiscal quarter. Common Stock aggregate market value held by non-affiliates as of June 30, <strong>2009</strong>:<br />
$16,923,094,790.<br />
Indicate the number of shares outstanding of each of the registrant's classes of common stock, as of the latest practicable date. Class:<br />
Common Stock, par value $0.01 per share, 252,578,053 shares outstanding as of February 19, 2010.<br />
Documents incorporated by reference. Portions of the Definitive Proxy Statement for the registrant's 2010 <strong>Annual</strong> Meeting of<br />
Stockholders to be filed within 120 days after December 31, <strong>2009</strong> are incorporated by reference into Part III of this report.
TABLE OF CONTENTS<br />
Page<br />
PART I<br />
ITEM 1. Business 1<br />
General 1<br />
Business Segments 1<br />
Exploration and Production 1<br />
Marketing 5<br />
Wellhead Volumes and Prices 7<br />
Competition 8<br />
Regulation 8<br />
Other Matters 12<br />
Executive Officers of the Registrant 13<br />
ITEM 1A. Risk Factors 14<br />
ITEM 1B. Unresolved Staff Comments 19<br />
ITEM 2. Properties 19<br />
Oil and Gas Exploration and Production - Properties and Reserves 19<br />
ITEM 3. Legal Proceedings 22<br />
ITEM 4. Submission of Matters to a Vote of Security Holders 22<br />
PART II<br />
ITEM 5. Market for Registrant's Common Equity, Related Stockholder Matters and<br />
Issuer Purchases of Equity Securities 22<br />
ITEM 6. Selected Financial Data 25<br />
ITEM 7. Management's Discussion and Analysis of Financial Condition and Results of Operations 26<br />
ITEM 7A. Quantitative and Qualitative Disclosures About Market Risk 44<br />
ITEM 8. Financial Statements and Supplementary Data 45<br />
ITEM 9. Changes in and Disagreements with Accountants on Accounting and Financial Disclosure 45<br />
ITEM 9A. Controls and Procedures 45<br />
ITEM 9B. Other Information 45<br />
PART III<br />
ITEM 10. Directors, Executive Officers and Corporate Governance 46<br />
ITEM 11. Executive Compensation 46<br />
ITEM 12.<br />
Security Ownership of Certain Beneficial Owners and Management and<br />
Related Stockholder Matters 46<br />
ITEM 13. Certain Relationships and Related Transactions, and Director Independence 47<br />
ITEM 14. Principal Accounting Fees and Services 47<br />
PART IV<br />
ITEM 15. Exhibits, Financial Statement Schedules 48<br />
SIGNATURES<br />
(i)
PART I<br />
ITEM 1. Business<br />
General<br />
<strong>EOG</strong> <strong>Resources</strong>, <strong>Inc</strong>., a Delaware corporation organized in 1985, together with its subsidiaries (collectively,<br />
<strong>EOG</strong>), explores for, develops, produces and markets natural gas and crude oil primarily in major producing basins in the<br />
United States of America (United States), Canada, The Republic of Trinidad and Tobago (Trinidad), the United<br />
Kingdom, The People's Republic of China (China) and, from time to time, select other international areas. <strong>EOG</strong>'s<br />
principal producing areas are further described in "Exploration and Production" below. <strong>EOG</strong>'s <strong>Annual</strong> <strong>Report</strong>s on Form<br />
10-K, Quarterly <strong>Report</strong>s on Form 10-Q, Current <strong>Report</strong>s on Form 8-K and any amendments to those reports are made<br />
available, free of charge, through <strong>EOG</strong>'s website, as soon as reasonably practicable after such reports have been filed<br />
with the United States Securities and Exchange Commission (SEC). <strong>EOG</strong>'s website address is<br />
http://www.eogresources.com.<br />
At December 31, <strong>2009</strong>, <strong>EOG</strong>'s total estimated net proved reserves were 10,776 billion cubic feet equivalent<br />
(Bcfe), of which 8,898 billion cubic feet (Bcf) were natural gas reserves and 220 million barrels (MMBbl), or 1,317<br />
Bcfe, were crude oil and condensate reserves and 93 MMBbl, or 561 Bcfe, were natural gas liquids reserves (see<br />
Supplemental Information to Consolidated Financial Statements). At such date, approximately 75% of <strong>EOG</strong>'s reserves<br />
(on a natural gas equivalent basis) were located in the United States, 16% in Canada and 9% in Trinidad. As of<br />
December 31, <strong>2009</strong>, <strong>EOG</strong> employed approximately 2,100 persons, including foreign national employees.<br />
<strong>EOG</strong>'s business strategy is to maximize the rate of return on investment of capital by controlling operating and<br />
capital costs. This strategy is intended to enhance the generation of cash flow and earnings from each unit of production<br />
on a cost-effective basis. <strong>EOG</strong> focuses on the cost-effective utilization of advances in technology associated with the<br />
gathering, processing and interpretation of three-dimensional (3-D) seismic data, the development of reservoir<br />
simulation models, the use of new and/or improved drill bits, mud motors and mud additives, horizontal drilling,<br />
formation logging techniques and reservoir stimulation/completion methods. These advanced technologies are used, as<br />
appropriate, throughout <strong>EOG</strong> to reduce the risks associated with all aspects of oil and gas exploration, development and<br />
exploitation. <strong>EOG</strong> implements its strategy by emphasizing the drilling of internally generated prospects in order to find<br />
and develop low cost reserves. <strong>EOG</strong> also makes select strategic acquisitions that result in additional economies of scale<br />
or land positions which provide significant additional prospects. Maintaining the lowest possible operating cost<br />
structure that is consistent with prudent and safe operations is also an important goal in the implementation of <strong>EOG</strong>'s<br />
strategy.<br />
With respect to information on <strong>EOG</strong>'s working interest in wells or acreage, "net" oil and gas wells or<br />
acreage are determined by multiplying "gross" oil and gas wells or acreage by <strong>EOG</strong>'s working interest in the wells or<br />
acreage.<br />
Business Segments<br />
<strong>EOG</strong>'s operations are all natural gas and crude oil exploration and production related.<br />
Exploration and Production<br />
United States and Canada Operations<br />
<strong>EOG</strong>'s operations are focused on most of the productive basins in the United States and Canada.<br />
At December 31, <strong>2009</strong>, 81% of <strong>EOG</strong>'s net proved United States and Canada reserves (on a natural gas<br />
equivalent basis) were natural gas and 19% were crude oil and condensate and natural gas liquids. Substantial<br />
portions of these reserves are in long-lived fields with well-established production characteristics. <strong>EOG</strong> believes that<br />
opportunities exist to increase production through continued development in and around many of these fields and<br />
through the utilization of the applicable technologies described above. <strong>EOG</strong> also maintains an active exploration<br />
program designed to extend fields and add new trends and resource plays to its broad portfolio. The following is a<br />
summary of significant developments during <strong>2009</strong> and certain 2010 plans for <strong>EOG</strong>'s United States and Canada<br />
operations.<br />
1
United States. In <strong>2009</strong>, <strong>EOG</strong> completed 116 net gas wells in the Barnett Shale play of the Fort Worth<br />
Basin. <strong>EOG</strong> uses the term Combo wells to refer to wells that derive economic value from crude oil and condensate,<br />
natural gas liquids and associated natural gas in relatively equal portions. During <strong>2009</strong>, <strong>EOG</strong> completed 94 net<br />
Combo wells in the Barnett Shale play. During the year, <strong>EOG</strong>'s total production from the Barnett Shale play grew to<br />
an average net daily rate of 400 million cubic feet per day (MMcfd) of natural gas and 13.1 thousand barrels per day<br />
(MBbld) of crude oil and condensate and natural gas liquids. <strong>EOG</strong>'s <strong>2009</strong> liquids production from the Barnett Shale<br />
play increased by approximately 97% compared to 2008. For 2010, <strong>EOG</strong> plans to drill approximately 234 net<br />
Barnett Shale Combo wells. Primary 2010 growth for <strong>EOG</strong> in the Barnett Shale will be provided by crude oil and<br />
natural gas liquids. During the third quarter of <strong>2009</strong>, <strong>EOG</strong> acquired certain crude oil and natural gas properties and<br />
related assets in the Barnett Shale consisting of proved developed and undeveloped reserves and approximately<br />
33,000 net unproved acres. With a total of approximately 840,000 net acres, <strong>EOG</strong> is one of the largest leaseholders<br />
in the Barnett Shale play, providing <strong>EOG</strong> with long-term reserve and production growth potential for years to come.<br />
Throughout the Rocky Mountain area, <strong>EOG</strong> expanded its acreage position with the addition of prospective<br />
crude oil acreage in <strong>2009</strong>. <strong>EOG</strong> now holds approximately 1.5 million net acres in the Rocky Mountain area,<br />
including over 500,000 net acres throughout the Williston Basin of North Dakota and Montana available for<br />
exploration in the Bakken and Three Forks plays. In addition, <strong>EOG</strong> also holds acreage in the Rocky Mountain area<br />
relating to certain potential exploration and development prospects which <strong>EOG</strong> is currently evaluating. During<br />
<strong>2009</strong>, <strong>EOG</strong> drilled 106 net wells in the Uinta Basin, Utah, and 57 net wells in the Williston Basin. Production from<br />
the Rocky Mountain area increased 14% primarily through increased liquids production. The net average production<br />
for <strong>2009</strong> was 240 MMcfd of natural gas and 34.7 MBbld of crude oil and condensate and natural gas liquids. In<br />
December <strong>2009</strong>, <strong>EOG</strong> and a third party exchanged certain natural gas related properties in the Rocky Mountain area.<br />
In 2010, <strong>EOG</strong> intends to increase its activity level in the Bakken and Three Forks plays in the Williston Basin by<br />
drilling over 95 net wells. <strong>EOG</strong> will have limited drilling activity on its core natural gas assets within the Rocky<br />
Mountain area and will primarily focus on exploiting and expanding the oil resource plays.<br />
In <strong>2009</strong>, <strong>EOG</strong> continued to expand its activities in the Mid-Continent area with continued growth and<br />
extension of the Western Anadarko Basin and Hugoton Deep core areas. For the year, <strong>EOG</strong> averaged net production<br />
of 76 MMcfd of natural gas and 5.3 MBbld of crude oil and condensate and natural gas liquids. Total crude oil and<br />
condensate and natural gas liquids volumes increased 15% in <strong>2009</strong> compared to 2008. In Southwest Kansas, <strong>EOG</strong><br />
continued its active drilling program focused on high potential Morrow and St. Louis targets in a broad area, which<br />
is part of the 900,000 gross acres <strong>EOG</strong> controls in the Hugoton Deep play. In the Western Anadarko Basin, <strong>EOG</strong><br />
continued its successful horizontal exploitation of the Cleveland sandstone, drilling 13 net wells with per well initial<br />
production rates of approximately 500 barrels of oil per day. Since 2002, <strong>EOG</strong> has drilled over 200 net wells in this<br />
play and holds approximately 65,000 acres throughout the trend. <strong>EOG</strong> significantly expanded its acreage position in<br />
the Western Anadarko Basin during <strong>2009</strong> with the addition of over 100,000 net acres focused on the extension of<br />
core plays, as well as multiple new liquids-rich plays which will be exploited in 2010 and beyond. <strong>EOG</strong> holds<br />
approximately 580,000 net acres in the Mid-Continent area.<br />
In the South Texas area, <strong>EOG</strong> experienced continued success in <strong>2009</strong>, drilling 54 net wells. During <strong>2009</strong>,<br />
net production averaged 204 MMcfd of natural gas and 7.5 MBbld of crude oil and condensate and natural gas<br />
liquids. <strong>EOG</strong>'s activity was focused in Webb, Zapata, San Patricio, Duval and Matagorda counties, where <strong>EOG</strong><br />
drilled successful wells in the Lobo, Roleta, Frio and Wilcox trends. <strong>EOG</strong> continued to focus on horizontal drilling,<br />
targeting the Perdido, Wilcox and Lobo sands. <strong>EOG</strong> also continued directional drilling under Nueces Bay. <strong>EOG</strong><br />
drilled a deeper pool wildcat discovery under Indian Point, along with additional development drilling, with seven<br />
wells drilled yielding over 34 Bcfe net proved reserves. <strong>EOG</strong> plans to significantly increase drilling activity in the<br />
South Texas area in 2010. Approximately 168 net wells are planned during 2010 for South Texas. <strong>EOG</strong> holds<br />
approximately 600,000 net acres in the South Texas area. In addition, <strong>EOG</strong> holds acreage in the South Texas area<br />
relating to certain potential exploration and development prospects which <strong>EOG</strong> is currently evaluating.<br />
Also during <strong>2009</strong>, <strong>EOG</strong> participated in 25 net wells and implemented five Wolfcamp waterfloods in the<br />
Permian Basin area. The wells drilled throughout the Permian Basin tested the Bone Spring, Wolfcamp, Permo-<br />
Penn and other objectives. Production for the year averaged approximately 69 MMcfd of natural gas and 7.1 MBbld<br />
of crude oil and condensate and natural gas liquids. <strong>EOG</strong> acquired approximately 230 square miles of 3-D data and<br />
added 100,000 net acres during <strong>2009</strong>. <strong>EOG</strong> holds approximately 490,000 net acres throughout the Permian Basin<br />
area. In 2010, <strong>EOG</strong> plans to continue the development of existing Permian Basin plays, acquire acreage positions in<br />
new plays and test new play concepts.<br />
2
In the Upper Gulf Coast area, <strong>EOG</strong> averaged 144 MMcfd of natural gas and 2.8 MBbld of crude oil and<br />
condensate and natural gas liquids production in <strong>2009</strong>. <strong>EOG</strong> drilled 31 net wells with 10 net wells being Travis Peak<br />
vertical stacked pays and Cotton Valley horizontal development wells located in East Texas and North Louisiana. A<br />
major growth driver for <strong>EOG</strong> in this area is the expanded Haynesville and Bossier Shale program that has grown<br />
from drilling two wells in late 2008 to 13 wells in <strong>2009</strong>. <strong>EOG</strong> expects to drill 48 net Haynesville and Bossier Shale<br />
wells in 2010 on the 159,000 net acres held in the play. Mississippi development focused on a combined crude oil<br />
and natural gas discovery at Mechanicsburg Field, where <strong>EOG</strong> drilled eight wells. In the fourth quarter of <strong>2009</strong>,<br />
<strong>EOG</strong> acquired 39,500 net unproved acres in Nacogdoches County, Texas, within the Haynesville and Bossier Shale<br />
formations and expects to acquire up to an additional 7,500 net acres as part of the same transaction during the first<br />
quarter of 2010. <strong>EOG</strong> holds approximately 370,000 net acres in the Upper Gulf Coast area.<br />
During <strong>2009</strong>, <strong>EOG</strong> continued the development of its Pennsylvania Marcellus Shale acreage, drilling a total<br />
of three gross vertical and 17 gross horizontal wells (13 net wells). Nine of the wells have been completed with most<br />
of those awaiting final construction of gas gathering system infrastructure to commence sales. The gas gathering<br />
systems being constructed by <strong>EOG</strong> should be completed by the end of the first quarter of 2010. Several wells tested<br />
at 24-hour rates in excess of 5 MMcfd. In 2010, <strong>EOG</strong> will continue to develop the Marcellus Shale, drilling an<br />
estimated 25 to 30 net wells. Most of the wells will be in the Seneca Joint Venture area in Clearfield, Elk and<br />
McKean Counties, Pennsylvania, where <strong>EOG</strong> holds a 50% working interest. Several wells are also planned for<br />
Bradford County, Pennsylvania, where <strong>EOG</strong> holds a 100% working interest. <strong>EOG</strong> currently holds approximately<br />
225,000 net acres in the Pennsylvania Marcellus Shale.<br />
At December 31, <strong>2009</strong>, <strong>EOG</strong> held approximately 4,185,000 net undeveloped acres in the United States.<br />
During <strong>2009</strong>, <strong>EOG</strong> continued the expansion of its gathering and processing activities in the Barnett Shale<br />
play of North Texas and the Bakken play of North Dakota. In <strong>2009</strong>, <strong>EOG</strong> placed into operation one 40 MMcfd<br />
natural gas processing plant in the Barnett Combo play of North Texas, and began construction of a second 40<br />
MMcfd processing unit which is expected to begin operation during the second quarter of 2010. <strong>EOG</strong> also expanded<br />
its gathering system in the Barnett Combo play to transport production to its processing plant and continued<br />
expansion of its gathering system in the Bakken play.<br />
In the North Dakota Bakken play, <strong>EOG</strong> constructed and placed in service during February 2010 a 76-mile,<br />
12-inch diameter "dense phase" natural gas gathering pipeline connecting its Stanley, North Dakota, gathering<br />
system with the Alliance Pipeline, near Upham, North Dakota. The Alliance Pipeline transports natural gas to the<br />
Chicago, Illinois, area. <strong>EOG</strong> also replaced its 20 MMcfd natural gas liquids processing plant, located near Stanley,<br />
North Dakota, with an 80 MMcfd refrigeration oil/condensate removal plant. In combination, these projects will<br />
allow <strong>EOG</strong> to more efficiently transport the associated natural gas and natural gas liquids production from its<br />
Bakken oil wells. At year-end <strong>2009</strong>, the combined throughput of these systems was 15 MMcfd of natural gas.<br />
Additionally, in support of its operations in the Bakken play, <strong>EOG</strong> constructed a crude oil loading facility<br />
near Stanley, North Dakota, designed to load crude oil into 100-car unit trains for transport to Stroud, Oklahoma. At<br />
Stroud, Oklahoma, <strong>EOG</strong> constructed a crude oil offloading facility and a pipeline to transport the crude oil to the<br />
Cushing, Oklahoma, trading hub. The first shipment of crude oil through these facilities occurred at year-end <strong>2009</strong>.<br />
When fully operational, the capacity of these facilities is expected to allow transport of approximately 60,000 barrels<br />
per day of Bakken crude oil.<br />
<strong>EOG</strong> expects to continue expanding its gathering and processing facilities to accommodate the drilling<br />
activity in the Barnett Shale and Bakken plays. The North Texas systems total over 70 miles of 8-inch, 10-inch and<br />
20-inch diameter pipe, while the North Dakota system totals 290 miles of 8-inch and 12-inch pipe.<br />
3
Canada. <strong>EOG</strong> conducts operations through its subsidiary, <strong>EOG</strong> <strong>Resources</strong> Canada <strong>Inc</strong>. (<strong>EOG</strong>RC), from<br />
offices in Calgary, Alberta. During <strong>2009</strong>, <strong>EOG</strong>RC departed from its historical vertical shallow natural gas drilling<br />
program to focus on bigger target horizontal gas growth in the Horn River Basin and horizontal crude oil growth<br />
within existing legacy fields, mainly in Waskada, Manitoba and Highvale, Alberta. During <strong>2009</strong>, <strong>EOG</strong>RC drilled or<br />
participated in 98 net wells, 60 of which were horizontal wells and 38 of which were vertical wells.<br />
Correspondingly, net crude oil and condensate and natural gas liquids production increased by 41% to 5.2 MBbld<br />
and natural gas production increased 1% to 224 MMcfd due to this shift in focus. The horizontal production growth<br />
strategy will continue in 2010 with 12 net horizontal gas wells planned in the Horn River Basin and 120 net<br />
horizontal oil wells planned in Waskada and other projects. <strong>EOG</strong>RC acquired 530,000 net acres during the<br />
economic downturn in <strong>2009</strong> which will set up numerous exploration and development opportunities in 2010 and<br />
beyond.<br />
At December 31, <strong>2009</strong>, <strong>EOG</strong>RC held approximately 1,660,000 net undeveloped acres in Canada.<br />
Operations Outside the United States and Canada<br />
<strong>EOG</strong> has operations in Trinidad, the United Kingdom North Sea and East Irish Sea and the China Sichuan<br />
Basin, and is evaluating additional exploration, development and exploitation opportunities in those and other<br />
international areas.<br />
Trinidad. <strong>EOG</strong>, through several of its subsidiaries, including <strong>EOG</strong> <strong>Resources</strong> Trinidad Limited,<br />
holds an 80% working interest in the South East Coast Consortium (SECC) Block offshore Trinidad,<br />
except in the Deep Ibis area in which <strong>EOG</strong>'s working interest decreased as a result of a third-party farmout<br />
agreement;<br />
holds an 80% working interest in the exploration and production license covering the Pelican field and<br />
its related facilities;<br />
holds a 100% working interest in a production sharing contract with the Government of Trinidad and<br />
Tobago for each of the Modified U(a) Block, Modified U(b) Block and Block 4(a);<br />
owns a 12% equity interest in an anhydrous ammonia plant in Point Lisas, Trinidad, that is owned and<br />
operated by Caribbean Nitrogen Company Limited (CNCL); and<br />
owns a 10% equity interest in an anhydrous ammonia plant in Point Lisas, Trinidad, that is owned and<br />
operated by Nitrogen (2000) Unlimited (N2000).<br />
Several fields in the SECC Block, Modified U(a) Block and Modified U(b) Block as well as the Pelican<br />
Field have been developed and are producing. In the Pelican field, <strong>EOG</strong> drilled a successful exploratory well in late<br />
January 2010 that is expected to begin producing by the end of the first quarter of 2010. In Block 4(a), <strong>EOG</strong><br />
installed offshore facilities and plans to drill development wells to supply natural gas under a contract with the<br />
National Gas Company of Trinidad and Tobago (NGC) if the North Eastern Offshore (NEO) pipeline is installed by<br />
NGC. The NEO pipeline has not been completed, and <strong>EOG</strong> plans to source the natural gas for this contract from its<br />
existing fields until the NEO pipeline is completed. Sales under the contract commenced on January 1, 2010. Given<br />
<strong>EOG</strong>'s current level of equity ownership in CNCL and N2000 and its ability to exercise significant influence over<br />
certain material actions, it accounts for these investments using the equity method. During <strong>2009</strong>, <strong>EOG</strong> recognized<br />
equity income of $0.5 million and received cash dividends of $3 million from CNCL and recognized equity income<br />
of $3 million and received cash dividends of $4 million from N2000.<br />
Natural gas from <strong>EOG</strong>'s Trinidad operations currently is sold to NGC or its subsidiary. Crude oil and<br />
condensate from <strong>EOG</strong>'s Trinidad operations currently is sold to the Petroleum Company of Trinidad and Tobago.<br />
In <strong>2009</strong>, <strong>EOG</strong>'s average net production from Trinidad was 273 MMcfd of natural gas and 3.1 MBbld of<br />
crude oil and condensate.<br />
At December 31, <strong>2009</strong>, <strong>EOG</strong> held approximately 156,000 net undeveloped acres in Trinidad.<br />
United Kingdom. In 2002, <strong>EOG</strong>'s subsidiary, <strong>EOG</strong> <strong>Resources</strong> United Kingdom Limited (<strong>EOG</strong>UK),<br />
acquired a 25% non-operating working interest in a portion of Block 49/16, located in the Southern Gas Basin of the<br />
North Sea. In August 2004, production commenced in the Valkyrie field in the Southern Gas Basin.<br />
4
In 2003, <strong>EOG</strong>UK acquired a 30% non-operating working interest in a portion of Blocks 53/1 and 53/2.<br />
These blocks are also located in the Southern Gas Basin of the North Sea. Since November 2003, three successful<br />
exploratory wells have been drilled in the Arthur field, with production commencing in January 2005. There is<br />
currently one remaining producing well in the Arthur field and this well is expected to cease production during the<br />
first half of 2010.<br />
In 2006, <strong>EOG</strong>UK participated in the drilling and successful testing of the Columbus prospect in the Central<br />
North Sea Block 23/16f. A successful Columbus prospect appraisal well was drilled during the third quarter of<br />
2007. The field operator expects to submit a revised field development plan to the United Kingdom (U.K.)<br />
Department of Energy and Climate Change during the second quarter of 2010 and anticipates receiving approval of<br />
this plan in late 2010. The operator and partners are currently evaluating an export route for production from the<br />
project.<br />
During the third quarter of <strong>2009</strong>, <strong>EOG</strong> completed a farm-in agreement with owners of the Central North Sea<br />
Block 15/30a Area AB. In December <strong>2009</strong>, <strong>EOG</strong>, as operator, drilled an exploratory well on this prospect, which<br />
was declared a dry hole in January 2010.<br />
During the second quarter of <strong>2009</strong>, <strong>EOG</strong>UK drilled two exploratory wells in the East Irish Sea. Well<br />
110/14b-7, in which <strong>EOG</strong>UK has a 70% working interest, was a dry hole while well 110/12-6, in which <strong>EOG</strong>UK has<br />
100% working interest, was an oil discovery and was designated the Conwy field. Engineering studies were initiated<br />
with an intent to submit a field development plan to the U.K. Department of Energy and Climate Change during the<br />
first quarter of 2010. A rig has been contracted and has begun drilling two further exploratory wells offsetting the<br />
Conwy field. The first of the wells was declared a dry hole in February 2010. Results are expected for the second<br />
well by the end of the first quarter of 2010. The licenses for the East Irish Sea were awarded to <strong>EOG</strong>UK in 2007.<br />
In <strong>2009</strong>, production averaged 7 MMcfd of natural gas, net, in the United Kingdom.<br />
At December 31, <strong>2009</strong>, <strong>EOG</strong> held approximately 277,000 net undeveloped acres in the United Kingdom.<br />
China. In July 2008, <strong>EOG</strong> acquired rights from ConocoPhillips in a Petroleum Contract covering the<br />
Chuanzhong Block exploration area in the Sichuan Basin, Sichuan Province, China. In October 2008, <strong>EOG</strong> obtained<br />
the rights to shallower zones on the acreage acquired.<br />
During the second quarter of <strong>2009</strong>, <strong>EOG</strong> completed a monitoring well and in the third quarter of <strong>2009</strong>,<br />
drilled a horizontal well, which will be completed and tested during the first quarter of 2010. During the third<br />
quarter of <strong>2009</strong>, <strong>EOG</strong> drilled a second monitoring well to evaluate one of the shallower zones and is currently<br />
drilling a second horizontal well that is expected to be completed during the third quarter of 2010.<br />
In <strong>2009</strong>, production averaged 8 million cubic feet equivalent per day of natural gas, net, in China.<br />
At December 31, <strong>2009</strong>, <strong>EOG</strong> held approximately 130,000 net acres in China.<br />
Other International. <strong>EOG</strong> continues to evaluate other select natural gas and crude oil opportunities outside<br />
the United States and Canada primarily by pursuing exploitation opportunities in countries where indigenous natural<br />
gas and crude oil reserves have been identified.<br />
Marketing<br />
Wellhead Marketing. In <strong>2009</strong>, <strong>EOG</strong>'s United States and Canada wellhead natural gas production was sold on<br />
the spot market and under long-term natural gas contracts based on prevailing market prices. In many instances, the<br />
long-term contract prices closely approximated the prices received for natural gas sold on the spot market. In 2010, the<br />
pricing mechanism for such production is expected to remain the same.<br />
In <strong>2009</strong>, a large majority of the wellhead natural gas volumes from Trinidad were sold under contracts with<br />
prices which were either wholly or partially dependent on Caribbean ammonia index prices and/or methanol prices. The<br />
remaining volumes were sold under a contract at prices partially dependent on the United States Henry Hub market<br />
prices. The pricing mechanisms for these contracts in Trinidad is expected to remain the same in 2010.<br />
5
In <strong>2009</strong>, over 90% of the wellhead natural gas volumes from the United Kingdom were sold on the spot<br />
market. The remaining volumes were sold by means of forward contracts. The 2010 marketing strategy for the<br />
wellhead natural gas volumes in the United Kingdom is to sell all natural gas on the spot market.<br />
In <strong>2009</strong>, all of the wellhead natural gas volumes from China were sold under a contract with prices based on<br />
the purchaser's pipeline sales prices to various local market segments. The pricing mechanism for the contract in<br />
China is expected to remain the same in 2010.<br />
Substantially all of <strong>EOG</strong>'s wellhead crude oil and condensate and natural gas liquids are sold under various<br />
terms and arrangements based on prevailing market prices.<br />
In certain instances, <strong>EOG</strong> purchases and sells third-party natural gas production in order to balance firm<br />
transportation capacity with production in certain areas.<br />
During <strong>2009</strong>, no single purchaser accounted for 10% or more of <strong>EOG</strong>'s natural gas, crude oil and condensate<br />
and natural gas liquids revenues. <strong>EOG</strong> does not believe that the loss of any single purchaser would have a material<br />
adverse effect on its financial condition or results of operations.<br />
6
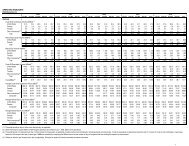
Wellhead Volumes and Prices<br />
The following table sets forth certain information regarding <strong>EOG</strong>'s wellhead volumes of, and average prices<br />
for, natural gas per thousand cubic feet (Mcf), crude oil and condensate per barrel (Bbl) and natural gas liquids per Bbl.<br />
The table also presents natural gas equivalent volumes which are determined using the ratio of 6.0 Mcf of natural gas to<br />
1.0 Bbl of crude oil and condensate or natural gas liquids for each of the years ended December 31, <strong>2009</strong>, 2008 and<br />
2007.<br />
Year Ended December 31 <strong>2009</strong> 2008 2007<br />
Natural Gas Volumes (MMcfd) (1)<br />
United States 1,134 1,162 971<br />
Canada 224 222 224<br />
Trinidad 273 218 252<br />
Other International (2) 14 17 23<br />
Total 1,645 1,619 1,470<br />
Crude Oil and Condensate Volumes (MBbld) (1)<br />
United States 47.9 39.5 24.6<br />
Canada 4.1 2.7 2.4<br />
Trinidad 3.1 3.2 4.1<br />
Other International (2) 0.1 0.1 0.1<br />
Total 55.2 45.5 31.2<br />
Natural Gas Liquids Volumes (MBbld) (1)<br />
United States 22.5 15.0 11.1<br />
Canada 1.1 1.0 1.1<br />
Total 23.6 16.0 12.2<br />
Natural Gas Equivalent Volumes (MMcfed) (3)<br />
United States 1,556 1,490 1,184<br />
Canada 256 244 245<br />
Trinidad 291 237 276<br />
Other International (2) 15 17 24<br />
Total 2,118 1,988 1,729<br />
Total Bcfe (3) 773.0 727.6 631.3<br />
Average Natural Gas Prices ($/Mcf) (4)<br />
United States $ 3.72 $ 8.22 $ 6.27<br />
Canada 3.85 7.64 6.25<br />
Trinidad 1.73 3.58 2.71<br />
Other International (2) 4.34 8.18 6.19<br />
Composite 3.42 7.51 5.65<br />
Average Crude Oil and Condensate Prices ($/Bbl) (4)<br />
United States $ 54.42 $ 87.68 $ 68.85<br />
Canada 57.72 89.70 65.27<br />
Trinidad 50.85 92.90 69.84<br />
Other International (2) 53.07 99.30 66.84<br />
Composite 54.46 88.18 68.69<br />
Average Natural Gas Liquids Prices ($/Bbl) (4)<br />
United States $ 30.03 $ 53.33 $ 47.63<br />
Canada 30.49 54.77 44.54<br />
Composite 30.05 53.42 47.36<br />
(1) Million cubic feet per day or thousand barrels per day, as applicable.<br />
(2) Other International includes <strong>EOG</strong>'s United Kingdom operations and, effective July 1, 2008, <strong>EOG</strong>'s China operations.<br />
(3) Million cubic feet equivalent per day or billion cubic feet equivalent, as applicable; includes natural gas, crude oil and<br />
condensate and natural gas liquids.<br />
(4) Dollars per thousand cubic feet or per barrel, as applicable.<br />
7
Competition<br />
<strong>EOG</strong> competes with major integrated oil and gas companies and other independent oil and gas companies<br />
for the acquisition of licenses and leases, properties and reserves and the equipment, materials, services and<br />
employees and other personnel (including geologists, geophysicists, engineers and other specialists) required to<br />
explore for, develop, produce and market natural gas and crude oil. Moreover, many of <strong>EOG</strong>'s competitors have<br />
financial and other resources substantially greater than those <strong>EOG</strong> possesses and have established strategic long-term<br />
positions and strong governmental relationships in countries in which <strong>EOG</strong> may seek new or expanded entry. As a<br />
consequence, <strong>EOG</strong> may be at a competitive disadvantage in certain respects, such as in bidding for drilling rights. In<br />
addition, many of <strong>EOG</strong>'s larger competitors may have a competitive advantage when responding to factors that affect<br />
demand for natural gas and crude oil, such as changing worldwide prices and levels of production and the cost and<br />
availability of alternative fuels. <strong>EOG</strong> also faces competition from competing energy sources, such as liquefied<br />
natural gas imported into the United States from other countries, and, to a lesser extent, alternative energy sources.<br />
Regulation<br />
United States Regulation of Natural Gas and Crude Oil Production. Natural gas and crude oil production<br />
operations are subject to various types of regulation, including regulation in the United States by state and federal<br />
agencies.<br />
United States legislation affecting the oil and gas industry is under constant review for amendment or<br />
expansion. Also, numerous departments and agencies, both federal and state, are authorized by statute to issue and have<br />
issued rules and regulations which, among other things, require permits for the drilling of wells, regulate the spacing of<br />
wells, prevent the waste of natural gas and liquid hydrocarbon resources through proration and restrictions on flaring,<br />
require drilling bonds, regulate environmental and safety matters and regulate the calculation and disbursement of<br />
royalty payments, production taxes and ad valorem taxes.<br />
A substantial portion of <strong>EOG</strong>'s oil and gas leases in Utah, New Mexico, Wyoming and the Gulf of Mexico, as<br />
well as some in other areas, are granted by the federal government and administered by the Bureau of Land Management<br />
(BLM) and the Minerals Management Service (MMS), both federal agencies. Operations conducted by <strong>EOG</strong> on federal<br />
oil and gas leases must comply with numerous additional statutory and regulatory restrictions. Certain operations must<br />
be conducted pursuant to appropriate permits issued by the BLM and the MMS.<br />
BLM and MMS leases contain relatively standardized terms requiring compliance with detailed regulations<br />
and, in the case of offshore leases, orders pursuant to the Outer Continental Shelf Lands Act (which are subject to<br />
change by the MMS). Such offshore operations are subject to numerous regulatory requirements, including the need for<br />
prior MMS approval for exploration, development and production plans; stringent engineering and construction<br />
specifications applicable to offshore production facilities; regulations restricting the flaring or venting of production;<br />
regulations governing the plugging and abandonment of offshore wells; and the removal of all production facilities.<br />
Under certain circumstances, the MMS may require operations on federal leases to be suspended or terminated. Any<br />
such suspension or termination could materially and adversely affect <strong>EOG</strong>'s interests.<br />
The transportation and sale for resale of natural gas in interstate commerce are regulated pursuant to the<br />
Natural Gas Act of 1938 (NGA) and the Natural Gas Policy Act of 1978. These statutes are administered by the Federal<br />
Energy Regulatory Commission (FERC). Effective January 1, 1993, the Natural Gas Wellhead Decontrol Act of 1989<br />
deregulated natural gas prices for all "first sales" of natural gas, which includes all sales by <strong>EOG</strong> of its own production.<br />
All other sales of natural gas by <strong>EOG</strong>, such as those of natural gas purchased from third parties, remain jurisdictional<br />
sales subject to a blanket sales certificate under the NGA, which has flexible terms and conditions. Consequently, all of<br />
<strong>EOG</strong>'s sales of natural gas currently may be made at market prices, subject to applicable contract provisions. <strong>EOG</strong>'s<br />
jurisdictional sales, however, are subject to the future possibility of greater federal oversight, including the possibility<br />
that the FERC might prospectively impose more restrictive conditions on such sales. Conversely, sales of crude oil and<br />
condensate and natural gas liquids by <strong>EOG</strong> are made at unregulated market prices.<br />
8
<strong>EOG</strong> owns certain natural gas pipelines that it believes meet the traditional tests the FERC has used to establish<br />
a pipeline's status as a gatherer not subject to FERC jurisdiction under the NGA. State regulation of gathering facilities<br />
generally includes various safety, environmental and, in some circumstances, nondiscriminatory take requirements, but<br />
does not generally entail rate regulation. <strong>EOG</strong>'s gathering operations could be materially and adversely affected should<br />
they be subject in the future to the application of state or federal regulation of rates and services.<br />
<strong>EOG</strong>'s gathering operations also may be, or become, subject to safety and operational regulations relating to<br />
the design, installation, testing, construction, operation, replacement and management of such facilities. Additional rules<br />
and legislation pertaining to these matters are considered and/or adopted from time to time. Although <strong>EOG</strong> cannot<br />
predict what effect, if any, such legislation might have on its operations and financial condition, the industry could be<br />
required to incur additional capital expenditures and increased costs depending on future legislative and regulatory<br />
changes.<br />
Proposals and proceedings that might affect the oil and gas industry are considered from time to time by<br />
Congress, the state legislatures, the FERC and the federal and state regulatory commissions and courts. <strong>EOG</strong> cannot<br />
predict when or whether any such proposals or proceedings may become effective. It should also be noted that the oil<br />
and gas industry historically has been very heavily regulated; therefore, there is no assurance that the less regulated<br />
approach currently being followed by the FERC will continue indefinitely.<br />
Environmental Regulation - United States. Various federal, state and local laws and regulations covering the<br />
discharge of materials into the environment, or otherwise relating to the protection of the environment, affect <strong>EOG</strong>'s<br />
operations and costs as a result of their effect on natural gas and crude oil exploration, development and production<br />
operations. These laws and regulations could cause <strong>EOG</strong> to incur remediation or other corrective action costs in<br />
connection with a release of regulated substances, including crude oil, into the environment. In addition, <strong>EOG</strong> has<br />
acquired certain oil and gas properties from third parties whose actions with respect to the management and disposal or<br />
release of hydrocarbons or other wastes were not under <strong>EOG</strong>'s control and, under environmental laws and regulations,<br />
<strong>EOG</strong> could be required to remove or remediate wastes disposed of or released by prior owners or operators. <strong>EOG</strong> also<br />
could incur costs related to the clean-up of sites to which it sent regulated substances for disposal or to which it sent<br />
equipment for cleaning, and for damages to natural resources or other claims related to releases of regulated<br />
substances at such sites. In addition, <strong>EOG</strong> could be responsible under environmental laws and regulations for oil and<br />
gas properties in which <strong>EOG</strong> owns an interest but is not the operator. Moreover, <strong>EOG</strong> is subject to the United States<br />
Environmental Protection Agency's (U.S. EPA) rule requiring annual reporting of greenhouse gas (GHG) emissions.<br />
Compliance with such laws and regulations increases <strong>EOG</strong>'s overall cost of business, but has not had, to date, a<br />
material adverse effect on <strong>EOG</strong>'s operations, financial condition, results of operations or competitive position. It is not<br />
anticipated, based on current laws and regulations, that <strong>EOG</strong> will be required in the near future to expend amounts<br />
(whether for environmental control facilities or otherwise) that are material in relation to its total exploration and<br />
development expenditure program in order to comply with such laws and regulations but, inasmuch as such laws and<br />
regulations are frequently changed, <strong>EOG</strong> is unable to predict the ultimate cost of compliance or the effect on <strong>EOG</strong>'s<br />
operations, financial condition, results of operations and competitive position.<br />
<strong>EOG</strong> is aware of the increasing focus of local, state, national and international regulatory bodies on GHG<br />
emissions and climate change issues. In addition to the U.S. EPA's rule requiring annual reporting of GHG emissions,<br />
<strong>EOG</strong> is also aware of legislation proposed by United States lawmakers to reduce GHG emissions. <strong>EOG</strong> is unable to<br />
predict the timing, scope and effect of any such proposed laws, regulations and treaties, but the direct and indirect costs<br />
of such laws, regulations and treaties (if enacted) could materially and adversely affect <strong>EOG</strong>'s business, results of<br />
operations, financial condition and competitive position.<br />
<strong>EOG</strong> supports efforts to understand and address the contribution of human activities to global climate change<br />
through the application of sound scientific research and analysis. Moreover, <strong>EOG</strong> believes that its strategy to reduce<br />
GHG emissions throughout its operations is in the best interest of the environment and a generally good business<br />
practice. <strong>EOG</strong> will continue to review the risks to its business and operations associated with all environmental matters,<br />
including climate change. In addition, <strong>EOG</strong> will continue to monitor and assess any new policies, legislation or<br />
regulations in the areas where it operates to determine the impact on its operations and take appropriate actions, where<br />
necessary.<br />
9
Canadian Regulation of Natural Gas and Crude Oil Production. The oil and gas industry in Canada is subject<br />
to extensive controls and regulations imposed by various levels of government. These regulatory authorities may<br />
impose regulations on or otherwise intervene in the oil and gas industry with respect to prices, taxes, transportation<br />
rates, the exportation of the commodity and, possibly, expropriation or cancellation of contract rights. Such<br />
regulations may be changed from time to time in response to economic, political or other factors. The<br />
implementation of new regulations or the modification of existing regulations affecting the oil and gas industry could<br />
reduce demand for these commodities or increase <strong>EOG</strong>'s costs and, therefore, may have a material adverse impact on<br />
<strong>EOG</strong>'s operations and financial condition.<br />
It is not expected that any of these controls or regulations will affect <strong>EOG</strong>'s operations in a manner<br />
materially different than they would affect other oil and gas companies of similar size; however, <strong>EOG</strong> is unable to<br />
predict what additional legislation or amendments may be enacted or how such additional legislation or amendments<br />
may affect <strong>EOG</strong>'s operations and financial condition.<br />
In addition, each province has regulations that govern land tenure, royalties, production rates and other<br />
matters. The royalty system in Canada is a significant factor in the profitability of natural gas and crude oil<br />
production. Royalties payable on production from freehold lands are determined by negotiations between the<br />
mineral owner and the lessee, although production from such lands is also subject to certain provincial taxes and<br />
royalties. Royalties payable on lands that the government has an interest in are determined by government regulation<br />
and are generally calculated as a percentage of the value of the gross production, and the rate of royalties payable<br />
generally depends in part on prescribed reference prices, well productivity, geographical location, field discovery<br />
date and the type and quality of the petroleum product produced. From time to time, the federal and provincial<br />
governments of Canada have also established incentive programs such as royalty rate reductions, royalty holidays<br />
and tax credits for the purpose of encouraging oil and gas exploration or enhanced recovery projects. These<br />
incentives generally have the effect of increasing our revenues, earnings and cash flow.<br />
The Alberta Government implemented a new oil and gas royalty framework effective January <strong>2009</strong>. The<br />
new framework establishes new royalties for conventional crude oil, natural gas and bitumen that are linked to price<br />
and production levels and apply to both new and existing conventional oil and gas activities and oil sands projects.<br />
Under the new framework, the formula for conventional oil and gas royalties uses a sliding rate formula, dependant<br />
on the market price and production volumes. Royalty rates for conventional crude oil range from 0% to 50% and<br />
natural gas royalty rates range from 5% to 50%.<br />
The Deep Oil Exploration Program (DOEP) and the Natural Gas Deep Drilling Program (NGDDP) are new<br />
programs that began January 1, <strong>2009</strong> in Alberta. These programs provide upfront royalty adjustments to new wells.<br />
To qualify for royalty adjustments under the DOEP, exploratory oil wells must have a vertical depth greater than<br />
2,000 meters with a government interest and must be spudded after January 1, <strong>2009</strong>. These oil wells qualify for a<br />
royalty exemption on either the first 1,000,000 Canadian dollars of royalty or the first 12 months of production,<br />
whichever comes first. The NGDDP applies to natural gas wells producing at a vertical depth greater than 2,500<br />
meters. The NGDDP will have an escalating royalty credit in line with progressively deeper wells from 625<br />
Canadian dollars per meter to a maximum of 3,750 Canadian dollars per meter. There are additional benefits for the<br />
deepest wells. Both the DOEP and the NGDDP are five-year programs. Any wells spudded after December 31,<br />
2013, or any wells for which <strong>EOG</strong> chooses the transition option described below, will not qualify under either<br />
program. No royalty adjustments will be granted under either the DOEP or the NGDDP after December 31, 2018.<br />
In November 2008, the Alberta Government announced that companies drilling new natural gas and<br />
conventional crude oil wells at depths between 1,000 and 3,500 meters, which are spudded between November 19,<br />
2008 and December 31, 2013, will have a one-time option of selecting new transitional royalty rates or the new<br />
royalty framework rates. The transition option provides lower royalties in the initial years of a well's life. For<br />
example, under the transition option, royalty rates for natural gas wells will range from 5% to 30%. The election is<br />
made prior to the end of the first calendar month in which the commodity is produced. All wells using the<br />
transitional royalty rates must shift to the new royalty framework rates on January 1, 2014.<br />
<strong>EOG</strong> expects these regulations of the Alberta Government to have a marginally positive impact on <strong>EOG</strong>'s<br />
financial condition and results of operations.<br />
10
Environmental Regulation - Canada. All phases of the oil and gas industry in Canada are subject to<br />
environmental regulation pursuant to a variety of Canadian federal, provincial and municipal laws and regulations.<br />
Such laws and regulations impose, among other things, restrictions, liabilities and obligations in connection with the<br />
generation, handling, use, storage, transportation, treatment and disposal of hazardous substances and wastes and in<br />
connection with spills, releases and emissions of various substances to the environment. These laws and regulations<br />
also require that facility sites and other properties associated with <strong>EOG</strong>'s operations be operated, maintained,<br />
abandoned and reclaimed to the satisfaction of applicable regulatory authorities. In addition, new projects or<br />
changes to existing projects may require the submission and approval of environmental assessments or permit<br />
applications.<br />
Spills and releases from <strong>EOG</strong>'s properties may have resulted, or may result, in soil and groundwater<br />
contamination in certain locations. Any contamination found on, under or originating from the properties may be<br />
subject to remediation requirements under Canadian laws. In addition, <strong>EOG</strong> has acquired certain oil and gas<br />
properties from third parties whose actions with respect to the management and disposal or release of hydrocarbons<br />
or other wastes were not under <strong>EOG</strong>'s control. Under Canadian laws and regulations, <strong>EOG</strong> could be required to<br />
remove or remediate wastes disposed of or released by prior owners or operators. In addition, <strong>EOG</strong> could be held<br />
responsible for oil and gas properties in which <strong>EOG</strong> owns an interest but is not the operator.<br />
These laws and regulations are subject to frequent change, and the clear trend is to place increasingly<br />
stringent limitations on activities that may affect the environment. Compliance with such laws and regulations<br />
increases <strong>EOG</strong>'s overall cost of business, but has not had, to date, a material adverse effect on <strong>EOG</strong>'s operations,<br />
financial condition, results of operations or competitive position. It is not anticipated, based on current laws and<br />
regulations, that <strong>EOG</strong> will be required in the near future to expend amounts (whether for environmental control facilities<br />
or otherwise) that are material in relation to its total exploration and development expenditure program in order to<br />
comply with such laws and regulations, but, inasmuch as such laws and regulations are frequently changed, <strong>EOG</strong> is<br />
unable to predict the ultimate cost of compliance or the effect on <strong>EOG</strong>'s operations, financial condition, results of<br />
operations and competitive position.<br />
As noted above, <strong>EOG</strong> is aware of the increasing focus of local, state, national and international regulatory<br />
bodies on GHG emissions and climate change issues. Canada is a signatory to the United Nations Framework<br />
Convention on Climate Change (also known as the Kyoto Protocol). The Canadian federal government has indicated<br />
an intention to regulate industrial emissions of GHG and air pollutants from a broad range of industrial sectors in the<br />
Regulatory Framework for Air Emissions released April 2007 and updated in a March 2008 document entitled<br />
Turning the Corner: Regulatory Framework for Industrial Greenhouse Gas Emissions (collectively, Federal Plan).<br />
The Federal Plan outlines proposed policies to reduce the emissions of GHG and air pollutants by establishing<br />
mandatory emissions reduction requirements on a sector basis. Sector-specific regulations could come into effect as<br />
early as 2010 and targets are expected to be based on percentages rather than absolute reductions. <strong>EOG</strong> is also aware<br />
of legislation proposed by the Canadian legislature to reduce GHG emissions as well as proposed regulations that<br />
would establish a credit emissions trading system in Canada. Additionally, regulation of GHG emissions in Canada<br />
takes place at the provincial and municipal level. For example, the Alberta Government regulates GHG emissions<br />
under the Climate Change and Emissions Management Act, the Specified Gas <strong>Report</strong>ing Regulation, which imposes<br />
GHG emissions reporting requirements, and the Specified Gas Emitters Regulation, which imposes GHG emissions<br />
limits.<br />
<strong>EOG</strong> is unable to predict the timing, scope and effect of any such proposed laws, regulations and treaties, but<br />
the direct and indirect costs of such enacted laws, regulations and treaties and, if enacted, proposed laws, regulations and<br />
treaties, could materially and adversely affect <strong>EOG</strong>'s business, results of operations, financial condition and competitive<br />
position.<br />
Other International Regulation. <strong>EOG</strong>'s exploration and production operations outside the United States and<br />
Canada are subject to various types of regulations imposed by the respective governments of the countries in which<br />
<strong>EOG</strong>'s operations are conducted, and may affect <strong>EOG</strong>'s operations and costs within that country. <strong>EOG</strong> currently has<br />
operations in Trinidad, the United Kingdom and China.<br />
11
Other Matters<br />
Energy Prices. Since <strong>EOG</strong> is primarily a natural gas producer, it is more significantly impacted by changes in<br />
natural gas prices than changes in prices for crude oil and condensate or natural gas liquids. Average United States and<br />
Canada wellhead natural gas prices have fluctuated, at times rather dramatically, during the last three years. These<br />
fluctuations resulted in a 54% decrease in the average wellhead natural gas price for production in the United States and<br />
Canada received by <strong>EOG</strong> from 2008 to <strong>2009</strong>, an increase of 30% from 2007 to 2008, and a decrease of 4% from 2006<br />
to 2007. The average New York Mercantile Exchange (NYMEX) natural gas strip price for 2010 has decreased<br />
approximately 9% subsequent to December 31, <strong>2009</strong>. Crude oil and condensate and natural gas liquids production<br />
comprised a larger portion of <strong>EOG</strong>'s production mix in <strong>2009</strong> than in prior years and is expected to comprise an even<br />
larger portion in 2010. Average crude oil and condensate prices received by <strong>EOG</strong> for production in the United States<br />
decreased by 38% in <strong>2009</strong>, increased by 27% in 2008 and increased by 10% in 2007, each as compared to the<br />
immediately preceding year. The average NYMEX crude oil strip price for 2010 has declined approximately 1%<br />
subsequent to December 31, <strong>2009</strong>. Due to the many uncertainties associated with the world political environment, the<br />
availabilities of other worldwide energy supplies and the relative competitive relationships of the various energy sources<br />
in the view of consumers, <strong>EOG</strong> is unable to predict what changes may occur in natural gas, crude oil and condensate,<br />
natural gas liquids, ammonia and methanol prices in the future. For additional discussion regarding changes in natural<br />
gas and crude oil prices and the risks that such changes may present to <strong>EOG</strong>, see ITEM 1A. Risk Factors.<br />
<strong>Inc</strong>luding the impact of <strong>EOG</strong>'s 2010 natural gas hedges, based on <strong>EOG</strong>'s tax position and the portion of <strong>EOG</strong>'s<br />
anticipated natural gas volumes for 2010 for which prices have not been determined under long-term marketing<br />
contracts, <strong>EOG</strong>'s price sensitivity for each $0.10 per Mcf change in wellhead natural gas price is approximately $30<br />
million for net income and $45 million for cash flows from operating activities. <strong>EOG</strong>'s price sensitivity in 2010 for each<br />
$1.00 per barrel change in wellhead crude oil and condensate price, combined with the related change in natural gas<br />
liquids price, is approximately $22 million for net income and $33 million for cash flows from operating activities. For<br />
information regarding <strong>EOG</strong>'s natural gas hedge position as of December 31, <strong>2009</strong>, see Note 11 to Consolidated<br />
Financial Statements.<br />
Risk Management. <strong>EOG</strong> engages in price risk management activities from time to time. These activities<br />
are intended to manage <strong>EOG</strong>'s exposure to fluctuations in commodity prices for natural gas and crude oil. <strong>EOG</strong><br />
utilizes financial commodity derivative instruments, primarily collar, price swap and basis swap contracts, as a<br />
means to manage this price risk. See Note 11 to Consolidated Financial Statements. In addition to financial<br />
transactions, <strong>EOG</strong> is a party to various physical commodity contracts for the sale of hydrocarbons that cover varying<br />
periods of time and have varying pricing provisions. Under the provisions of the Derivatives and Hedging Topic of<br />
the Accounting Standards Codification, these physical commodity contracts qualify for the normal purchases and<br />
normal sales exception and, therefore, are not subject to hedge accounting or mark-to-market accounting. The<br />
financial impact of physical commodity contracts is included in revenues at the time of settlement, which in turn<br />
affects average realized hydrocarbon prices. For a summary of <strong>EOG</strong>'s financial commodity derivative contracts, see<br />
ITEM 7. Management's Discussion and Analysis of Financial Condition and Results of Operations - Capital<br />
<strong>Resources</strong> and Liquidity - Derivative Transactions.<br />
All of <strong>EOG</strong>'s natural gas and crude oil activities are subject to the risks normally incident to the exploration<br />
for, and development and production of, natural gas and crude oil, including blowouts, cratering and fires, each of<br />
which could result in damage to life and/or property. <strong>EOG</strong>'s onshore and offshore operations are subject to usual<br />
customary perils, including hurricanes and other adverse weather conditions. <strong>EOG</strong>'s activities are also subject to<br />
governmental regulations as well as interruption or termination by governmental authorities based on environmental<br />
and other considerations. In accordance with customary industry practices, insurance is maintained by <strong>EOG</strong> against<br />
some, but not all, of these risks. Losses and liabilities arising from such events could reduce revenues and increase<br />
costs to <strong>EOG</strong> to the extent not covered by insurance.<br />
In addition, <strong>EOG</strong>'s operations outside of the United States are subject to certain risks, including<br />
expropriation of assets, risks of increases in taxes and government royalties, unilateral or forced renegotiation of<br />
contracts with foreign governments, political instability, payment delays, limits on allowable levels of production and<br />
currency exchange and repatriation losses, as well as changes in laws, regulations and policies governing operations<br />
of foreign companies. Please refer to ITEM 1A. Risk Factors for further discussion of the risks to which <strong>EOG</strong> is<br />
subject.<br />
12
Texas Severance Tax Rate Reduction. Natural gas production from qualifying Texas wells spudded or<br />
completed after August 31, 1996 is entitled to a reduced severance tax rate for the first 120 consecutive months of<br />
production. However, the cumulative value of the tax reduction cannot exceed 50 percent of the drilling and<br />
completion costs incurred on a well-by-well basis. For a discussion of the impact on <strong>EOG</strong>, see ITEM 7.<br />
Management's Discussion and Analysis of Financial Condition and Results of Operations - Results of Operations -<br />
Operating and Other Expenses.<br />
Executive Officers of the Registrant<br />
The current executive officers of <strong>EOG</strong> and their names and ages (as of February 25, 2010) are as follows:<br />
Name Age Position<br />
Mark G. Papa 63 Chairman of the Board and Chief Executive Officer; Director<br />
Loren M. Leiker 56 Senior Executive Vice President, Exploration<br />
Gary L. Thomas 60 Senior Executive Vice President, Operations<br />
Robert K. Garrison 57 Executive Vice President, Exploration<br />
Fredrick J. Plaeger, II 56 Senior Vice President and General Counsel<br />
Timothy K. Driggers 48 Vice President and Chief Financial Officer<br />
Mark G. Papa was elected Chairman of the Board and Chief Executive Officer of <strong>EOG</strong> in August 1999,<br />
President and Chief Executive Officer and director in September 1998, President and Chief Operating Officer in<br />
September 1997 and President in December 1996, and was President-North America Operations from February 1994<br />
to December 1996. Mr. Papa joined Belco Petroleum Corporation, a predecessor of <strong>EOG</strong>, in 1981. Mr. Papa is also<br />
a director of Oil States International, <strong>Inc</strong>., an oilfield service company, where he serves on the Compensation and<br />
Nominating and Corporate Governance committees. From July 2003 to April 2005, Mr. Papa served as a director of<br />
the general partner of Magellan Midstream Partners LP, a pipeline and terminal company, where he served as<br />
Chairman of the Compensation Committee and as a member of the Audit and Conflicts Committees. Mr. Papa is<br />
<strong>EOG</strong>'s principal executive officer.<br />
Loren M. Leiker was elected Senior Executive Vice President, Exploration in February 2007. He was elected<br />
Executive Vice President, Exploration in May 1998 and was subsequently named Executive Vice President, Exploration<br />
and Development in January 2000. He was previously Senior Vice President, Exploration. Mr. Leiker joined <strong>EOG</strong> in<br />
April 1989.<br />
Gary L. Thomas was elected Senior Executive Vice President, Operations in February 2007. He was<br />
elected Executive Vice President, North America Operations in May 1998 and was subsequently named Executive<br />
Vice President, Operations in May 2002. He was previously Senior Vice President and General Manager of <strong>EOG</strong>'s<br />
Midland, Texas office. Mr. Thomas joined a predecessor of <strong>EOG</strong> in July 1978.<br />
Robert K. Garrison was elected Executive Vice President, Exploration in February 2007. He was elected<br />
Senior Vice President and General Manager of <strong>EOG</strong>'s Corpus Christi, Texas office in August 2004 and, prior to such<br />
election, was Vice President and General Manger of <strong>EOG</strong>'s Corpus Christi, Texas office. Mr. Garrison joined <strong>EOG</strong><br />
in April 1995.<br />
Frederick J. Plaeger, II joined <strong>EOG</strong> as Senior Vice President and General Counsel in April 2007. He<br />
served as Vice President and General Counsel of Burlington <strong>Resources</strong> <strong>Inc</strong>., an independent oil and natural gas<br />
exploration and production company, from June 1998 until its acquisition by ConocoPhillips in March 2006. Mr.<br />
Plaeger engaged exclusively in leadership roles in professional legal associations from April 2006 until April 2007.<br />
Timothy K. Driggers was elected Vice President and Chief Financial Officer in July 2007. He was elected<br />
Vice President and Controller of <strong>EOG</strong> in October 1999 and was subsequently named Vice President, Accounting and<br />
Land Administration in October 2000 and Vice President and Chief Accounting Officer in August 2003. Mr.<br />
Driggers is <strong>EOG</strong>'s principal financial and accounting officer. Mr. Driggers joined <strong>EOG</strong> in October 1999.<br />
13
ITEM 1A. Risk Factors<br />
Our business and operations are subject to many risks. The risks described below may not be the only risks<br />
we face, as our business and operations may also be subject to risks that we do not yet know of, or that we currently<br />
believe are immaterial. If any of the events or circumstances described below actually occurs, our business, financial<br />
condition, results of operations or cash flow could be materially and adversely affected and the trading price of our<br />
common stock could decline. The following risk factors should be read in conjunction with the other information<br />
contained in this report, including the consolidated financial statements and the related notes.<br />
A substantial or extended decline in natural gas or crude oil prices would have a material and adverse effect on us.<br />
Prices for natural gas and crude oil fluctuate widely. Since we are primarily a natural gas company, we are<br />
more significantly affected by changes in natural gas prices than changes in the prices for crude oil and condensate or<br />
natural gas liquids. Among the factors that can cause these price fluctuations are:<br />
the level of consumer demand;<br />
supplies of natural gas and crude oil;<br />
weather conditions and changes in weather patterns;<br />
domestic and international drilling activity;<br />
the price and availability of, and demand for, competing energy sources, including liquefied natural gas, and<br />
alternative energy sources;<br />
the availability, proximity and capacity of transportation facilities;<br />
worldwide economic and political conditions;<br />
the level and effect of trading in commodity futures markets, including trading by commodity price<br />
speculators and others;<br />
the effect of worldwide energy conservation measures; and<br />
the nature and extent of governmental regulation and taxation, including environmental regulations.<br />
Our cash flow and results of operations depend to a great extent on the prevailing prices for natural gas and<br />
crude oil. Prolonged or substantial declines in natural gas and/or crude oil prices may materially and adversely affect<br />
our liquidity, the amount of cash flow we have available for our capital expenditures and other operating expenses,<br />
our ability to access the credit and capital markets and our results of operations.<br />
In addition, if we expect significant sustained decreases in natural gas and crude oil prices in the future such<br />
that the future cash flow from our natural gas and crude oil properties falls below the net book value of our<br />
properties, we may be required to write down the value of our natural gas and crude oil properties. Any such future<br />
asset impairments could materially and adversely affect our results of operations and, in turn, the trading price of our<br />
common stock.<br />
Drilling natural gas and crude oil wells is a high-risk activity and subjects us to a variety of risks that we cannot<br />
control.<br />
Drilling natural gas and crude oil wells, including development wells, involves numerous risks, including<br />
the risk that we may not encounter commercially productive natural gas and crude oil reservoirs. As a result, we may<br />
not recover all or any portion of our investment in new wells.<br />
Specifically, we often are uncertain as to the future cost or timing of drilling, completing and operating<br />
wells, and our drilling operations and those of our third-party operators may be curtailed, delayed or canceled, the<br />
cost of such operations may increase and/or our results of operations and cash flows from such operations may be<br />
impacted, as a result of a variety of factors, including:<br />
unexpected drilling conditions;<br />
title problems;<br />
pressure or irregularities in formations;<br />
equipment failures or accidents;<br />
adverse weather conditions and changes in weather patterns;<br />
compliance with, or changes in, environmental and other laws and regulations, such as tax laws and<br />
regulations;<br />
14
the availability and timely issuance of required governmental permits and licenses;<br />
the availability of, costs associated with and terms of contractual arrangements for properties, including<br />
leases, pipelines and related facilities and equipment to gather, process, compress, transport and market<br />
natural gas, crude oil and related commodities;<br />
costs of, or shortages or delays in the availability of, drilling rigs, tubular materials and other necessary<br />
equipment; and<br />
lack of necessary services and/or qualified personnel.<br />
Our failure to recover our investment in wells, increases in the costs of our drilling operations or those of<br />
our third-party operators and/or curtailments, delays or cancellations of our drilling operations or those of our thirdparty<br />
operators may materially and adversely affect our business, financial condition and results of operations.<br />
Our ability to sell and deliver our natural gas and crude oil production could be materially and adversely affected if<br />
we fail to obtain adequate gathering, processing, compression and transportation services.<br />
The sale of our natural gas and crude oil production depends on a number of factors beyond our control,<br />
including the availability, proximity and capacity of, and costs associated with, gathering, processing, compression<br />
and transportation facilities owned by third parties. These facilities may be temporarily unavailable to us due to<br />
market conditions, mechanical reasons or other factors or conditions, and may not be available to us in the future on<br />
terms we consider acceptable, if at all. Any significant change in market or other conditions affecting these facilities<br />
or the availability of these facilities, including due to our failure or inability to obtain access to these facilities on<br />
terms acceptable to us or at all, could materially and adversely affect our business and, in turn, our financial<br />
condition and results of operations.<br />
If we fail to acquire or find sufficient additional reserves over time, our reserves and production will decline from<br />
their current levels.<br />
The rate of production from natural gas and crude oil properties generally declines as reserves are<br />
produced. Except to the extent that we conduct successful exploration, exploitation and development activities,<br />
acquire additional properties containing reserves or, through engineering studies, identify additional behind-pipe<br />
zones or secondary recovery reserves, our reserves will decline as they are produced. Maintaining our production of<br />
natural gas and crude oil at, or increasing our production from, current levels, is, therefore, highly dependent upon<br />
our level of success in acquiring or finding additional reserves, as is, in turn, our future cash flow and results of<br />
operations.<br />
We incur certain costs to comply with government regulations, particularly regulations relating to environmental<br />
protection and safety, and could incur even greater costs in the future.<br />
Our exploration, production and marketing operations are regulated extensively at the federal, state and<br />
local levels, as well as by the governments and regulatory agencies in the foreign countries in which we do business,<br />
and are subject to interruption or termination by governmental and regulatory authorities based on environmental or<br />
other considerations. Moreover, we have incurred and will continue to incur costs in our efforts to comply with the<br />
requirements of environmental, safety and other regulations. Further, the regulatory environment in the oil and gas<br />
industry could change in ways that we cannot predict and that might substantially increase our costs of compliance<br />
and, in turn, materially and adversely affect our business, results of operations, financial condition and competitive<br />
position.<br />
Specifically, as an owner or lessee and operator of natural gas and crude oil properties, we are subject to<br />
various federal, state, local and foreign regulations relating to the discharge of materials into, and the protection of,<br />
the environment. These regulations may, among other things, impose liability on us for the cost of pollution cleanup<br />
resulting from operations, subject us to liability for pollution damages and require suspension or cessation of<br />
operations in affected areas. Moreover, we are subject to the United States Environmental Protection Agency's (U.S.<br />
EPA) rule requiring annual reporting of greenhouse gas (GHG) emissions. Changes in, or additions to, these<br />
regulations could materially and adversely affect our business, results of operations, financial condition and<br />
competitive position.<br />
We are aware of the increasing focus of local, state, national and international regulatory bodies on GHG<br />
emissions and climate change issues. In addition to the U.S. EPA's rule requiring annual reporting of GHG<br />
emissions, we are also aware of legislation proposed by United States (U.S.) lawmakers and by the Canadian<br />
15
legislature to reduce GHG emissions. We will continue to monitor and assess any new policies, legislation or<br />
regulations in the areas where we operate to determine the impact on our operations and take appropriate actions,<br />
where necessary. We are unable to predict the timing, scope and effect of any such proposed laws, regulations and<br />
treaties, but the direct and indirect costs of such laws, regulations and treaties (if enacted) could materially and adversely<br />
affect our business, results of operations, financial condition and competitive position.<br />
A portion of our natural gas and crude oil production may be subject to interruptions that could have a material and<br />
adverse effect on us.<br />
A portion of our natural gas and crude oil production may be interrupted, or shut in, from time to time for<br />
various reasons, including as a result of accidents, weather conditions, loss of gathering, processing, compression or<br />
transportation facility access or field labor issues, or intentionally as a result of market conditions such as natural gas or<br />
crude oil prices that we deem uneconomic. If a substantial amount of our production is interrupted, our cash flow and, in<br />
turn, our results of operations could be materially and adversely affected.<br />
We operate in other countries and, as a result, are subject to certain political, economic and other risks.<br />
Our operations in jurisdictions outside the U.S. are subject to various risks inherent in foreign operations.<br />
These risks may include, among other risks:<br />
loss of revenue, equipment and property as a result of expropriation, acts of terrorism, war, civil unrest and<br />
other political risks;<br />
increases in taxes and governmental royalties;<br />
unilateral or forced renegotiation, modification or nullification of existing contracts with governmental entities;<br />
difficulties enforcing our rights against a governmental agency because of the doctrine of sovereign immunity<br />
and foreign sovereignty over international operations;<br />
changes in laws and policies governing operations of foreign-based companies; and<br />
currency restrictions and exchange rate fluctuations.<br />
Our international operations may also be adversely affected by U.S. laws and policies affecting foreign trade<br />
and taxation. The realization of any of these factors could materially and adversely affect our business, financial<br />
condition and results of operations.<br />
We have limited control over the activities on properties we do not operate.<br />
Some of the properties in which we have an interest are operated by other companies and involve third-party<br />
working interest owners. As a result, we have limited ability to influence or control the operation or future development<br />
of such properties, including compliance with environmental, safety and other regulations, or the amount of capital<br />
expenditures that we will be required to fund with respect to such properties. Moreover, we are dependent on the other<br />
working interest owners of such projects to fund their contractual share of the capital expenditures of such projects.<br />
These limitations and our dependence on the operator and other working interest owners for these projects could cause<br />
us to incur unexpected future costs and materially and adversely affect our financial condition and results of operations.<br />
If we acquire natural gas and crude oil properties, our failure to fully identify existing and potential problems, to<br />
accurately estimate reserves, production rates or costs, or to effectively integrate the acquired properties into our<br />
operations could materially and adversely affect our business, financial condition and results of operations.<br />
From time to time, we seek to acquire natural gas and crude oil properties. Although we perform reviews of<br />
properties to be acquired in a manner that we believe is consistent with industry practices, reviews of records and<br />
properties may not necessarily reveal existing or potential problems, nor may they permit a buyer to become<br />
sufficiently familiar with the properties in order to assess fully their deficiencies and potential. Even when problems<br />
with a property are identified, we often may assume environmental and other risks and liabilities in connection with<br />
acquired properties pursuant to the acquisition agreements. Moreover, there are numerous uncertainties inherent in<br />
estimating quantities of natural gas and crude oil reserves, actual future production rates and associated costs with<br />
respect to acquired properties. Actual reserves, production rates and costs may vary substantially from those<br />
assumed in our estimates. In addition, an acquisition may have a material and adverse effect on our business and<br />
results of operations, particularly during the periods in which the operations of the acquired properties are being<br />
16
integrated into our ongoing operations or if we are unable to effectively integrate the acquired properties into our<br />
ongoing operations.<br />
Weather and climate may have a significant and adverse impact on us.<br />
Demand for natural gas and crude oil is, to a significant degree, dependent on weather and climate, which<br />
impacts, among other things, the price we receive for the commodities we produce and, in turn, our cash flow and<br />
results of operations. For example, relatively warm temperatures during a winter season generally result in relatively<br />
lower demand for natural gas (as less natural gas is used to heat residences and businesses) and, as a result, relatively<br />
lower prices for natural gas production.<br />
In addition, our exploration, exploitation and development activities and equipment can be adversely<br />
affected by extreme weather conditions and changes in weather patterns, such as hurricanes in the Gulf of Mexico<br />
and increases in storm intensity, which may cause a loss of production from temporary cessation of activity or lost or<br />
damaged facilities and equipment. Such extreme weather conditions and changes in weather patterns could also<br />
impact other areas of our operations, including access to our drilling and production facilities for routine operations,<br />
maintenance and repairs, the installation and operation of gathering and production facilities and the availability of,<br />
and our access to, necessary third-party services, such as gathering, processing, compression and transportation<br />
services. Such extreme weather conditions and changes in weather patterns may materially and adversely affect our<br />
business and, in turn, our financial condition and results of operations.<br />
We have substantial capital requirements, and we may be unable to obtain needed financing on satisfactory terms, if<br />
at all.<br />
We make, and will continue to make, substantial capital expenditures for the acquisition, development,<br />
production, exploration and abandonment of natural gas and crude oil reserves. We intend to finance our capital<br />
expenditures primarily through our cash flow from operations, commercial paper borrowings and borrowings under<br />
other uncommitted credit facilities and, to a lesser extent and if and as necessary, bank borrowings, borrowings under<br />
our revolving credit facilities and public and private equity and debt offerings.<br />
Lower natural gas and crude oil prices, however, would reduce our cash flow. Further, if the condition of<br />
the credit and capital markets materially declines, we might not be able to obtain financing on terms we consider<br />
acceptable, if at all. The weakness and volatility in domestic and global financial markets and economic conditions<br />
in recent years may increase the interest rates that lenders and commercial paper investors require us to pay and<br />
adversely affect our ability to finance our capital expenditures through equity or debt offerings or other borrowings.<br />
Moreover, a reduction in our cash flow (for example, as a result of lower natural gas and crude oil prices) and the<br />
corresponding adverse effect on our financial condition and results of operations may increase the interest rates that<br />
lenders and commercial paper investors require us to pay. In addition, a substantial rise in interest rates would<br />
decrease our net cash flows available for reinvestment. Any of these factors could have a material and adverse effect<br />
on our business, financial condition and results of operations.<br />
The inability of our customers and other contractual counterparties to satisfy their obligations to us may have a<br />
material and adverse effect on us.<br />
We have various customers for the natural gas, crude oil and related commodities that we produce as well as<br />
various other contractual counterparties, including several financial institutions and affiliates of financial institutions.<br />
Domestic and global economic conditions, including the financial condition of financial institutions generally, have<br />
weakened in recent years and remain weak. In addition, there continues to be weakness and volatility in domestic and<br />
global financial markets, including the credit crisis and corresponding reaction by lenders to risk. These conditions and<br />
factors may adversely affect the ability of our customers and other contractual counterparties to pay amounts owed to us<br />
from time to time and to otherwise satisfy their contractual obligations to us, as well as their ability to access the credit<br />
and capital markets for such purposes.<br />
Moreover, our customers and other contractual counterparties may be unable to satisfy their contractual<br />
obligations to us for reasons unrelated to these conditions and factors, such as the unavailability of required facilities or<br />
equipment due to mechanical failure or market conditions. Furthermore, if a customer is unable to satisfy its contractual<br />
obligation to purchase natural gas, crude oil or related commodities from us, we may be unable to sell such production to<br />
17
another customer on terms we consider acceptable, if at all, due to the geographic location of such production, the<br />
availability, proximity or capacity of transportation facilities or market or other factors and conditions.<br />
The inability of our customers and other contractual counterparties to pay amounts owed to us and to otherwise<br />
satisfy their contractual obligations to us may materially and adversely affect our business, financial condition, results of<br />
operations and cash flow.<br />
Competition in the oil and gas exploration and production industry is intense, and many of our competitors have<br />
greater resources than we have.<br />
We compete with major integrated oil and gas companies and other independent oil and gas companies for<br />
the acquisition of licenses and leases, properties and reserves and the equipment, materials, services and employees<br />
and other personnel (including geologists, geophysicists, engineers and other specialists) required to explore for,<br />
develop, produce and market natural gas and crude oil. In addition, many of our competitors have financial and<br />
other resources substantially greater than those we possess and have established strategic long-term positions and<br />
strong governmental relationships in countries in which we may seek new or expanded entry. As a consequence, we<br />
may be at a competitive disadvantage in certain respects, such as in bidding for drilling rights. In addition, many of<br />
our larger competitors may have a competitive advantage when responding to factors that affect demand for natural<br />
gas and crude oil, such as changing worldwide prices and levels of production and the cost and availability of<br />
alternative fuels. We also face competition from competing energy sources, such as liquefied natural gas imported<br />
into the U.S. from other countries and, to a lesser extent, alternative energy sources.<br />
Reserve estimates depend on many interpretations and assumptions that may turn out to be inaccurate. Any<br />
significant inaccuracies in these interpretations and assumptions could cause the reported quantities of our reserves<br />
to be materially misstated.<br />
Estimating quantities of natural gas and liquids reserves and future net cash flows from such reserves is a<br />
complex, inexact process. It requires interpretations of available technical data and various assumptions, including<br />
assumptions relating to economic factors, made by our management and our independent petroleum consultants.<br />
Any significant inaccuracies in these interpretations or assumptions could cause the reported quantities of our<br />
reserves and future net cash flows from such reserves to be overstated or understated. Moreover, the data for a given<br />
reservoir may also change substantially over time as a result of numerous factors including, but not limited to,<br />
additional development activity, evolving production history and continual reassessment of the viability of<br />
production under varying economic conditions.<br />
To prepare estimates of our economically recoverable natural gas and liquids reserves and future net cash<br />
flows from our reserves, we analyze many variable factors, such as historical production from the area compared<br />
with production rates from other producing areas. We also analyze available geological, geophysical, production<br />
and engineering data, and the extent, quality and reliability of this data can vary. The process also involves<br />
economic assumptions relating to commodity prices, production costs, severance and excise taxes, capital<br />
expenditures and workover and remedial costs, many of which factors are or may be beyond our control. Our actual<br />
reserves and future net cash flows from such reserves most likely will vary from our estimates. Any significant<br />
variance, including any significant revisions to our existing reserve estimates, could materially and adversely affect<br />
our business, financial condition and results of operations and, in turn, the trading price of our common stock.<br />
Our hedging activities may prevent us from benefiting fully from increases in natural gas and crude oil prices and<br />
may expose us to other risks, including counterparty risk.<br />
We use derivative instruments (primarily financial collars, price swaps and basis swaps) to hedge the impact<br />
of fluctuations in natural gas and crude oil prices on our results of operations and cash flow. To the extent that we<br />
engage in hedging activities to protect ourselves against commodity price declines, we may be prevented from fully<br />
realizing the benefits of increases in natural gas and crude oil prices above the prices established by our hedging<br />
contracts. In addition, our hedging activities may expose us to the risk of financial loss in certain circumstances,<br />
including instances in which the counterparties to our hedging contracts fail to perform under the contracts.<br />
18
We do not insure against all potential losses and could be materially and adversely affected by unexpected<br />
liabilities.<br />
The exploration for, and production of, natural gas and crude oil can be hazardous, involving natural<br />
disasters and other unforeseen occurrences such as blowouts, cratering, fires and loss of well control, which can<br />
damage or destroy wells or production facilities, result in injury or death, and damage property and the environment.<br />
Moreover, our onshore and offshore operations are subject to customary perils, including hurricanes and other<br />
adverse weather conditions. We maintain insurance against many, but not all, potential losses or liabilities arising<br />
from our operations in accordance with what we believe are customary industry practices and in amounts and at costs<br />
that we believe to be prudent and commercially practicable. The occurrence of any of these events and any costs or<br />
liabilities incurred as a result of such events would reduce the funds available to us for our exploration, development<br />
and production activities and could, in turn, have a material adverse effect on our business, financial condition and<br />
results of operations.<br />
Our business and prospects for future success depend to a significant extent upon the continued service and<br />
performance of our management team.<br />
Our business and prospects for future success, including the successful implementation of our strategies and<br />
handling of issues integral to our future success, depend to a significant extent upon the continued service and<br />
performance of our management team. The loss of any member of our management team, and our inability to attract,<br />
motivate and retain substitute management personnel with comparable experience and skills, could materially and<br />
adversely affect our business, financial condition and results of operations.<br />
Unfavorable currency exchange rate fluctuations could adversely affect our results of operations.<br />
The reporting currency for our financial statements is the U.S. dollar. However, certain of our subsidiaries<br />
are located in countries other than the U.S. and have functional currencies other than the U.S. dollar. The assets,<br />
liabilities, revenues and expenses of certain of these foreign subsidiaries are denominated in currencies other than the<br />
U.S. dollar. To prepare our consolidated financial statements, we must translate those assets, liabilities, revenues<br />
and expenses into U.S. dollars at then-applicable exchange rates. Consequently, increases and decreases in the value<br />
of the U.S. dollar versus other currencies will affect the amount of these items in our consolidated financial<br />
statements, even if the amount has not changed in the original currency. These translations could result in changes to<br />
our results of operations from period to period. For the fiscal year ended December 31, <strong>2009</strong>, approximately 9% of<br />
our revenues related to operations of our foreign subsidiaries whose functional currency was not the U.S. dollar.<br />
Terrorist activities and military and other actions could materially and adversely affect us.<br />
Terrorist attacks and the threat of terrorist attacks, whether domestic or foreign, as well as military or other<br />
actions taken in response to these acts, could cause instability in the global financial and energy markets. The U.S.<br />
government has at times issued public warnings that indicate that energy assets might be specific targets of terrorist<br />
organizations. Any such actions and the threat of such actions could materially and adversely affect us in<br />
unpredictable ways, including the disruption of energy supplies and markets, increased volatility in natural gas and<br />
crude oil prices or the possibility that the infrastructure on which we rely could be a direct target or an indirect<br />
casualty of an act of terrorism, and, in turn, could materially and adversely affect our business, financial condition<br />
and results of operations.<br />
ITEM 1B. Unresolved Staff Comments<br />
None.<br />
ITEM 2. Properties<br />
Oil and Gas Exploration and Production - Properties and Reserves<br />
Reserve Information. For estimates of <strong>EOG</strong>'s net proved and proved developed reserves of natural gas and<br />
liquids, including crude oil and condensate and natural gas liquids, as well as discussion of <strong>EOG</strong>'s proved undeveloped<br />
reserves, the qualifications of the preparers of <strong>EOG</strong>'s reserve estimates, <strong>EOG</strong>'s independent petroleum consultants<br />
and <strong>EOG</strong>'s processes and controls with respect to its reserve estimates, see "Supplemental Information to<br />
Consolidated Financial Statements."<br />
19
There are numerous uncertainties inherent in estimating quantities of proved reserves and in projecting future<br />
rates of production and timing of development expenditures, including many factors beyond the control of the producer.<br />
The reserve data set forth in Supplemental Information to Consolidated Financial Statements represent only estimates.<br />
Reserve engineering is a subjective process of estimating underground accumulations of natural gas, crude oil and<br />
condensate and natural gas liquids that cannot be measured in an exact manner. The accuracy of any reserve estimate is<br />
a function of the amount and quality of available data and of engineering and geological interpretation and judgment.<br />
As a result, estimates of different engineers normally vary. In addition, results of drilling, testing and production<br />
subsequent to the date of an estimate may justify revision of such estimate (upward or downward). Accordingly, reserve<br />
estimates are often different from the quantities ultimately recovered. The meaningfulness of such estimates is highly<br />
dependent upon the accuracy of the assumptions upon which they were based. For related discussion, see ITEM 1A.<br />
Risk Factors.<br />
In general, the rate of production from <strong>EOG</strong>'s natural gas and crude oil properties declines as reserves are<br />
produced. Except to the extent <strong>EOG</strong> acquires additional properties containing proved reserves, conducts successful<br />
exploration, exploitation and development activities or, through engineering studies, identifies additional behind-pipe<br />
zones or secondary recovery reserves, the proved reserves of <strong>EOG</strong> will decline as reserves are produced. Volumes<br />
generated from future activities of <strong>EOG</strong> are therefore highly dependent upon the level of success in finding or acquiring<br />
additional reserves. For related discussion, see ITEM 1A. Risk Factors. <strong>EOG</strong>'s estimates of reserves filed with other<br />
federal agencies agree with the information set forth in Supplemental Information to Consolidated Financial Statements.<br />
Acreage. The following table summarizes <strong>EOG</strong>'s developed and undeveloped acreage at December 31, <strong>2009</strong>.<br />
Excluded is acreage in which <strong>EOG</strong>'s interest is limited to owned royalty, overriding royalty and other similar interests.<br />
Developed Undeveloped Total<br />
Gross Net Gross Net Gross Net<br />
United States 1,724,004 1,245,914 5,908,475 4,185,139 7,632,479 5,431,053<br />
Canada 1,961,930 1,670,948 1,736,290 1,660,279 3,698,220 3,331,227<br />
Trinidad 72,901 64,286 165,427 155,723 238,328 220,009<br />
United Kingdom 10,230 2,946 472,950 276,583 483,180 279,529<br />
China 130,546 130,546 - - 130,546 130,546<br />
Total 3,899,611 3,114,640 8,283,142 6,277,724 12,182,753 9,392,364<br />
Producing Well Summary. The following table reflects <strong>EOG</strong>'s ownership in producing natural gas and crude<br />
oil wells located in the United States, Canada, Trinidad, the United Kingdom and China at December 31, <strong>2009</strong>. Gross<br />
natural gas and crude oil wells include 2,399 wells with multiple completions.<br />
Productive Wells<br />
Gross<br />
Net<br />
Natural Gas 21,495 18,244<br />
Crude Oil 2,260 1,574<br />
Total 23,755 19,818<br />
20
Drilling and Acquisition Activities. During the years ended December 31, <strong>2009</strong>, 2008 and 2007, <strong>EOG</strong><br />
expended $3.9 billion, $5.1 billion and $3.6 billion, respectively, for exploratory and development drilling and<br />
acquisition of leases and producing properties, including asset retirement obligations of $84 million, $181 million<br />
and $31 million, respectively. <strong>EOG</strong> drilled, participated in the drilling of or acquired wells as set out in the table<br />
below for the periods indicated:<br />
<strong>2009</strong> 2008 2007<br />
Gross Net Gross Net Gross Net<br />
Development Wells Completed<br />
United States and Canada<br />
Gas 467 399 1,498 1,261 1,747 1,441<br />
Oil 233 181 223 171 98 86<br />
Dry 26 22 50 47 59 52<br />
Total 726 602 1,771 1,479 1,904 1,579<br />
Outside United States and Canada<br />
Gas - - - - 6 5<br />
Oil - - - - - -<br />
Dry - - - - - -<br />
Total - - - - 6 5<br />
Total Development 726 602 1,771 1,479 1,910 1,584<br />
Exploratory Wells Completed<br />
United States and Canada<br />
Gas 23 17 44 38 62 54<br />
Oil 25 17 37 19 14 12<br />
Dry 7 6 9 9 18 16<br />
Total 55 40 90 66 94 82<br />
Outside United States and Canada<br />
Gas - - - - - -<br />
Oil 1 1 - - - -<br />
Dry 1 1 - - 2 1<br />
Total 2 2 - - 2 1<br />
Total Exploratory 57 42 90 66 96 83<br />
Total 783 644 1,861 1,545 2,006 1,667<br />
Wells in Progress at end of period 288 248 223 191 223 195<br />
Total 1,071 892 2,084 1,736 2,229 1,862<br />
Wells Acquired (1)<br />
Gas 581 244 102 94 41 15<br />
Oil 133 126 9 7 - -<br />
Total 714 370 111 101 41 15<br />
(1) <strong>Inc</strong>ludes the acquisition of additional interests in certain wells in which <strong>EOG</strong> previously owned an interest.<br />
All of <strong>EOG</strong>'s drilling activities are conducted on a contractual basis with independent drilling contractors.<br />
<strong>EOG</strong> does not own drilling equipment. <strong>EOG</strong>'s other property, plant and equipment primarily includes gathering and<br />
processing infrastructure assets which support <strong>EOG</strong>'s exploration and production activities.<br />
21
ITEM 3. Legal Proceedings<br />
The information required by this Item is set forth under the "Contingencies" caption in Note 7 of Notes to<br />
Consolidated Financial Statements and is incorporated by reference herein.<br />
ITEM 4. Submission of Matters to a Vote of Security Holders<br />
There were no matters submitted to a vote of security holders during the fourth quarter of <strong>2009</strong>.<br />
PART II<br />
ITEM 5. Market for Registrant's Common Equity, Related Stockholder Matters and Issuer Purchases of Equity<br />
Securities<br />
<strong>EOG</strong>'s common stock is traded on the New York Stock Exchange (NYSE) under the ticker symbol "<strong>EOG</strong>."<br />
The following table sets forth, for the periods indicated, the high and low sales price per share for <strong>EOG</strong>'s common<br />
stock, as reported by the NYSE, and the amount of the cash dividend declared per share. The quarterly cash<br />
dividend on <strong>EOG</strong>'s common stock has historically been declared in the quarter immediately preceding the quarter of<br />
payment and paid on January 31, April 30, July 31 and October 31 of each year (or, if such day is not a business day,<br />
the immediately preceding business day).<br />
Price Range<br />
High Low Dividend Declared<br />
<strong>2009</strong><br />
2008<br />
First Quarter $ 72.83 $ 45.03 $ 0.145<br />
Second Quarter 79.12 53.09 0.145<br />
Third Quarter 84.43 60.29 0.145<br />
Fourth Quarter 101.76 79.37 0.145<br />
First Quarter $ 129.90 $ 77.18 $ 0.120<br />
Second Quarter 144.99 117.76 0.120<br />
Third Quarter 133.89 79.80 0.135<br />
Fourth Quarter 90.80 54.42 0.135<br />
On February 9, 2010, <strong>EOG</strong>'s Board of Directors (Board) increased the quarterly cash dividend on the<br />
common stock from the current $0.145 per share to $0.155 per share effective beginning with the dividend to be paid<br />
on April 30, 2010.<br />
As of February 15, 2010, there were approximately 1,700 record holders and approximately 210,000<br />
beneficial owners of <strong>EOG</strong>'s common stock.<br />
<strong>EOG</strong> currently intends to continue to pay quarterly cash dividends on its outstanding shares of common<br />
stock in the future. However, the determination of the amount of future cash dividends, if any, to be declared and<br />
paid will depend upon, among other factors, the financial condition, cash flow, level of exploration and development<br />
expenditure opportunities and future business prospects of <strong>EOG</strong>.<br />
22
The following table sets forth, for the periods indicated, <strong>EOG</strong>'s share repurchase activity:<br />
Period<br />
(a)<br />
Total<br />
Number of<br />
Shares<br />
Purchased (1)<br />
(b)<br />
Average<br />
Price Paid<br />
per Share<br />
(c)<br />
Total Number of<br />
Shares Purchased as<br />
Part of Publicly<br />
Announced Plans or<br />
Programs<br />
(d)<br />
Maximum Number<br />
of Shares that May Yet<br />
Be Purchased Under<br />
the Plans or Programs (2)<br />
October 1, <strong>2009</strong> - October 31, <strong>2009</strong> 3,752 $89.49 - 6,386,200<br />
November 1, <strong>2009</strong> - November 30, <strong>2009</strong> 4,403 88.51 - 6,386,200<br />
December 1, <strong>2009</strong> - December 31, <strong>2009</strong> 3,960 93.89 - 6,386,200<br />
Total 12,115 90.57<br />
(1) The 12,115 total shares for the quarter ended December 31, <strong>2009</strong> and the 167,867 shares for the full year <strong>2009</strong> consist solely<br />
of shares that were withheld by or returned to <strong>EOG</strong> (i) in satisfaction of tax withholding obligations that arose upon the<br />
exercise of employee stock options or stock-settled stock appreciation rights or the vesting of restricted stock or restricted<br />
stock unit grants or (ii) in payment of the exercise price of employee stock options. These shares do not count against the 10<br />
million aggregate share repurchase authorization of <strong>EOG</strong>'s Board discussed below.<br />
(2) In September 2001, the Board authorized the repurchase of up to 10,000,000 shares of <strong>EOG</strong>'s common stock. During <strong>2009</strong>,<br />
<strong>EOG</strong> did not repurchase any shares under the Board-authorized repurchase program.<br />
23
Comparative Stock Performance<br />
The following performance graph and related information shall not be deemed "soliciting material" or to be<br />
"filed" with the Securities and Exchange Commission, nor shall such information be incorporated by reference into any<br />
future filing under the Securities Act of 1933, as amended, or Securities Exchange Act of 1934, as amended, except to<br />
the extent that <strong>EOG</strong> specifically requests that such information be treated as "soliciting material" or specifically<br />
incorporates such information by reference into such a filing.<br />
The performance graph shown below compares the cumulative five-year total return to stockholders on <strong>EOG</strong>'s<br />
common stock as compared to the cumulative five-year total returns on the Standard and Poor's 500 Index (S&P 500)<br />
and the Standard and Poor's 500 Oil & Gas Exploration & Production Index (S&P O&G E&P). The comparison was<br />
prepared based upon the following assumptions:<br />
1. $100 was invested on December 31, 2004 in each of the following: Common Stock of <strong>EOG</strong>, the S&P 500 and the<br />
S&P O&G E&P.<br />
2. Dividends are reinvested.<br />
Comparison of Five-Year Cumulative Total Returns*<br />
<strong>EOG</strong>, S&P 500 and S&P O&G E&P<br />
(Performance Results Through December 31, <strong>2009</strong>)<br />
$300.00<br />
<strong>EOG</strong><br />
S&P 500<br />
S&P O&G E&P<br />
$252.80<br />
$251.50<br />
$279.34<br />
$233.86<br />
$200.00<br />
$206.26<br />
$176.11<br />
$174.14<br />
$189.57<br />
$166.40 $164.58<br />
$100.00<br />
$100.00<br />
$103.00<br />
$117.03<br />
$121.16<br />
$74.53<br />
$92.01<br />
$0.00<br />
2004 2005 2006 2007 2008 <strong>2009</strong><br />
*Cumulative total return assumes reinvestment of dividends.<br />
2004 2005 2006 2007 2008 <strong>2009</strong><br />
<strong>EOG</strong> $100.00 $206.26 $176.11 $252.80 $189.57 $279.34<br />
S&P 500 $100.00 $103.00 $117.03 $121.16 $ 74.53 $ 92.01<br />
S&P O&G E&P $100.00 $166.40 $174.14 $251.50 $164.58 $233.86<br />
24
ITEM 6. Selected Financial Data<br />
(In Thousands, Except Per Share Data)<br />
Year Ended December 31 <strong>2009</strong> 2008 2007 2006 2005<br />
Statement of <strong>Inc</strong>ome Data:<br />
Net Operating Revenues $ 4,786,959 $ 7,127,143 $ 4,239,303 $ 3,928,641 $ 3,671,243<br />
Operating <strong>Inc</strong>ome $ 970,841 $ 3,767,185 $ 1,648,396 $ 1,903,553 $ 2,004,631<br />
Net <strong>Inc</strong>ome $ 546,627 $ 2,436,919 $ 1,089,918 $ 1,299,885 $ 1,259,576<br />
Preferred Stock Dividends - 443 6,663 10,995 7,432<br />
Net <strong>Inc</strong>ome Available to Common Stockholders $ 546,627 $ 2,436,476 $ 1,083,255 $ 1,288,890 $ 1,252,144<br />
Net <strong>Inc</strong>ome Per Share Available to Common<br />
Stockholders<br />
Basic $ 2.20 $ 9.88 $ 4.45 $ 5.33 $ 5.24<br />
Diluted $ 2.17 $ 9.72 $ 4.37 $ 5.24 $ 5.13<br />
Dividends Per Common Share $ 0.58 $ 0.51 $ 0.36 $ 0.24 $ 0.16<br />
Average Number of Common Shares<br />
Basic 248,996 246,662 243,469 241,782 238,797<br />
Diluted 251,884 250,542 247,637 246,100 243,975<br />
At December 31 <strong>2009</strong> 2008 2007 2006 2005<br />
Balance Sheet Data:<br />
Total Property, Plant and Equipment, Net $ 16,139,225 $ 13,657,302 $ 10,429,254 $ 7,944,047 $ 6,087,179<br />
Total Assets 18,118,667 15,951,226 12,088,907 9,402,160 7,753,320<br />
Long-Term Debt and Current Portion of<br />
Long-Term Debt 2,797,000 1,897,000 1,185,000 733,442 985,067<br />
Total Stockholders' Equity 9,998,042 9,014,497 6,990,094 5,599,671 4,316,292<br />
25
ITEM 7. Management's Discussion and Analysis of Financial Condition and Results of Operations<br />
Overview<br />
<strong>EOG</strong> <strong>Resources</strong>, <strong>Inc</strong>., together with its subsidiaries (collectively, <strong>EOG</strong>), is one of the largest independent<br />
(non-integrated) oil and natural gas companies in the United States with proved reserves in the United States,<br />
Canada, Trinidad, the United Kingdom and China. <strong>EOG</strong> operates under a consistent business and operational<br />
strategy that focuses predominantly on maximizing the rate of return on investment of capital by controlling<br />
operating and capital costs. This strategy is intended to enhance the generation of cash flow and earnings from each<br />
unit of production on a cost-effective basis, allowing <strong>EOG</strong> to deliver long-term production growth while maintaining<br />
a strong balance sheet. <strong>EOG</strong> implements its strategy by emphasizing the drilling of internally generated prospects in<br />
order to find and develop low cost reserves. Maintaining the lowest possible operating cost structure that is<br />
consistent with prudent and safe operations is also an important goal in the implementation of <strong>EOG</strong>'s strategy.<br />
Net income available to common stockholders for <strong>2009</strong> totaled $547 million as compared to $2,436 million<br />
for 2008. At December 31, <strong>2009</strong>, <strong>EOG</strong>'s total estimated net proved reserves were 10.8 trillion cubic feet equivalent,<br />
an increase of 2,087 billion cubic feet equivalent (Bcfe) from December 31, 2008.<br />
Operations<br />
Several important developments have occurred since January 1, <strong>2009</strong>.<br />
United States and Canada. <strong>EOG</strong>'s effort to identify plays with larger reserve potential has proven a<br />
successful supplement to its base development and exploitation program in the United States and Canada. <strong>EOG</strong><br />
continues to drill numerous wells in large acreage plays, which in the aggregate are expected to contribute<br />
substantially to <strong>EOG</strong>'s natural gas and crude oil production. In Canada, <strong>EOG</strong> departed from its historical vertical<br />
shallow natural gas drilling program to focus on bigger target horizontal gas growth in the Horn River Basin and<br />
horizontal oil growth within existing legacy fields, mainly in Waskada, Manitoba and Highvale, Alberta. In addition,<br />
<strong>EOG</strong> continues to evaluate certain potential exploration and development prospects. Production in the United States<br />
and Canada accounted for approximately 86% of total company production in <strong>2009</strong> as compared to 87% in 2008. In<br />
<strong>2009</strong>, the Fort Worth Basin Barnett Shale and North Dakota Bakken areas produced an increasing amount of crude<br />
oil and condensate and natural gas liquids. For <strong>2009</strong>, crude oil and condensate and natural gas liquids production<br />
accounted for approximately 22% of total company production as compared to 19% for 2008. Based on current<br />
trends, <strong>EOG</strong> expects its 2010 crude oil and condensate and natural gas liquids production to increase both in total<br />
and as a percentage of total company production as compared to <strong>2009</strong>. <strong>EOG</strong>'s major producing areas are in<br />
Louisiana, New Mexico, North Dakota, Texas, Utah, Wyoming and western Canada.<br />
During the third quarter of <strong>2009</strong>, <strong>EOG</strong> completed three transactions to acquire certain crude oil and natural<br />
gas properties and related assets located in Montague and Cooke Counties, Texas (Barnett Shale Combo Assets).<br />
The Barnett Shale Combo Assets consist of proved developed and undeveloped reserves and approximately 33,000<br />
net unproved acres. Production from these assets averaged approximately 2,300 barrels of oil equivalent per day,<br />
net, at the time of acquisition. The aggregate purchase price of the transactions totaled $196.7 million, consisting of<br />
cash consideration of $107.1 million and 1,450,000 shares of <strong>EOG</strong> common stock valued at $89.6 million on the<br />
closing date of the applicable transaction.<br />
In October <strong>2009</strong>, <strong>EOG</strong> entered into an agreement to acquire unproved acreage located in Nacogdoches<br />
County, Texas within the Haynesville and Bossier Shale formations (Haynesville Assets). <strong>EOG</strong> acquired 39,500 net<br />
unproved acres at the principal and supplemental closings held in October <strong>2009</strong> and December <strong>2009</strong>, respectively.<br />
The acquisition agreement provides for an additional one-time supplemental cash payment to the sellers of the<br />
Haynesville Assets that is contingent on the satisfaction of certain conditions (within a five-year period beginning on<br />
the principal closing date) set forth in the acquisition agreement with respect to future natural gas prices. <strong>EOG</strong><br />
estimated the fair value of the contingent consideration as of the acquisition dates in accordance with the provisions<br />
of the Business Combinations Topic of the Accounting Standards Codification (ASC) and has included such amount<br />
in Other Liabilities on the Consolidated Balance Sheets. The fair value of such contingent consideration was $35.3<br />
million at December 31, <strong>2009</strong>. The aggregate consideration recorded in <strong>2009</strong> for the acquisition of the Haynesville<br />
Assets was $134 million, including the contingent consideration. Additionally, <strong>EOG</strong> expects to acquire up to an<br />
additional 7,500 net acres at a final closing expected to occur in the first quarter of 2010. The total price for the<br />
Haynesville Assets will not exceed $165 million.<br />
26
In November <strong>2009</strong>, <strong>EOG</strong> entered into an agreement to sell its crude oil and natural gas related assets<br />
located in California for cash consideration of $202 million, subject to customary adjustments under the agreement.<br />
The assets sold included approximately 80 wells that accounted for less than 1% of <strong>EOG</strong>'s total <strong>2009</strong> production.<br />
The transaction closed on December 10, <strong>2009</strong>. <strong>EOG</strong> realized a pretax gain of $146 million on the sale.<br />
In December <strong>2009</strong>, <strong>EOG</strong> and a third party entered into an asset exchange agreement whereby the two<br />
parties exchanged certain natural gas related properties in the Rocky Mountain area. In accordance with provisions<br />
of the Business Combinations Topic of the ASC, <strong>EOG</strong> realized a pretax gain of $390 million on the exchange to<br />
reflect the excess of the fair value of the properties received over the book basis of the properties given up in the<br />
transaction.<br />
In support of its operations in the North Dakota Bakken play, <strong>EOG</strong> constructed a crude oil loading facility<br />
near Stanley, North Dakota, designed to load crude oil into 100-car unit trains for transport to Stroud, Oklahoma. At<br />
Stroud, Oklahoma, <strong>EOG</strong> constructed a crude oil offloading facility and a pipeline to transport the crude oil to the<br />
Cushing, Oklahoma, trading hub. The first shipment of crude oil through these facilities occurred at year-end <strong>2009</strong>.<br />
When fully operational, the capacity of these facilities is expected to allow transport of approximately 60,000 barrels<br />
per day of Bakken crude oil.<br />
International. In Trinidad, <strong>EOG</strong> continued to deliver natural gas under existing supply contracts. In the<br />
Pelican Field, <strong>EOG</strong> drilled a successful exploratory well in late January 2010 that is expected to begin producing by<br />
the end of the first quarter of 2010.<br />
In the United Kingdom, <strong>EOG</strong> has ongoing production from the Valkyrie and Arthur fields in the Southern<br />
Gas Basin of the North Sea Block 23/16f. There is currently one producing well in the Arthur field, and such well is<br />
expected to cease production during the first half of 2010. The operator and partners of the non-<strong>EOG</strong> operated<br />
Columbus discovery in the Central North Sea are continuing to evaluate export routes for future production. In<br />
addition, the operator expects to submit a revised field development plan to the United Kingdom Department of<br />
Energy and Climate Change during the second quarter of 2010 and anticipates receiving approval in late 2010.<br />
During the third quarter of <strong>2009</strong>, <strong>EOG</strong> completed a farm-in agreement with the owners of the Central North<br />
Sea Block 15/30a Area AB. In December <strong>2009</strong>, <strong>EOG</strong> began drilling an exploratory well on this prospect. The well<br />
was declared a dry hole in January 2010.<br />
<strong>EOG</strong> continues to expand its exploration prospect portfolio in the United Kingdom. During the second<br />
quarter of <strong>2009</strong>, <strong>EOG</strong> drilled two exploratory wells in the East Irish Sea. Well 110/14b-7, in which <strong>EOG</strong> has a 70%<br />
working interest, was a dry hole while well 110/12-6, in which <strong>EOG</strong> has 100% working interest, was an oil<br />
discovery. Engineering studies were initiated with an intent to submit a field development plan to the United<br />
Kingdom Department of Energy and Climate Change during the first quarter of 2010. A rig has been contracted and<br />
has begun drilling two further exploratory wells offsetting the oil discovery. The first well was declared a dry hole in<br />
February 2010 and results for the second well are expected by the end of the first quarter of 2010.<br />
In July 2008, <strong>EOG</strong> acquired rights from ConocoPhillips in a Petroleum Contract covering the Chuanzhong<br />
Block exploration area in the Sichuan Basin, Sichuan Province, China. In October 2008, <strong>EOG</strong> obtained the rights to<br />
additional shallower zones on the acreage purchased. During the second quarter of <strong>2009</strong>, <strong>EOG</strong> completed a<br />
monitoring well and in the third quarter of <strong>2009</strong>, drilled a horizontal well. The horizontal well is being completed<br />
and will be tested during the first quarter of 2010. In addition, to evaluate one of the shallower zones, <strong>EOG</strong> drilled a<br />
second monitoring well during the third quarter of <strong>2009</strong> and is currently drilling a second horizontal well that it plans<br />
to complete during the third quarter of 2010.<br />
<strong>EOG</strong> continues to evaluate other select natural gas and crude oil opportunities outside the United States and<br />
Canada primarily by pursuing exploitation opportunities in countries where indigenous natural gas and crude oil<br />
reserves have been identified.<br />
27
Capital Structure<br />
One of management's key strategies is to maintain a strong balance sheet with a consistently below average<br />
debt-to-total capitalization ratio as compared to those in <strong>EOG</strong>'s peer group. At December 31, <strong>2009</strong>, <strong>EOG</strong>'s debt-tototal<br />
capitalization ratio was 22%. During <strong>2009</strong>, <strong>EOG</strong> funded $3.8 billion in exploration and development and other<br />
property, plant and equipment expenditures (excluding asset retirement costs and non-cash acquisition costs), paid<br />
$142 million in dividends to common stockholders and purchased $11 million of treasury stock, primarily by<br />
utilizing cash provided from its operating activities, proceeds from long-term debt borrowings, proceeds from the<br />
sale of its California assets and the issuance of 1.45 million shares of <strong>EOG</strong> common stock valued at $89.6 million.<br />
Management has not finalized or recommended to <strong>EOG</strong>'s Board a 2010 capital expenditures budget.<br />
Management continues to evaluate various factors impacting future natural gas and crude oil prices, including the<br />
quantities of natural gas in storage and North American natural gas supplies. In addition, <strong>EOG</strong> continues to evaluate<br />
certain potential exploration and development prospects. All of these factors and uncertainties impact future capital<br />
requirements. <strong>EOG</strong> expects to finalize a 2010 capital expenditures budget early in the second quarter. While <strong>EOG</strong><br />
currently anticipates an increase in its 2010 capital expenditures budget as compared to its <strong>2009</strong> budget, <strong>EOG</strong><br />
intends to maintain a strong balance sheet and a below average debt-to-capitalization ratio as compared to its peer<br />
group.<br />
When it fits <strong>EOG</strong>'s strategy, <strong>EOG</strong> will make acquisitions that bolster existing drilling programs or offer<br />
<strong>EOG</strong> incremental exploration and/or production opportunities. Management continues to believe <strong>EOG</strong> has one of<br />
the strongest prospect inventories in <strong>EOG</strong>'s history.<br />
On May 21, <strong>2009</strong>, <strong>EOG</strong> completed its public offering of $900 million aggregate principal amount of<br />
5.625% Senior Notes due 2019 (2019 Notes). Interest on the 2019 Notes is payable semi-annually in arrears on June<br />
1 and December 1 of each year, beginning December 1, <strong>2009</strong>. Net proceeds from the offering of approximately<br />
$891 million were used for general corporate purposes, including repayment of outstanding commercial paper<br />
borrowings.<br />
Results of Operations<br />
The following review of operations for each of the three years in the period ended December 31, <strong>2009</strong> should<br />
be read in conjunction with the consolidated financial statements of <strong>EOG</strong> and notes thereto beginning with page F-1.<br />
Net Operating Revenues<br />
During <strong>2009</strong>, net operating revenues decreased $2,340 million, or 33%, to $4,787 million from $7,127 million<br />
in 2008. Total wellhead revenues, which are revenues generated from sales of <strong>EOG</strong>'s production of natural gas, crude<br />
oil and condensate and natural gas liquids, decreased $2,823 million, or 45%, to $3,399 million from $6,222 million in<br />
2008. During <strong>2009</strong>, <strong>EOG</strong> recognized net gains on mark-to-market commodity derivative contracts of $432 million<br />
compared to net gains of $598 million in 2008. Gathering, processing and marketing revenues, which are revenues<br />
generated from sales of third-party natural gas, crude oil and condensate and natural gas liquids as well as gathering fees<br />
associated with gathering third-party natural gas, increased $242 million, or 147%, to $407 million in <strong>2009</strong> from $165<br />
million in 2008. Gains on property dispositions, net in <strong>2009</strong> primarily consist of a pretax gain of $390 million realized<br />
on an exchange of properties in the Rocky Mountain area and a pretax gain of $146 million realized on the sale of<br />
<strong>EOG</strong>'s California assets. Gains on property dispositions, net in 2008 primarily consist of the gain of $128 million on the<br />
sale of Appalachian assets in February 2008.<br />
28
Wellhead volume and price statistics for the years ended December 31, <strong>2009</strong>, 2008 and 2007 were as follows:<br />
Year Ended December 31 <strong>2009</strong> 2008 2007<br />
Natural Gas Volumes (MMcfd) (1)<br />
United States 1,134 1,162 971<br />
Canada 224 222 224<br />
Trinidad 273 218 252<br />
Other International (2) 14 17 23<br />
Total 1,645 1,619 1,470<br />
Average Natural Gas Prices ($/Mcf) (3)<br />
United States $ 3.72 $ 8.22 $ 6.27<br />
Canada 3.85 7.64 6.25<br />
Trinidad 1.73 3.58 2.71<br />
Other International (2) 4.34 8.18 6.19<br />
Composite 3.42 7.51 5.65<br />
Crude Oil and Condensate Volumes (MBbld) (1)<br />
United States 47.9 39.5 24.6<br />
Canada 4.1 2.7 2.4<br />
Trinidad 3.1 3.2 4.1<br />
Other International (2) 0.1 0.1 0.1<br />
Total 55.2 45.5 31.2<br />
Average Crude Oil and Condensate Prices ($/Bbl) (3)<br />
United States $ 54.42 $ 87.68 $ 68.85<br />
Canada 57.72 89.70 65.27<br />
Trinidad 50.85 92.90 69.84<br />
Other International (2) 53.07 99.30 66.84<br />
Composite 54.46 88.18 68.69<br />
Natural Gas Liquids Volumes (MBbld) (1)<br />
United States 22.5 15.0 11.1<br />
Canada 1.1 1.0 1.1<br />
Total 23.6 16.0 12.2<br />
Average Natural Gas Liquids Prices ($/Bbl) (3)<br />
United States $ 30.03 $ 53.33 $ 47.63<br />
Canada 30.49 54.77 44.54<br />
Composite 30.05 53.42 47.36<br />
Natural Gas Equivalent Volumes (MMcfed) (4)<br />
United States 1,556 1,490 1,184<br />
Canada 256 244 245<br />
Trinidad 291 237 276<br />
Other International (2) 15 17 24<br />
Total 2,118 1,988 1,729<br />
Total Bcfe (4) 773.0 727.6 631.3<br />
(1) Million cubic feet per day or thousand barrels per day, as applicable.<br />
(2) Other International includes <strong>EOG</strong>'s United Kingdom operations and, effective July 1, 2008, <strong>EOG</strong>'s China operations.<br />
(3) Dollars per thousand cubic feet or per barrel, as applicable.<br />
(4) Million cubic feet equivalent per day or billion cubic feet equivalent, as applicable; includes natural gas, crude oil and condensate and<br />
natural gas liquids. Natural gas equivalents are determined using the ratio of 6.0 thousand cubic feet of natural gas to 1.0 barrel of crude<br />
oil and condensate or natural gas liquids.<br />
29
<strong>2009</strong> compared to 2008. Wellhead natural gas revenues in <strong>2009</strong> decreased $2,401 million, or 54%, to<br />
$2,051 million from $4,452 million for 2008 due to a lower composite average wellhead natural gas price ($2,460<br />
million), partially offset by increased natural gas deliveries ($59 million). <strong>EOG</strong>'s composite average wellhead<br />
natural gas price decreased 54% to $3.42 per Mcf in <strong>2009</strong> from $7.51 per Mcf in 2008.<br />
Natural gas deliveries increased 26 MMcfd, or 2%, to 1,645 MMcfd in <strong>2009</strong> from 1,619 MMcfd in 2008.<br />
The increase was primarily due to higher production of 55 MMcfd in Trinidad, partially offset by lower production<br />
of 28 MMcfd in the United States and 6 MMcfd in the United Kingdom. The increase in Trinidad was primarily due<br />
to a reduction in plant shutdowns for maintenance during <strong>2009</strong> (39 MMcfd) and increased net contractual deliveries<br />
(16 MMcfd). The decrease in the United States was primarily attributable to decreased production from Texas (26<br />
MMcfd), New Mexico (6 MMcfd), Mississippi (4 MMcfd), Kansas (3 MMcfd) and Oklahoma (3 MMcfd), partially<br />
offset by increased production in Louisiana (6 MMcfd) and in the Rocky Mountain area (8 MMcfd). The decrease<br />
in production in the United Kingdom was a result of production declines in both the Arthur and Valkyrie fields.<br />
Wellhead crude oil and condensate revenues decreased $368 million, or 25%, to $1,090 million in <strong>2009</strong><br />
from $1,458 million in 2008, due to a lower composite average wellhead crude oil and condensate price ($675<br />
million), partially offset by an increase of 10 MBbld, or 21%, in wellhead crude oil and condensate deliveries ($307<br />
million). The increase in deliveries primarily reflects increased production in North Dakota (8 MBbld) and Texas (2<br />
MBbld). The composite average wellhead crude oil and condensate price for <strong>2009</strong> decreased 38% to $54.46 per<br />
barrel compared to $88.18 per barrel for 2008.<br />
Natural gas liquids revenues decreased $53 million, or 17%, to $259 million in <strong>2009</strong> from $312 million in<br />
2008, due to a lower composite average price ($201 million), partially offset by an increase of 8 MBbld, or 48%, in<br />
natural gas liquids deliveries ($148 million). The composite average natural gas liquids price for <strong>2009</strong> decreased<br />
44% to $30.05 per barrel compared to $53.42 per barrel for 2008. The increase in deliveries primarily reflects<br />
increased volumes in the Fort Worth Basin Barnett Shale area.<br />
During <strong>2009</strong>, <strong>EOG</strong> recognized net gains on mark-to-market financial commodity derivative contracts of<br />
$432 million, which included net realized gains of $1,278 million. During 2008, <strong>EOG</strong> recognized net gains on<br />
mark-to-market financial commodity derivative contracts of $598 million, which included net realized losses of $137<br />
million.<br />
Gathering, processing and marketing revenues represent sales of third-party natural gas, crude oil and<br />
condensate and natural gas liquids as well as gathering fees associated with gathering third-party natural gas. For the<br />
year ended December 31, <strong>2009</strong>, substantially all of such revenues were related to sales of third-party natural gas and<br />
crude oil. For the years ended December 31, 2008 and 2007, such revenues were primarily related to sales of thirdparty<br />
natural gas. Sales of third-party natural gas are utilized in order to balance firm transportation capacity with<br />
production in certain areas. Marketing costs represent the costs of purchasing third-party natural gas and crude oil<br />
and the associated transportation costs.<br />
Gathering, processing and marketing revenues less marketing costs decreased $2 million to $10 million in<br />
<strong>2009</strong> compared to $12 million in 2008. The decrease resulted primarily from natural gas marketing operations in the<br />
Gulf Coast area.<br />
2008 compared to 2007. Wellhead natural gas revenues in 2008 increased $1,419 million, or 47%, to<br />
$4,452 million from $3,033 million for 2007 due to a higher composite average wellhead natural gas price ($1,101<br />
million) and increased natural gas deliveries ($318 million). <strong>EOG</strong>'s composite average wellhead natural gas price<br />
increased 33% to $7.51 per Mcf in 2008 from $5.65 per Mcf in 2007.<br />
Natural gas deliveries increased 149 MMcfd, or 10%, to 1,619 MMcfd in 2008 from 1,470 MMcfd in 2007.<br />
The increase was due to higher production of 191 MMcfd in the United States and initial production of 5 MMcfd in<br />
China, partially offset by lower production of 34 MMcfd in Trinidad, 11 MMcfd in the United Kingdom and 2<br />
MMcfd in Canada. The increase in the United States was primarily attributable to increased production from Texas<br />
(140 MMcfd), the Rocky Mountain area (54 MMcfd), Mississippi (8 MMcfd) and Kansas (4 MMcfd), partially<br />
offset by decreased production due to the February 2008 sale of Appalachian assets (15 MMcfd). The decline in<br />
Trinidad was primarily due to decreased deliveries as a result of plant shutdowns due to unplanned maintenance<br />
activities (29 MMcfd) and reduced deliveries due to lower demand in 2008 (10 MMcfd), partially offset by increased<br />
deliveries to Atlantic LNG Train 4 (ALNG) (5 MMcfd). The decrease in production in the United Kingdom was a<br />
result of production declines in both the Arthur and Valkyrie fields.<br />
30
Wellhead crude oil and condensate revenues increased $680 million, or 87%, to $1,458 million in 2008<br />
from $778 million in 2007, due to an increase of 14.3 MBbld, or 46%, in wellhead crude oil and condensate<br />
deliveries ($358 million) and a higher composite average wellhead crude oil and condensate price ($322 million).<br />
The increase in deliveries primarily reflects increased production in North Dakota (12 MBbld). The composite<br />
average wellhead crude oil and condensate price for 2008 increased 28% to $88.18 per barrel compared to $68.69<br />
per barrel for 2007.<br />
Natural gas liquids revenues increased $102 million, or 49%, to $312 million in 2008 from $210 million in<br />
2007, due to increases in deliveries ($67 million) and a higher composite average price ($35 million). The<br />
composite average natural gas liquids price for 2008 increased 13% to $53.42 per barrel compared to $47.36 per<br />
barrel for 2007. The increase in deliveries primarily reflects increased volumes in the Fort Worth Basin Barnett<br />
Shale and Rocky Mountain areas.<br />
During 2008, <strong>EOG</strong> recognized net gains on mark-to-market financial commodity derivative contracts of<br />
$598 million, which included net realized losses of $137 million. During 2007, <strong>EOG</strong> recognized net gains on markto-market<br />
financial commodity derivative contracts of $93 million, which included net realized gains of $128 million.<br />
Gathering, processing and marketing revenues less marketing costs increased $5 million to $12 million in<br />
2008 compared to $7 million in 2007. The increase resulted primarily from natural gas marketing operations in the<br />
Gulf Coast area.<br />
Operating and Other Expenses<br />
<strong>2009</strong> compared to 2008. During <strong>2009</strong>, operating expenses of $3,816 million were $456 million higher than<br />
the $3,360 million incurred in 2008. The following table presents the costs per thousand cubic feet equivalent<br />
(Mcfe) for the years ended December 31, <strong>2009</strong> and 2008:<br />
<strong>2009</strong> 2008<br />
Lease and Well $ 0.75 $ 0.77<br />
Transportation Costs 0.37 0.38<br />
Depreciation, Depletion and Amortization (DD&A) -<br />
Oil and Gas Properties 1.89 1.74<br />
Other Property, Plant and Equipment 0.12 0.09<br />
General and Administrative (G&A) 0.32 0.34<br />
Net Interest Expense 0.13 0.07<br />
Total (1) $ 3.58 $ 3.39<br />
(1) Total excludes gathering and processing costs, exploration costs, dry hole costs, impairments, marketing costs and taxes<br />
other than income.<br />
The primary factors impacting the cost components of per-unit rates of lease and well, transportation costs,<br />
DD&A, G&A and net interest expense for <strong>2009</strong> compared to 2008 are set forth below.<br />
Lease and well expenses include expenses for <strong>EOG</strong>-operated properties, as well as expenses billed to <strong>EOG</strong><br />
from other operators where <strong>EOG</strong> is not the operator of a property. Lease and well expenses can be divided into the<br />
following categories: costs to operate and maintain <strong>EOG</strong>'s natural gas and crude oil wells, the cost of workovers and<br />
lease and well administrative expenses. Operating and maintenance expenses include, among other things, pumping<br />
services, salt water disposal, equipment repair and maintenance, compression expense, lease upkeep and fuel and<br />
power. Workovers are costs of operations to restore or maintain production from existing wells.<br />
Each of these categories of costs individually fluctuates from time to time as <strong>EOG</strong> attempts to maintain and<br />
increase production while maintaining efficient, safe and environmentally responsible operations. <strong>EOG</strong> continues to<br />
increase its operating activities by drilling new wells in existing and new areas. Operating costs within these existing<br />
and new areas, as well as the costs of services charged to <strong>EOG</strong> by vendors, fluctuate over time.<br />
31
Lease and well expenses of $579 million in <strong>2009</strong> increased $20 million from $559 million in 2008 due<br />
primarily to higher operating and maintenance expenses in Canada ($16 million) and the United States ($14 million),<br />
partially offset by changes in the Canadian exchange rate ($8 million) and lower lease and well administrative<br />
expenses ($5 million).<br />
Transportation costs represent costs incurred directly by <strong>EOG</strong> from third-party carriers associated with the<br />
delivery of hydrocarbon products from the lease to a downstream point of sale. Transportation costs include the cost<br />
of compression (the cost of compressing natural gas to meet pipeline pressure requirements), dehydration (the cost<br />
associated with removing water from natural gas to meet pipeline requirements), gathering fees, fuel costs,<br />
transportation fees and third-party costs associated with transporting crude oil.<br />
Transportation costs of $283 million in <strong>2009</strong> increased $9 million from $274 million in 2008 primarily due<br />
to increased transportation costs in the Rocky Mountain area ($19 million), partially offset by decreased<br />
transportation costs in the Fort Worth Basin Barnett Shale area ($8 million).<br />
DD&A of the cost of proved oil and gas properties is calculated using the unit-of-production method.<br />
<strong>EOG</strong>'s DD&A rate and expense are the composite of numerous individual field calculations. There are several<br />
factors that can impact <strong>EOG</strong>'s composite DD&A rate and expense, such as field production profiles, drilling or<br />
acquisition of new wells, disposition of existing wells, reserve revisions (upward or downward) primarily related to<br />
well performance and impairments. Changes to these factors may cause <strong>EOG</strong>'s composite DD&A rate and expense<br />
to fluctuate from year to year. DD&A of the cost of other property, plant and equipment is calculated using the<br />
straight-line depreciation method over the useful lives of the assets. Other property, plant and equipment consist of<br />
gathering and processing assets, compressors, vehicles, buildings and leasehold improvements, furniture and fixtures,<br />
and computer hardware and software.<br />
DD&A expenses in <strong>2009</strong> increased $222 million to $1,549 million from $1,327 million in 2008. DD&A<br />
expenses associated with oil and gas properties were $192 million higher than in 2008 primarily due to higher unit<br />
rates described below and as a result of increased production in the United States ($42 million), Canada ($9 million)<br />
and Trinidad ($6 million), partially offset by a decrease in production in the United Kingdom ($3 million). DD&A<br />
rates increased due primarily to a proportional increase in production from higher cost properties in the United States<br />
($105 million), Canada ($22 million) and Trinidad ($13 million), partially offset by changes in the Canadian<br />
exchange rate ($13 million).<br />
DD&A expenses associated with other property, plant and equipment were $30 million higher in <strong>2009</strong> than<br />
in 2008 primarily due to increased expenditures associated with gathering and processing assets in the Fort Worth<br />
Basin Barnett Shale area ($16 million) and the Rocky Mountain area ($9 million).<br />
G&A expenses of $248 million in <strong>2009</strong> were $5 million higher than 2008 due primarily to higher insurance<br />
costs ($3 million) and higher employee-related costs ($2 million).<br />
Net interest expense of $101 million in <strong>2009</strong> increased $49 million from $52 million in 2008 primarily due to a<br />
higher average debt balance ($61 million), partially offset by higher capitalized interest ($12 million).<br />
Gathering and processing costs represent operating and maintenance expenses and administrative expenses<br />
associated with operating <strong>EOG</strong>'s gathering and processing assets.<br />
Gathering and processing costs increased $17 million to $58 million in <strong>2009</strong> compared to $41 million in<br />
2008. The increase primarily reflects increased activities in the Fort Worth Basin Barnett Shale area ($8 million)<br />
and the Rocky Mountain area ($8 million).<br />
Exploration costs of $170 million in <strong>2009</strong> decreased $24 million from $194 million for the same prior year<br />
period primarily due to decreased geological and geophysical expenditures in the Fort Worth Basin Barnett Shale<br />
area.<br />
32
Impairments include amortization of unproved oil and gas property costs, as well as impairments of proved<br />
oil and gas properties. Unproved properties with individually significant acquisition costs are amortized over the<br />
lease term and analyzed on a property-by-property basis for any impairment in value. Unproved properties with<br />
acquisition costs that are not individually significant are aggregated, and the portion of such costs estimated to be<br />
nonproductive is amortized over the remaining lease term. When circumstances indicate that a proved property may<br />
be impaired, <strong>EOG</strong> compares expected undiscounted future cash flows at a producing field level to the unamortized<br />
capitalized cost of the asset. If the future undiscounted cash flows are lower than the unamortized capitalized cost,<br />
the capitalized cost is reduced to fair value. Fair value is calculated by discounting the future cash flows at an<br />
appropriate risk-adjusted discount rate.<br />
Impairments of $306 million in <strong>2009</strong> increased $113 million from $193 million in 2008 primarily due to<br />
increased amortization of unproved property costs in the United States ($103 million) and increased impairments of<br />
proved properties in the United States ($32 million), partially offset by 2008 impairments in Trinidad as a result of<br />
<strong>EOG</strong>'s relinquishment of its rights to Block Lower Reverse "L" (LRL) ($20 million) and in the United Kingdom for<br />
the Arthur field ($6 million). <strong>EOG</strong> recorded impairments of proved properties of $94 million and $86 million for<br />
<strong>2009</strong> and 2008, respectively.<br />
Taxes other than income include severance/production taxes, ad valorem/property taxes, payroll taxes,<br />
franchise taxes and other miscellaneous taxes. Severance/production taxes are determined based on wellhead<br />
revenues and ad valorem/property taxes are generally determined based on the valuation of the underlying assets.<br />
Taxes other than income in <strong>2009</strong> decreased $147 million to $174 million (5.1% of wellhead revenues) from<br />
$321 million (5.2% of wellhead revenues) in 2008. The decrease in taxes other than income was primarily due to<br />
decreased severance/production taxes primarily as a result of decreased wellhead revenues in the United States ($103<br />
million), Trinidad ($13 million) and Canada ($3 million); an increase in credits taken in <strong>2009</strong> for Texas high cost gas<br />
severance tax rate reductions ($16 million); and lower ad valorem/property taxes in the United States ($15 million).<br />
Other income, net was $2 million in <strong>2009</strong> compared to $31 million in 2008. The decrease of $29 million<br />
was primarily due to lower equity income from ammonia plants in Trinidad ($15 million), lower interest income ($8<br />
million) and settlements received in 2008 related to the Enron Corp. bankruptcy ($3 million).<br />
<strong>Inc</strong>ome tax provision of $325 million in <strong>2009</strong> decreased $984 million compared to 2008 due primarily to<br />
decreased pretax income. The net effective tax rate for <strong>2009</strong> increased to 37% from 35% in 2008. The increase in<br />
the <strong>2009</strong> net effective tax rate is primarily as a result of higher state tax rates and the absence of 2008 tax benefits<br />
related to the impairment of LRL.<br />
2008 compared to 2007. During 2008, operating expenses of $3,360 million were $769 million higher than<br />
the $2,591 million incurred in 2007. The following table presents the costs per Mcfe for the years ended December<br />
31, 2008 and 2007:<br />
2008 2007<br />
Lease and Well $ 0.77 $ 0.72<br />
Transportation Costs 0.38 0.24<br />
DD&A -<br />
Oil and Gas Properties 1.74 1.63<br />
Other Property, Plant and Equipment 0.09 0.06<br />
G&A 0.34 0.33<br />
Net Interest Expense 0.07 0.07<br />
Total (1) $ 3.39 $ 3.05<br />
(1) Total excludes gathering and processing costs, exploration costs, dry hole costs, impairments, marketing costs and taxes<br />
other than income.<br />
The primary factors impacting the cost components of per-unit rates of lease and well, transportation costs,<br />
DD&A, G&A and net interest expense for 2008 compared to 2007 are set forth below.<br />
33
Lease and well expenses of $559 million in 2008 increased $107 million from $452 million in 2007 due<br />
primarily to higher operating and maintenance expenses ($78 million) and higher lease and well administrative<br />
expenses ($28 million), both in the United States.<br />
Transportation costs of $274 million in 2008 increased $122 million from $152 million in 2007 primarily<br />
due to increased production and costs associated with marketing arrangements to transport production from the Fort<br />
Worth Basin Barnett Shale area ($64 million) and the Rocky Mountain area ($38 million) to downstream markets.<br />
DD&A expenses in 2008 increased $261 million to $1,327 million from $1,066 million in 2007. DD&A<br />
expenses associated with oil and gas properties were $236 million higher than in 2007 primarily due to higher unit<br />
rates described below and as a result of increased production in the United States ($210 million), partially offset by a<br />
decrease in production in the United Kingdom ($10 million) and in Trinidad ($3 million). DD&A rates increased<br />
due primarily to a proportional increase in production from higher cost properties in the United States ($15 million)<br />
and Canada ($8 million). Changes in the Canadian exchange rate ($11 million) also contributed to the DD&A<br />
expense increase.<br />
DD&A expenses associated with other property, plant and equipment were $25 million higher in 2008 than<br />
in 2007 primarily due to increased expenditures associated with natural gas gathering systems in the Fort Worth<br />
Basin Barnett Shale area.<br />
G&A expenses of $244 million in 2008 were $38 million higher than 2007 due primarily to higher<br />
employee-related costs ($33 million). The increase in employee-related costs primarily reflects higher stock-based<br />
compensation expenses ($18 million).<br />
Net interest expense of $52 million in 2008 increased $5 million from $47 million in 2007 primarily due to a<br />
higher average debt balance ($18 million), partially offset by higher capitalized interest ($13 million).<br />
Gathering and processing costs increased $13 million to $41 million in 2008 as compared to $28 million in<br />
2007. The increase primarily reflects increased activities in the Fort Worth Basin Barnett Shale and Rocky<br />
Mountain areas.<br />
Exploration costs of $194 million in 2008 increased $44 million from $150 million for the same prior year<br />
period primarily due to increased geological and geophysical expenditures in the United States ($27 million) and<br />
higher employee-related costs ($15 million). The increase in geological and geophysical expenditures in the United<br />
States was primarily attributable to activities in the Fort Worth Basin Barnett Shale area ($21 million).<br />
Impairments of $193 million in 2008 were $45 million higher than impairments of $148 million in 2007 due<br />
primarily to increased amortization costs as a result of increased leasehold acquisition expenditures in the United<br />
States ($30 million) and Canada ($12 million), an impairment in Trinidad recorded in the second quarter of 2008 as<br />
a result of <strong>EOG</strong>'s relinquishment of its rights to LRL ($20 million) and an impairment in the United Kingdom for the<br />
Arthur field ($6 million), partially offset by decreased impairments in Canada ($20 million). <strong>EOG</strong> recorded<br />
impairments of proved properties of $86 million and $82 million for 2008 and 2007, respectively.<br />
Taxes other than income in 2008 increased $113 million to $321 million (5.2% of wellhead revenues) from<br />
$208 million (5.2% of wellhead revenues) in 2007 primarily due to an increase in severance/production taxes in the<br />
United States as a result of increased wellhead revenues ($86 million), a decrease in credits taken in 2008 for Texas<br />
high cost gas severance tax rate reductions ($13 million) and increased ad valorem/property taxes as a result of<br />
higher property valuations in the United States ($20 million).<br />
<strong>Inc</strong>ome tax provision of $1,310 million in 2008 increased $769 million compared to 2007 due primarily to<br />
increased pretax income. The net effective tax rate for 2008 increased to 35% from 33% in 2007. The increase in<br />
the 2008 net effective tax rate is primarily due to a Canadian federal tax rate reduction in 2007.<br />
34
Capital <strong>Resources</strong> and Liquidity<br />
Cash Flow<br />
The primary sources of cash for <strong>EOG</strong> during the three-year period ended December 31, <strong>2009</strong> were funds<br />
generated from operations, net proceeds from the issuance of long-term debt, proceeds from the sale of oil and gas<br />
properties, proceeds from stock options exercised and employee stock purchase plan activity, net commercial paper<br />
borrowings and borrowings under other uncommitted credit facilities and revolving credit facilities. The primary uses<br />
of cash were funds used in operations; exploration and development expenditures; other property, plant and<br />
equipment expenditures; dividend payments to stockholders; repayments of debt; and redemptions of preferred stock.<br />
<strong>2009</strong> compared to 2008. Net cash provided by operating activities of $2,922 million in <strong>2009</strong> decreased<br />
$1,711 million from $4,633 million in 2008 primarily reflecting a decrease in wellhead revenues ($2,823 million);<br />
unfavorable changes in working capital and other assets and liabilities ($335 million); an increase in cash operating<br />
expenses ($125 million); and an increase in cash paid for interest expense ($53 million); partially offset by a<br />
favorable change in the net cash flow from the settlement of financial commodity derivative contracts ($1,414<br />
million); an increase in gathering, processing and marketing revenues ($243 million); and a decrease in cash paid for<br />
income taxes ($43 million).<br />
Net cash used in investing activities of $3,415 million in <strong>2009</strong> decreased by $1,552 million from $4,967<br />
million for the same period of 2008 due primarily to a decrease in additions to oil and gas properties ($1,542<br />
million); a decrease in additions to other property, plant and equipment ($150 million); and favorable changes in<br />
working capital associated with investing activities ($34 million); partially offset by a decrease in proceeds from<br />
sales of assets ($172 million). Proceeds from sales of assets included net proceeds from the sale of <strong>EOG</strong>'s California<br />
assets in December <strong>2009</strong> ($200 million) and net proceeds from the sale of <strong>EOG</strong>'s Appalachian assets in February<br />
2008 ($386 million).<br />
Net cash provided by financing activities of $834 million in <strong>2009</strong> included the issuance of long-term debt<br />
($900 million), excess tax benefits from stock-based compensation ($76 million) and proceeds from stock options<br />
exercised and employee stock purchase plan activity ($20 million). Cash used in financing activities during <strong>2009</strong><br />
included cash dividend payments ($142 million), treasury stock purchases ($11 million) and debt issuance costs ($9<br />
million).<br />
2008 compared to 2007. Net cash provided by operating activities of $4,633 million in 2008 increased<br />
$1,732 million from $2,901 million in 2007 primarily reflecting an increase in wellhead revenues ($2,202 million);<br />
favorable changes in working capital and other assets and liabilities ($170 million); an increase in gathering,<br />
processing and marketing revenues ($91 million); and a decrease in cash paid for income taxes ($50 million);<br />
partially offset by an increase in cash operating expenses ($404 million); an increase in marketing costs ($86<br />
million); an unfavorable change in the net cash flow from the settlement of financial commodity derivative contracts<br />
($265 million); and an increase in cash paid for interest expense ($9 million).<br />
Net cash used in investing activities of $4,967 million in 2008 increased by $1,511 million from $3,456<br />
million for the same period of 2007 due primarily to an increase in additions to oil and gas properties ($1,317<br />
million), unfavorable changes in working capital associated with investing activities ($296 million) and an increase<br />
in additions to other property, plant and equipment ($199 million), partially offset by an increase in proceeds from<br />
sales of assets ($300 million), primarily reflecting net proceeds from the sale of <strong>EOG</strong>'s Appalachian assets.<br />
Net cash provided by financing activities of $645 million in 2008 included the issuance of long-term debt<br />
($750 million), proceeds from stock options exercised and employee stock purchase plan activity ($73 million) and<br />
excess tax benefits from stock-based compensation ($6 million). Cash used in financing activities during 2008<br />
included cash dividend payments ($115 million), Trinidad revolving credit facility repayment ($38 million), treasury<br />
stock purchases ($18 million), debt issuance costs ($8 million) and the redemption of preferred stock ($5 million).<br />
35
Total Expenditures<br />
The table below sets out components of total expenditures for the years ended December 31, <strong>2009</strong>, 2008 and<br />
2007 (in millions):<br />
Actual<br />
<strong>2009</strong> 2008 2007<br />
Expenditure Category<br />
Capital<br />
Drilling and Facilities $ 2,417 $ 3,990 $ 2,976<br />
Leasehold Acquisitions 424 521 278<br />
Property Acquisitions (1) 707 109 20<br />
Capitalized Interest 55 43 29<br />
Subtotal 3,603 4,663 3,303<br />
Exploration Costs 170 194 150<br />
Dry Hole Costs 51 55 115<br />
Exploration and Development Expenditures 3,824 4,912 3,568<br />
Asset Retirement Costs 84 181 31<br />
Total Exploration and Development<br />
Expenditures 3,908 5,093 3,599<br />
Other Property, Plant and Equipment 326 477 277<br />
Total Expenditures $ 4,234 $ 5,570 $ 3,876<br />
(1) In <strong>2009</strong>, property acquisitions includes non-cash additions of $353 million related to a property exchange transaction in the<br />
Rocky Mountain area and contingent consideration, with a fair value of $35 million, related to the acquisition of the<br />
Haynesville Assets.<br />
Exploration and development expenditures of $3,824 million for <strong>2009</strong> were $1,088 million lower than the<br />
prior year due primarily to decreased drilling and facilities expenditures in the United States ($1,529 million),<br />
Canada ($44 million) and Trinidad ($41 million); decreased leasehold acquisition expenditures in Canada ($122<br />
million); decreased geological and geophysical expenditures in the United States ($23 million); changes in the<br />
foreign currency exchange rate in Canada ($16 million); decreased property acquisition expenditures in Trinidad<br />
($15 million), Canada ($14 million) and China ($10 million); and decreased dry hole costs in Canada ($11 million)<br />
and the United States ($4 million). These decreases were partially offset by increased property acquisition<br />
expenditures in the United States ($638 million), increased drilling and facilities expenditures in China ($41 million)<br />
and the United Kingdom ($10 million), increased leasehold acquisition expenditures in the United States ($29<br />
million), increased capitalized interest in the United States ($15 million) and increased dry hole costs in the United<br />
Kingdom ($12 million). The <strong>2009</strong> exploration and development expenditures of $3,824 million include $2,082<br />
million in development, $980 million in exploration, $707 million in property acquisitions and $55 million in<br />
capitalized interest. The decrease in expenditures for other property, plant and equipment primarily related to<br />
gathering and processing assets in the Fort Worth Basin Barnett Shale area. The 2008 exploration and development<br />
expenditures of $4,912 million include $3,612 million in development, $1,148 million in exploration, $109 million<br />
in property acquisitions and $43 million in capitalized interest. The increase in expenditures for other property, plant<br />
and equipment primarily related to gathering and processing assets in the Fort Worth Basin Barnett Shale and Rocky<br />
Mountain areas. The 2007 exploration and development expenditures of $3,568 million include $2,681 million in<br />
development, $838 million in exploration, $29 million in capitalized interest and $20 million in property<br />
acquisitions.<br />
The level of exploration and development expenditures, including acquisitions, will vary in future periods<br />
depending on energy market conditions and other related economic factors. <strong>EOG</strong> has significant flexibility with<br />
respect to financing alternatives and the ability to adjust its exploration and development expenditure budget as<br />
circumstances warrant. While <strong>EOG</strong> has certain continuing commitments associated with expenditure plans related to<br />
operations in the United States, Canada, Trinidad, the United Kingdom and China, such commitments are not<br />
expected to be material when considered in relation to the total financial capacity of <strong>EOG</strong>.<br />
36
Derivative Transactions<br />
During <strong>2009</strong>, <strong>EOG</strong> recognized net gains on mark-to-market financial commodity derivative contracts of<br />
$432 million, which included net realized gains of $1,278 million. During 2008, <strong>EOG</strong> recognized net gains on<br />
mark-to-market financial commodity derivative contracts of $598 million, which included net realized losses of $137<br />
million. See Note 11 to Consolidated Financial Statements.<br />
Financial Collar Contracts. The total fair value of <strong>EOG</strong>'s natural gas financial collar contracts at<br />
December 31, <strong>2009</strong> was a positive $34 million, which is reflected in the Consolidated Balance Sheets. Presented<br />
below is a comprehensive summary of <strong>EOG</strong>'s natural gas financial collar contracts at February 25, 2010. The<br />
notional volumes are expressed in million British thermal units per day (MMBtud) and prices are expressed in<br />
dollars per million British thermal units ($/MMBtu). The average floor price of <strong>EOG</strong>'s outstanding natural gas<br />
financial collar contracts for 2010 is $9.34 per million British thermal units (MMBtu) and the average ceiling price is<br />
$11.54 per MMBtu.<br />
Natural Gas Financial Collar Contracts<br />
Floor Price<br />
Ceiling Price<br />
Weighted Ceiling Weighted<br />
Volume Floor Range Average Price Range Average Price<br />
(MMBtud) ($/MMBtu) ($/MMBtu) ($/MMBtu) ($/MMBtu)<br />
2010<br />
January (closed) 40,000 $11.44 - 11.47 $11.45 $13.79 - 13.90 $13.85<br />
February (closed) 40,000 11.38 - 11.41 11.40 13.75 - 13.85 13.80<br />
March (closed) 40,000 11.13 - 11.15 11.14 13.50 - 13.60 13.55<br />
April 40,000 9.40 - 9.45 9.42 11.55 - 11.65 11.60<br />
May 40,000 9.24 - 9.29 9.26 11.41 - 11.55 11.48<br />
June 40,000 9.31 - 9.36 9.34 11.49 - 11.60 11.55<br />
On April 29, <strong>2009</strong>, <strong>EOG</strong> settled its natural gas financial collar contracts with notional volumes of 40,000<br />
MMBtud for the July 1, 2010 to December 31, 2010 period and received proceeds of $26.5 million.<br />
Financial Price Swap Contracts. The total fair value of <strong>EOG</strong>'s natural gas financial price swap contracts at<br />
December 31, <strong>2009</strong> was a positive $16 million, which is reflected in the Consolidated Balance Sheets. Presented<br />
below is a comprehensive summary of <strong>EOG</strong>'s natural gas financial price swap contracts at February 25, 2010. The<br />
average price of <strong>EOG</strong>'s natural gas financial price swap contracts for 2010 is $9.21 per MMBtu.<br />
Natural Gas Financial Price Swap Contracts<br />
Weighted<br />
Volume Average Price<br />
(MMBtud) ($/MMBtu)<br />
2010<br />
January (closed) 20,000 $11.20<br />
February (closed) 20,000 11.15<br />
March (closed) 20,000 10.89<br />
April 20,000 9.29<br />
May 20,000 9.13<br />
June 20,000 9.21<br />
On April 24, <strong>2009</strong>, <strong>EOG</strong> settled its natural gas financial price swap contracts with notional volumes of<br />
20,000 MMBtud for the July 1, 2010 to December 31, 2010 period and received proceeds of $12.1 million.<br />
37
Financial Basis Swap Contracts. Prices received by <strong>EOG</strong> for its natural gas production generally vary from<br />
New York Mercantile Exchange (NYMEX) prices due to adjustments for delivery location (basis) and other factors.<br />
<strong>EOG</strong> has entered into natural gas financial basis swap contracts in order to fix the differential between prices in the<br />
Rocky Mountain area and NYMEX Henry Hub prices. The total fair value of <strong>EOG</strong>'s natural gas financial basis swap<br />
contracts at December 31, <strong>2009</strong> was a negative $66 million, which is reflected in the Consolidated Balance Sheets.<br />
Presented below is a comprehensive summary of <strong>EOG</strong>'s natural gas financial basis swap contracts at February 25,<br />
2010. The weighted average price differential represents the amount of reduction to NYMEX gas prices per MMBtu<br />
for the notional volumes covered by the basis swap.<br />
Natural Gas Financial Basis Swap Contracts<br />
Weighted<br />
Average Price<br />
Volume Differential<br />
(MMBtud) ($/MMBtu)<br />
2010<br />
First Quarter (1) 65,000 $(1.72)<br />
Second Quarter 65,000 (2.56)<br />
Third Quarter 65,000 (3.17)<br />
Fourth Quarter 65,000 (3.73)<br />
2011<br />
First Quarter 65,000 $(1.89)<br />
(1) <strong>Inc</strong>ludes closed contracts for the month of January and February 2010.<br />
Financing<br />
2008.<br />
<strong>EOG</strong>'s debt-to-total capitalization ratio was 22% at December 31, <strong>2009</strong> compared to 17% at December 31,<br />
During <strong>2009</strong>, total debt increased $900 million to $2,797 million. The estimated fair value of <strong>EOG</strong>'s debt at<br />
December 31, <strong>2009</strong> and 2008 was $3,056 million and $1,933 million, respectively. The estimated fair value of debt<br />
was based upon quoted market prices and, where such prices were not available, upon interest rates available to <strong>EOG</strong><br />
at year-end. <strong>EOG</strong>'s debt is primarily at fixed interest rates. At December 31, <strong>2009</strong>, a 1% decline in interest rates<br />
would result in a $187 million increase in the estimated fair value of the fixed rate obligations. See Note 2 to<br />
Consolidated Financial Statements.<br />
During <strong>2009</strong>, <strong>EOG</strong> utilized cash provided by operating activities, proceeds from the offering of its 5.625%<br />
Senior Notes due 2019 described below, proceeds from asset sales and cash provided by borrowings from net<br />
commercial paper and other uncommitted credit facilities to fund its capital programs. While <strong>EOG</strong> maintains a $1.0<br />
billion commercial paper program, the maximum outstanding at any time during <strong>2009</strong> was $675 million, and the<br />
amount outstanding at year-end was zero. The maximum amount outstanding under uncommitted credit facilities<br />
during <strong>2009</strong> was $17 million with no amounts outstanding at year-end. <strong>EOG</strong> considers this excess availability,<br />
which is backed by the $1.0 billion unsecured Revolving Credit Agreement with domestic and foreign lenders<br />
described in Note 2 to Consolidated Financial Statements, to be ample to meet its ongoing operating needs.<br />
On May 21, <strong>2009</strong>, <strong>EOG</strong> completed its public offering of $900 million aggregate principal amount of<br />
5.625% Senior Notes due 2019 (2019 Notes). Interest on the 2019 Notes is payable semi-annually in arrears on June<br />
1 and December 1 of each year, beginning December 1, <strong>2009</strong>. Net proceeds from the offering of approximately<br />
$891 million were used for general corporate purposes, including repayment of outstanding commercial paper<br />
borrowings.<br />
38
On September 30, 2008, <strong>EOG</strong> completed its public offering of $400 million aggregate principal amount of<br />
6.125% Senior Notes due 2013 and $350 million aggregate principal amount of 6.875% Senior Notes due 2018<br />
(Notes). Interest on the Notes is payable semi-annually in arrears on April 1 and October 1 of each year, beginning<br />
April 1, <strong>2009</strong>. Net proceeds from the offering of approximately $743 million were used for general corporate<br />
purposes, including repayment of outstanding commercial paper and borrowings under other uncommitted credit<br />
facilities.<br />
Contractual Obligations<br />
The following table summarizes <strong>EOG</strong>'s contractual obligations at December 31, <strong>2009</strong> (in thousands):<br />
2015 &<br />
Contractual Obligations (1) Total 2010 2011 - 2012 2013 - 2014 Beyond<br />
Long-Term Debt $ 2,797,000 $ 37,000 $ 220,000 $ 550,000 $ 1,990,000<br />
Non-Cancelable Operating Leases 305,068 92,105 64,221 48,479 100,263<br />
Interest Payments on<br />
Long-Term Debt 1,313,300 166,693 317,145 273,683 555,779<br />
Pipeline Transportation Service<br />
Commitments (2) 2,583,090 247,460 610,542 603,375 1,121,713<br />
Drilling Rig Commitments (3) 181,615 158,302 23,313 - -<br />
Seismic Purchase Obligations 9,667 9,667 - - -<br />
Other Purchase Obligations 79,541 74,851 4,090 600 -<br />
Total Contractual Obligations $ 7,269,281 $ 786,078 $ 1,239,311 $ 1,476,137 $ 3,767,755<br />
(1) This table does not include the liability for unrecognized tax benefits, <strong>EOG</strong>'s pension or postretirement benefit obligations or<br />
liability for dismantlement, abandonment and asset retirement obligations (see Notes 5, 6 and 14, respectively, to Consolidated<br />
Financial Statements).<br />
(2) Amounts shown are based on current pipeline transportation rates and the foreign currency exchange rates used to convert<br />
Canadian dollars and British pounds into United States dollars at December 31, <strong>2009</strong>. Management does not believe that any<br />
future changes in these rates before the expiration dates of these commitments will have a material adverse effect on the financial<br />
condition or results of operations of <strong>EOG</strong>.<br />
(3) Amounts shown represent minimum future expenditures for drilling rig services. <strong>EOG</strong>'s expenditures for drilling rig services<br />
will exceed such minimum amounts to the extent <strong>EOG</strong> utilizes the drilling rigs subject to a particular contractual commitment<br />
for a period greater than the period set forth in the governing contract or if <strong>EOG</strong> utilizes drilling rigs in addition to the drilling<br />
rigs subject to the particular contractual commitment (for example, pursuant to the exercise of an option to utilize additional<br />
drilling rigs provided for in the governing contract).<br />
Off-Balance Sheet Arrangements<br />
<strong>EOG</strong> does not participate in financial transactions that generate relationships with unconsolidated entities or<br />
financial partnerships. Such entities or partnerships, often referred to as variable interest entities (VIE) or special<br />
purpose entities (SPE), are generally established for the purpose of facilitating off-balance sheet arrangements or<br />
other limited purposes. <strong>EOG</strong> was not involved in any unconsolidated VIE or SPE financial transactions or any other<br />
"off-balance sheet arrangement" (as defined in Item 303(a)(4)(ii) of Regulation S-K) during any of the periods<br />
covered by this report, and currently has no intention of participating in any such transaction or arrangement in the<br />
foreseeable future.<br />
39
Foreign Currency Exchange Rate Risk<br />
During <strong>2009</strong>, <strong>EOG</strong> was exposed to foreign currency exchange rate risk inherent in its operations in foreign<br />
countries, including Canada, Trinidad, the United Kingdom and China. The foreign currency most significant to<br />
<strong>EOG</strong>'s operations during <strong>2009</strong> was the Canadian dollar. The fluctuation of the Canadian dollar in <strong>2009</strong> impacted<br />
both the revenues and expenses of <strong>EOG</strong>'s Canadian subsidiaries. However, since Canadian commodity prices are<br />
largely correlated to United States prices, the changes in the Canadian currency exchange rate have less of an impact<br />
on the Canadian revenues than the Canadian expenses. <strong>EOG</strong> continues to monitor the foreign currency exchange<br />
rates of countries in which it is currently conducting business and may implement measures to protect against the<br />
foreign currency exchange rate risk.<br />
Effective March 9, 2004, <strong>EOG</strong> entered into a foreign currency swap transaction with multiple banks to<br />
eliminate exchange rate impacts that may result from the notes offered by one of its Canadian subsidiaries on the<br />
same date (see Note 2 to Consolidated Financial Statements). <strong>EOG</strong> accounts for the foreign currency swap<br />
transaction using the hedge accounting method, pursuant to the provisions of the Derivatives and Hedging Topic of<br />
the ASC. Under those provisions, as of December 31, <strong>2009</strong>, <strong>EOG</strong> recorded the fair value of the foreign currency<br />
swap of $49 million in Other Liabilities on the Consolidated Balance Sheets. Changes in the fair value of the foreign<br />
currency swap resulted in no net impact to Net <strong>Inc</strong>ome Available to Common Stockholders on the Consolidated<br />
Statements of <strong>Inc</strong>ome and Comprehensive <strong>Inc</strong>ome. The after-tax net impact from the foreign currency swap<br />
transaction resulted in a positive change of $5 million for the year ended December 31, <strong>2009</strong>. The change is<br />
included in Accumulated Other Comprehensive <strong>Inc</strong>ome in the Stockholders' Equity section of the Consolidated<br />
Balance Sheets.<br />
Outlook<br />
Pricing. Natural gas prices historically have been volatile, and this volatility is expected to continue.<br />
Uncertainty continues to exist as to the direction of future United States and Canada natural gas and crude oil price<br />
trends, and there remains a rather wide divergence in the opinions held by some in the industry. Being primarily a<br />
natural gas producer, <strong>EOG</strong> is more significantly impacted by changes in natural gas prices than by changes in crude oil<br />
and condensate or natural gas liquids prices. However, crude oil and condensate and natural gas liquids production<br />
comprised a larger portion of <strong>EOG</strong>'s production mix in <strong>2009</strong> than in prior years and is expected to comprise an even<br />
larger portion in 2010. Longer term natural gas prices will be determined by the supply of and demand for natural gas as<br />
well as the prices of competing fuels, such as crude oil and coal. The market price of natural gas and crude oil and<br />
condensate and natural gas liquids in 2010 will impact the amount of cash generated from operating activities, which<br />
will in turn impact the level of <strong>EOG</strong>'s 2010 total capital expenditures as well as its production.<br />
<strong>Inc</strong>luding the impact of <strong>EOG</strong>'s 2010 natural gas hedges, based on <strong>EOG</strong>'s tax position and the portion of <strong>EOG</strong>'s<br />
anticipated natural gas volumes for 2010 for which prices have not been determined under long-term marketing<br />
contracts, <strong>EOG</strong>'s price sensitivity for each $0.10 per Mcf change in wellhead natural gas price is approximately $30<br />
million for net income and $45 million for cash flows from operating activities. <strong>EOG</strong>'s price sensitivity in 2010 for each<br />
$1.00 per barrel change in wellhead crude oil and condensate price, combined with the related change in natural gas<br />
liquids price, is approximately $22 million for net income and $33 million for cash flows from operating activities. For<br />
information regarding <strong>EOG</strong>'s natural gas hedge position as of December 31, <strong>2009</strong>, see Note 11 to Consolidated<br />
Financial Statements.<br />
Capital. <strong>EOG</strong> plans to continue to focus a substantial portion of its exploration and development expenditures<br />
in its major producing areas in the United States and Canada. In order to diversify its overall asset portfolio, <strong>EOG</strong><br />
expects to conduct exploratory activity in other areas outside of the United States and Canada and will continue to<br />
evaluate the potential for involvement in additional exploitation-type opportunities.<br />
Management has not finalized or recommended to <strong>EOG</strong>'s Board a 2010 capital expenditures budget.<br />
Management continues to evaluate various factors impacting future natural gas and crude oil prices, including the<br />
quantities of natural gas in storage and North American natural gas supplies. In addition, <strong>EOG</strong> continues to evaluate<br />
certain potential exploration and development prospects. All of these factors and uncertainties impact future capital<br />
requirements. <strong>EOG</strong> expects to finalize a 2010 capital expenditures budget early in the second quarter. While <strong>EOG</strong><br />
currently anticipates an increase in its 2010 capital expenditures budget as compared to its <strong>2009</strong> budget, <strong>EOG</strong><br />
intends to maintain a strong balance sheet and a below average debt-to-capitalization ratio as compared to its peer<br />
group.<br />
40
Operations. <strong>EOG</strong> expects to increase overall production in 2010 by 13% over <strong>2009</strong> levels. Total United<br />
States production is expected to increase by 15%, comprised of an increase in crude oil and condensate and natural<br />
gas liquids production of 53% and 31%, respectively.<br />
Environmental Regulations<br />
Various foreign, federal, state and local laws and regulations covering the discharge of materials into the<br />
environment, or otherwise relating to the protection of the environment, affect <strong>EOG</strong>'s operations and costs as a result<br />
of their effect on natural gas and crude oil exploration, development and production operations. These laws and<br />
regulations could cause <strong>EOG</strong> to incur remediation or other corrective action costs in connection with a release of<br />
regulated substances, including crude oil, into the environment. In addition, <strong>EOG</strong> has acquired certain oil and gas<br />
properties from third parties whose actions with respect to the management and disposal or release of hydrocarbons<br />
or other wastes were not under <strong>EOG</strong>'s control, and under environmental laws and regulations, <strong>EOG</strong> could be<br />
required to remove or remediate wastes disposed of or released by prior owners or operators. <strong>EOG</strong> also could incur<br />
costs related to the clean-up of sites to which it sent regulated substances for disposal or to which it sent equipment<br />
for cleaning, and for damages to natural resources or other claims related to releases of regulated substances at such<br />
sites. In addition, <strong>EOG</strong> could be responsible under environmental laws and regulations for oil and gas properties in<br />
which <strong>EOG</strong> owns an interest but is not the operator. Moreover, <strong>EOG</strong> is subject to the United States Environmental<br />
Protection Agency's (U.S. EPA) rule requiring annual reporting of greenhouse gas (GHG) emissions.<br />
Compliance with such laws and regulations increases <strong>EOG</strong>'s overall cost of business, but has not had, to<br />
date, a material adverse effect on <strong>EOG</strong>'s operations, financial condition, results of operations or competitive position.<br />
It is not anticipated, based on current laws and regulations, that <strong>EOG</strong> will be required in the near future to expend<br />
amounts (whether for environmental control facilities or otherwise) that are material in relation to its total<br />
exploration and development expenditure program in order to comply with such laws and regulations, but, inasmuch<br />
as such laws and regulations are frequently changed, <strong>EOG</strong> is unable to predict the ultimate cost of compliance or the<br />
effect on <strong>EOG</strong>'s operations, financial condition, results of operations and competitive position.<br />
<strong>EOG</strong> is aware of the increasing focus of local, state, national and international regulatory bodies on GHG<br />
emissions and climate change issues. In addition to the U.S. EPA's rule requiring annual reporting of GHG<br />
emissions, <strong>EOG</strong> is also aware of legislation proposed by United States lawmakers and the Canadian legislature to<br />
reduce GHG emissions, as well as GHG emissions regulations enacted by certain of the Canadian provinces in which<br />
<strong>EOG</strong> operates. <strong>EOG</strong> is unable to predict the timing, scope and effect of any such proposed laws, regulations and<br />
treaties, but the direct and indirect costs of such laws, regulations and treaties (if enacted) could materially and adversely<br />
affect <strong>EOG</strong>'s business, results of operations, financial condition and competitive position.<br />
<strong>EOG</strong> believes that its strategy to reduce GHG emissions throughout its operations is in the best interest of<br />
the environment and a generally good business practice. <strong>EOG</strong> will continue to review the risks to its business and<br />
operations associated with all environmental matters, including climate change. In addition, <strong>EOG</strong> will continue to<br />
monitor and assess any new policies, legislation or regulations in the areas where it operates to determine the impact<br />
on its operations and take appropriate actions, where necessary.<br />
41
Summary of Critical Accounting Policies<br />
<strong>EOG</strong> prepares its financial statements and the accompanying notes in conformity with accounting principles<br />
generally accepted in the United States of America, which requires management to make estimates and assumptions<br />
about future events that affect the reported amounts in the financial statements and the accompanying notes. <strong>EOG</strong><br />
identifies certain accounting policies as critical based on, among other things, their impact on the portrayal of <strong>EOG</strong>'s<br />
financial condition, results of operations or liquidity, and the degree of difficulty, subjectivity and complexity in their<br />
deployment. Critical accounting policies cover accounting matters that are inherently uncertain because the future<br />
resolution of such matters is unknown. Management routinely discusses the development, selection and disclosure of<br />
each of the critical accounting policies. Following is a discussion of <strong>EOG</strong>'s most critical accounting policies:<br />
Proved Oil and Gas Reserves<br />
<strong>EOG</strong>'s engineers estimate proved oil and gas reserves, which directly impact financial accounting estimates,<br />
including depreciation, depletion and amortization. Proved reserves represent estimated quantities of natural gas,<br />
crude oil and condensate and natural gas liquids that geological and engineering data demonstrate, with reasonable<br />
certainty, to be recoverable in future years from known reservoirs under economic and operating conditions existing<br />
at the time the estimates were made. The process of estimating quantities of proved oil and gas reserves is very<br />
complex, requiring significant subjective decisions in the evaluation of all available geological, engineering and<br />
economic data for each reservoir. The data for a given reservoir may also change substantially over time as a result<br />
of numerous factors including, but not limited to, additional development activity, evolving production history and<br />
continual reassessment of the viability of production under varying economic conditions. Consequently, material<br />
revisions (upward or downward) to existing reserve estimates may occur from time to time.<br />
Oil and Gas Exploration Costs<br />
<strong>EOG</strong> accounts for its natural gas and crude oil exploration and production activities under the successful<br />
efforts method of accounting. Oil and gas exploration costs, other than the costs of drilling exploratory wells, are<br />
charged to expense as incurred. The costs of drilling exploratory wells are capitalized pending determination of<br />
whether <strong>EOG</strong> has discovered proved commercial reserves. Exploratory drilling costs are capitalized when drilling is<br />
complete if it is determined that there is economic producibility supported by either actual production, a conclusive<br />
formation test or by certain technical data if the discovery is located offshore. If proved commercial reserves are not<br />
discovered, such drilling costs are expensed. In some circumstances, it may be uncertain whether proved<br />
commercial reserves have been found when drilling has been completed. Such exploratory well drilling costs may<br />
continue to be capitalized if the reserve quantity is sufficient to justify its completion as a producing well and<br />
sufficient progress in assessing the reserves and the economic and operating viability of the project is being made. As<br />
of December 31, <strong>2009</strong> and 2008, <strong>EOG</strong> had exploratory drilling costs related to projects that have been deferred for<br />
more than one year (see Note 16 to Consolidated Financial Statements). These costs meet the accounting<br />
requirements outlined above for continued capitalization. Costs to develop proved reserves, including the costs of<br />
all development wells and related equipment used in the production of natural gas and crude oil, are capitalized.<br />
Depreciation, Depletion and Amortization for Oil and Gas Properties<br />
The quantities of estimated proved oil and gas reserves are a significant component of our calculation of<br />
depletion expense and revisions in such estimates may alter the rate of future expense. Holding all other factors<br />
constant, if reserves were revised upward or downward, earnings would increase or decrease respectively.<br />
Depreciation, depletion and amortization of the cost of proved oil and gas properties is calculated using the<br />
unit-of-production method. The reserve base used to calculate depreciation, depletion and amortization for leasehold<br />
acquisition costs and the cost to acquire proved properties is the sum of proved developed reserves and proved<br />
undeveloped reserves. With respect to lease and well equipment costs, which include development costs and successful<br />
exploration drilling costs, the reserve base includes only proved developed reserves. Estimated future dismantlement,<br />
restoration and abandonment costs, net of salvage values, are taken into account. Certain other assets, including natural<br />
gas gathering and processing facilities, are depreciated on a straight-line basis over the estimated useful life of the asset.<br />
Assets are grouped in accordance with the provisions of the Extractive Industries - Oil and Gas Topic of the<br />
ASC. The basis for grouping is a reasonable aggregation of properties with a common geological structural feature or<br />
stratigraphic condition, such as a reservoir or field.<br />
42
Amortization rates are updated quarterly to reflect: 1) the addition of capital costs, 2) reserve revisions<br />
(upwards or downwards) and additions, 3) property acquisitions and/or property dispositions and 4) impairments.<br />
Impairments<br />
Oil and gas lease acquisition costs are capitalized when incurred. Unproved properties with individually<br />
significant acquisition costs are amortized over the lease term and analyzed on a property-by-property basis for any<br />
impairment in value. Unproved properties with acquisition costs that are not individually significant are aggregated,<br />
and the portion of such costs estimated to be nonproductive is amortized over the remaining lease term. If the<br />
unproved properties are determined to be productive, the appropriate related costs are transferred to proved oil and<br />
gas properties. Lease rentals are expensed as incurred.<br />
When circumstances indicate that a proved property may be impaired, <strong>EOG</strong> compares expected<br />
undiscounted future cash flows at a producing field level to the unamortized capitalized cost of the asset. If the future<br />
undiscounted cash flows, based on <strong>EOG</strong>'s estimate of future natural gas and crude oil prices, operating costs,<br />
anticipated production from proved reserves and other relevant data, are lower than the unamortized capitalized cost,<br />
the capitalized cost is reduced to fair value. Fair value is calculated by discounting the future cash flows at an<br />
appropriate risk-adjusted discount rate.<br />
Stock-Based Compensation<br />
In accounting for stock-based compensation, judgments and estimates are made regarding, among other<br />
things, the appropriate valuation methodology to follow in valuing stock compensation awards and the related inputs<br />
required by those valuation methodologies. Assumptions regarding expected volatility of <strong>EOG</strong>'s common stock, the<br />
level of risk-free interest rates, expected dividend yields on <strong>EOG</strong>'s stock, the expected term of the awards and other<br />
valuation inputs are subject to change. Any such changes could result in different valuations and thus impact the<br />
amount of stock-based compensation expense recognized in the Consolidated Statements of <strong>Inc</strong>ome and<br />
Comprehensive <strong>Inc</strong>ome.<br />
Information Regarding Forward-Looking Statements<br />
This <strong>Annual</strong> <strong>Report</strong> on Form 10-K includes forward-looking statements within the meaning of Section 27A<br />
of the Securities Act of 1933, as amended, and Section 21E of the Securities Exchange Act of 1934, as amended.<br />
All statements, other than statements of historical facts, including, among others, statements and projections<br />
regarding <strong>EOG</strong>'s future financial position, operations, performance, business strategy, returns, budgets, reserves,<br />
levels of production and costs and statements regarding the plans and objectives of <strong>EOG</strong>'s management for future<br />
operations, are forward-looking statements. <strong>EOG</strong> typically uses words such as "expect," "anticipate," "estimate,"<br />
"project," "strategy," "intend," "plan," "target," "goal," "may," "will" and "believe" or the negative of those terms or<br />
other variations or comparable terminology to identify its forward-looking statements. In particular, statements,<br />
express or implied, concerning <strong>EOG</strong>'s future operating results and returns or <strong>EOG</strong>'s ability to replace or increase<br />
reserves, increase production or generate income or cash flows are forward-looking statements. Forward-looking<br />
statements are not guarantees of performance. Although <strong>EOG</strong> believes the expectations reflected in its forwardlooking<br />
statements are reasonable and are based on reasonable assumptions, no assurance can be given that these<br />
assumptions are accurate or that any of these expectations will be achieved (in full or at all) or will prove to have<br />
been correct. Moreover, <strong>EOG</strong>'s forward-looking statements may be affected by known and unknown risks, events or<br />
circumstances that may be outside <strong>EOG</strong>'s control. Important factors that could cause <strong>EOG</strong>'s actual results to differ<br />
materially from the expectations reflected in <strong>EOG</strong>'s forward-looking statements include, among others:<br />
the timing and extent of changes in prices for natural gas, crude oil and related commodities;<br />
changes in demand for natural gas, crude oil and related commodities, including ammonia and methanol;<br />
the extent to which <strong>EOG</strong> is successful in its efforts to discover and market reserves and to acquire natural<br />
gas and crude oil properties;<br />
the extent to which <strong>EOG</strong> can optimize reserve recovery and economically develop its plays utilizing<br />
horizontal and vertical drilling and advanced completion technologies;<br />
43
the extent to which <strong>EOG</strong> is successful in its efforts to economically develop its acreage in, and to produce<br />
reserves and achieve anticipated production levels from, its existing and future natural gas and crude oil<br />
exploration and development projects, given the risks and uncertainties inherent in drilling, completing and<br />
operating natural gas and crude oil wells and the potential for interruptions of production, whether<br />
involuntary or intentional as a result of market or other conditions;<br />
the availability, proximity and capacity of, and costs associated with, gathering, processing, compression<br />
and transportation facilities;<br />
the availability, cost, terms and timing of issuance or execution of, and competition for, mineral licenses<br />
and leases and governmental and other permits and rights of way;<br />
changes in government policies, laws and regulations, including environmental and tax laws and<br />
regulations;<br />
competition in the oil and gas exploration and production industry for employees and other personnel,<br />
equipment, materials and services and, related thereto, the availability and cost of employees and other<br />
personnel, equipment, materials and services;<br />
<strong>EOG</strong>'s ability to obtain access to surface locations for drilling and production facilities;<br />
the extent to which <strong>EOG</strong>'s third-party-operated natural gas and crude oil properties are operated<br />
successfully and economically;<br />
<strong>EOG</strong>'s ability to effectively integrate acquired natural gas and crude oil properties into its operations, fully<br />
identify existing and potential problems with respect to such properties and accurately estimate reserves,<br />
production and costs with respect to such properties;<br />
weather, including its impact on natural gas and crude oil demand, and weather-related delays in drilling<br />
and in the installation and operation of production, gathering, processing, compression and transportation<br />
facilities;<br />
the ability of <strong>EOG</strong>'s customers and other contractual counterparties to satisfy their obligations to <strong>EOG</strong> and,<br />
related thereto, to access the credit and capital markets to obtain financing needed to satisfy their<br />
obligations to <strong>EOG</strong>;<br />
<strong>EOG</strong>'s ability to access the commercial paper market and other credit and capital markets to obtain<br />
financing on terms it deems acceptable, if at all;<br />
the accuracy of reserve estimates, which by their nature involve the exercise of professional judgment and<br />
may therefore be imprecise;<br />
the timing and extent of changes in foreign currency exchange rates, interest rates, inflation rates, global and<br />
domestic financial market conditions and global and domestic general economic conditions;<br />
political developments around the world, including in the areas in which <strong>EOG</strong> operates;<br />
the extent and effect of any hedging activities engaged in by <strong>EOG</strong>;<br />
the timing and impact of liquefied natural gas imports;<br />
the use of competing energy sources and the development of alternative energy sources;<br />
the extent to which <strong>EOG</strong> incurs uninsured losses and liabilities;<br />
acts of war and terrorism and responses to these acts; and<br />
the other factors described under Item 1A, "Risk Factors," on pages 14 through 19 of this <strong>Annual</strong> <strong>Report</strong> on<br />
Form 10-K and any updates to those factors set forth in <strong>EOG</strong>'s subsequent Quarterly <strong>Report</strong>s on Form 10-Q.<br />
In light of these risks, uncertainties and assumptions, the events anticipated by <strong>EOG</strong>'s forward-looking<br />
statements may not occur, and, if any of such events do, we may not have anticipated the timing of their occurrence<br />
or the extent of their impact on our actual results. Accordingly, you should not place any undue reliance on any of<br />
<strong>EOG</strong>'s forward-looking statements. <strong>EOG</strong>'s forward-looking statements speak only as of the date made and <strong>EOG</strong><br />
undertakes no obligation, other than as required by applicable law, to update or revise its forward-looking<br />
statements, whether as a result of new information, subsequent events, anticipated or unanticipated circumstances or<br />
otherwise.<br />
ITEM 7A. Quantitative and Qualitative Disclosures About Market Risk<br />
The information required by this Item is incorporated by reference from Item 7 of this report, specifically<br />
the information set forth under the captions "Derivative Transactions," "Financing," "Foreign Currency Exchange<br />
Rate Risk" and "Outlook" in "Management's Discussion and Analysis of Financial Condition and Results of<br />
Operations - Capital <strong>Resources</strong> and Liquidity."<br />
44
ITEM 8. Financial Statements and Supplementary Data<br />
The information required by this Item is included in this report as set forth in the "Index to Financial<br />
Statements" on page F-1 and is incorporated by reference herein.<br />
ITEM 9. Changes in and Disagreements with Accountants on Accounting and Financial Disclosure<br />
None.<br />
ITEM 9A. Controls and Procedures<br />
Disclosure Controls and Procedures. <strong>EOG</strong>'s management, with the participation of <strong>EOG</strong>'s principal<br />
executive officer and principal financial officer, evaluated the effectiveness of <strong>EOG</strong>'s disclosure controls and<br />
procedures (as defined in Rules 13a-15(e) and 15d-15(e) promulgated under the Securities Exchange Act of 1934, as<br />
amended (Exchange Act)) as of December 31, <strong>2009</strong>. Based on this evaluation, <strong>EOG</strong>'s principal executive officer<br />
and principal financial officer have concluded that <strong>EOG</strong>'s disclosure controls and procedures were effective as of<br />
December 31, <strong>2009</strong> in ensuring that information that is required to be disclosed by <strong>EOG</strong> in the reports it files or<br />
submits under the Exchange Act is (i) recorded, processed, summarized and reported, within the time periods<br />
specified in the Securities and Exchange Commission's rules and forms and (ii) accumulated and communicated to<br />
<strong>EOG</strong>'s management as appropriate to allow timely decisions regarding required disclosure.<br />
Management's <strong>Annual</strong> <strong>Report</strong> on Internal Control over Financial <strong>Report</strong>ing. <strong>EOG</strong>'s management is<br />
responsible for establishing and maintaining adequate internal control over financial reporting (as defined in Rules<br />
13a-15(f) and 15d-15(f) promulgated under the Exchange Act). Even an effective system of internal control over<br />
financial reporting, no matter how well designed, has inherent limitations, including the possibility of human error,<br />
circumvention of controls or overriding of controls and, therefore, can provide only reasonable assurance with<br />
respect to reliable financial reporting. Furthermore, the effectiveness of a system of internal control over financial<br />
reporting in future periods can change as conditions change.<br />
<strong>EOG</strong>'s management assessed the effectiveness of <strong>EOG</strong>'s internal control over financial reporting as of<br />
December 31, <strong>2009</strong>. In making this assessment, it used the criteria set forth by the Committee of Sponsoring<br />
Organizations of the Treadway Commission (COSO) in Internal Control - Integrated Framework. Based on this<br />
assessment and such criteria, <strong>EOG</strong>'s management believes that <strong>EOG</strong>'s internal control over financial reporting was<br />
effective as of December 31, <strong>2009</strong>. See also "Management's Responsibility for Financial <strong>Report</strong>ing" appearing on<br />
page F-2 of this report, which is incorporated herein by reference.<br />
The report of <strong>EOG</strong>'s independent registered public accounting firm relating to the consolidated financial<br />
statements, financial statement schedules and effectiveness of internal control over financial reporting is set forth on<br />
page F-3 of this report.<br />
There were no changes in <strong>EOG</strong>'s internal control over financial reporting that occurred during the quarter<br />
ended December 31, <strong>2009</strong> that have materially affected, or are reasonably likely to materially affect, <strong>EOG</strong>'s internal<br />
control over financial reporting.<br />
ITEM 9B. Other Information<br />
None.<br />
45
PART III<br />
ITEM 10. Directors, Executive Officers and Corporate Governance<br />
The information required by this Item is incorporated by reference from (i) <strong>EOG</strong>'s Definitive Proxy Statement<br />
with respect to its 2010 <strong>Annual</strong> Meeting of Stockholders to be filed not later than April 30, 2010 and (ii) Item 1 of this<br />
report, specifically the information therein set forth under the caption "Executive Officers of the Registrant."<br />
Pursuant to Rule 303A.10 of the New York Stock Exchange and Item 406 of Regulation S-K promulgated<br />
under the Securities Exchange Act of 1934, as amended, <strong>EOG</strong> has adopted a Code of Business Conduct and Ethics<br />
(Code of Conduct) that applies to all <strong>EOG</strong> directors, officers and employees, including <strong>EOG</strong>'s principal executive officer<br />
and principal financial and accounting officer. <strong>EOG</strong> has also adopted a Code of Ethics for Senior Financial Officers<br />
(Code of Ethics) that, along with <strong>EOG</strong>'s Code of Conduct, applies to <strong>EOG</strong>'s principal executive officer, principal<br />
financial and accounting officer and controllers.<br />
You can access the Code of Conduct and Code of Ethics on the Corporate Governance page under Investors on<br />
<strong>EOG</strong>'s website at www.eogresources.com, and any <strong>EOG</strong> stockholder who so requests may obtain a printed copy of the<br />
Code of Conduct and Code of Ethics by submitting a written request to <strong>EOG</strong>'s Corporate Secretary.<br />
<strong>EOG</strong> intends to disclose any amendments to the Code of Conduct or Code of Ethics, and any waivers with<br />
respect to the Code of Conduct or Code of Ethics granted to <strong>EOG</strong>'s principal executive officer, principal financial and<br />
accounting officer, any of our controllers or any of our other employees performing similar functions, on its website at<br />
www.eogresources.com within four business days of the amendment or waiver. In such case, the disclosure regarding<br />
the amendment or waiver will remain available on <strong>EOG</strong>'s website for at least 12 months after the initial disclosure.<br />
There have been no waivers granted with respect to <strong>EOG</strong>'s Code of Conduct or Code of Ethics.<br />
ITEM 11. Executive Compensation<br />
The information required by this Item is incorporated by reference from <strong>EOG</strong>'s Definitive Proxy Statement<br />
with respect to its 2010 <strong>Annual</strong> Meeting of Stockholders to be filed not later than April 30, 2010. The Compensation<br />
Committee <strong>Report</strong> and related information incorporated by reference herein shall not be deemed "soliciting material"<br />
or to be "filed" with the United States Securities and Exchange Commission, nor shall such information be<br />
incorporated by reference into any future filing under the Securities Act of 1933, as amended, or Securities Exchange<br />
Act of 1934, as amended, except to the extent that <strong>EOG</strong> specifically incorporates such information by reference into<br />
such a filing.<br />
ITEM 12. Security Ownership of Certain Beneficial Owners and Management and Related Stockholder Matters<br />
The information required by this Item with respect to security ownership of certain beneficial owners and<br />
management is incorporated by reference from <strong>EOG</strong>'s Definitive Proxy Statement with respect to its 2010 <strong>Annual</strong><br />
Meeting of Stockholders to be filed not later than April 30, 2010.<br />
Equity Compensation Plan Information<br />
Stock Plans Approved by <strong>EOG</strong> Stockholders. <strong>EOG</strong>'s stockholders approved the <strong>EOG</strong> <strong>Resources</strong>, <strong>Inc</strong>. 2008<br />
Omnibus Equity Compensation Plan (2008 Plan) at the 2008 <strong>Annual</strong> Meeting of Stockholders in May 2008. The<br />
2008 Plan provides for grants of stock options, stock-settled stock appreciation rights (SARs), restricted stock,<br />
restricted stock units and other stock-based awards, up to an aggregate maximum of 6.0 million shares of common<br />
stock, plus shares underlying forfeited or cancelled grants under <strong>EOG</strong>'s prior stock plans referenced below. Under<br />
the 2008 Plan, grants may be made to employees and non-employee members of <strong>EOG</strong>'s Board of Directors (Board).<br />
The 2008 Plan, the 1992 Stock Plan, the 1993 Nonemployee Directors Stock Option Plan and the Employee Stock<br />
Purchase Plan have been approved by <strong>EOG</strong>'s stockholders. Plans that have not been approved by <strong>EOG</strong>'s<br />
stockholders are described below.<br />
46
Stock Plans Not Approved by <strong>EOG</strong> Stockholders. The Board approved the 1994 Stock Plan, which<br />
provides equity compensation to employees who are not officers within the meaning of Rule 16a-1 of the Securities<br />
Exchange Act of 1934, as amended. Under the 1994 Stock Plan, employees have been granted stock options (rights<br />
to purchase shares of <strong>EOG</strong> common stock at a price not less than the market price of the stock on the date of grant).<br />
These stock options vest on a graded vesting schedule up to four years from the date of grant based on the nature of<br />
the grants and as defined in individual grant agreements. Terms for stock options granted under the 1994 Stock Plan<br />
have not exceeded a maximum term of 10 years. Employees have also been granted shares of restricted stock and/or<br />
restricted stock units under the 1994 Stock Plan without cost to the employee. The shares and units granted vest up<br />
to five years after the date of grant as defined in individual grant agreements. Restricted shares, upon vesting, are<br />
released to the employee. Each restricted stock unit, upon vesting, is converted into one share of <strong>EOG</strong> common<br />
stock and released to the employee. Upon the effective date of the 2008 Plan, no further grants were made under the<br />
1994 Stock Plan.<br />
In December 2008, the Board approved the amendment and continuation of the 1996 Deferral Plan as the<br />
"<strong>EOG</strong> <strong>Resources</strong>, <strong>Inc</strong>. 409A Deferred Compensation Plan" (Deferral Plan). Under the Deferral Plan, payment of up<br />
to 50% of base salary, 100% of annual cash bonus, directors fees and 401(k) refunds resulting from excess deferrals<br />
in the <strong>EOG</strong> Savings Plan may be deferred into a phantom stock account. In the phantom stock account, deferrals are<br />
treated as if shares of <strong>EOG</strong> common stock were purchased at the closing stock price on the date of deferral.<br />
Dividends are credited quarterly and treated as if reinvested in <strong>EOG</strong> common stock. Payment of the phantom stock<br />
account is made in actual shares of <strong>EOG</strong> common stock in accordance with the Deferral Plan and the individual's<br />
deferral election. A total of 120,000 shares have been registered for issuance under the Deferral Plan. As of<br />
December 31, <strong>2009</strong>, 104,883 phantom shares had been issued.<br />
The following table sets forth data for <strong>EOG</strong>'s equity compensation plans aggregated by the various plans<br />
approved by <strong>EOG</strong>'s stockholders and those plans not approved by <strong>EOG</strong>'s stockholders as of December 31, <strong>2009</strong>.<br />
(c)<br />
Number of Securities<br />
(a) (b) Remaining Available<br />
Number of Securities to be Weighted-Average for Future Issuance Under<br />
Issued Upon Exercise of Exercise Price of Equity Compensation<br />
Outstanding Options, Outstanding Options, Plans (Excluding Securities<br />
Plan Category Warrants and Rights Warrants and Rights Reflected in Column (a))<br />
Equity Compensation<br />
Plans Approved by<br />
<strong>EOG</strong> Stockholders 10,395,723 $68.25<br />
(1) (2)<br />
2,260,836<br />
Equity Compensation<br />
Plans Not Approved<br />
by <strong>EOG</strong> Stockholders 1,648,349 $22.40 15,117 (3)<br />
Total 12,044,072 $61.97 2,275,953<br />
(1) Of these securities, 38,602 shares remain available for purchase under the Employee Stock Purchase Plan.<br />
(2) Of these securities, 769,010 could be issued as restricted stock or restricted stock units under the 2008 Plan.<br />
(3) Represents 15,117 shares that remain available for issuance under the Deferral Plan (as described below). See the related<br />
discussion below regarding the amendment and continuation of the 1996 Deferral Plan.<br />
ITEM 13. Certain Relationships and Related Transactions, and Director Independence<br />
The information required by this Item is incorporated by reference from <strong>EOG</strong>'s Definitive Proxy Statement<br />
with respect to its 2010 <strong>Annual</strong> Meeting of Stockholders to be filed not later than April 30, 2010.<br />
ITEM 14. Principal Accounting Fees and Services<br />
The information required by this Item is incorporated by reference from <strong>EOG</strong>'s Definitive Proxy Statement<br />
with respect to its 2010 <strong>Annual</strong> Meeting of Stockholders to be filed not later than April 30, 2010.<br />
47
PART IV<br />
ITEM 15. Exhibits, Financial Statement Schedules<br />
(a)(1) and (a)(2) Financial Statements and Financial Statement Schedule<br />
See "Index to Financial Statements" set forth on page F-1.<br />
(a)(3), (b) Exhibits<br />
See pages E-1 through E-6 for a listing of the exhibits.<br />
48
<strong>EOG</strong> RESOURCES, INC.<br />
INDEX TO FINANCIAL STATEMENTS<br />
Page<br />
Consolidated Financial Statements:<br />
Management's Responsibility for Financial <strong>Report</strong>ing F-2<br />
<strong>Report</strong> of Independent Registered Public Accounting Firm F-3<br />
Consolidated Statements of <strong>Inc</strong>ome and Comprehensive <strong>Inc</strong>ome for Each of the Three Years<br />
in the Period Ended December 31, <strong>2009</strong> F-5<br />
Consolidated Balance Sheets - December 31, <strong>2009</strong> and 2008 F-6<br />
Consolidated Statements of Stockholders' Equity for Each of the Three Years in the<br />
Period Ended December 31, <strong>2009</strong> F-7<br />
Consolidated Statements of Cash Flows for Each of the Three Years in the Period Ended<br />
December 31, <strong>2009</strong> F-8<br />
Notes to Consolidated Financial Statements F-9<br />
Supplemental Information to Consolidated Financial Statements F-33<br />
Financial Statement Schedule:<br />
Schedule II-Valuation and Qualifying Accounts S-1<br />
Other financial statement schedules have been omitted because they are inapplicable or the information required therein<br />
is included elsewhere in the consolidated financial statements or notes thereto.<br />
F-1
MANAGEMENT'S RESPONSIBILITY FOR FINANCIAL REPORTING<br />
The following consolidated financial statements of <strong>EOG</strong> <strong>Resources</strong>, <strong>Inc</strong>., together with its subsidiaries<br />
(collectively, <strong>EOG</strong>), were prepared by management, which is responsible for the integrity, objectivity and fair<br />
presentation of such financial statements. The statements have been prepared in conformity with generally accepted<br />
accounting principles in the United States of America and, accordingly, include some amounts that are based on the best<br />
estimates and judgments of management.<br />
<strong>EOG</strong>'s management is also responsible for establishing and maintaining adequate internal control over financial<br />
reporting. The system of internal control of <strong>EOG</strong> is designed to provide reasonable assurance regarding the reliability of<br />
financial reporting and the preparation of financial statements for external purposes in accordance with generally<br />
accepted accounting principles in the United States of America. This system consists of 1) entity level controls,<br />
including written policies and guidelines relating to the ethical conduct of business affairs, 2) general computer controls<br />
and 3) process controls over initiating, authorizing, recording, processing and reporting transactions. Even an effective<br />
internal control system, no matter how well designed, has inherent limitations, including the possibility of human error,<br />
circumvention of controls or overriding of controls and, therefore, can provide only reasonable assurance with respect to<br />
reliable financial reporting. Furthermore, the effectiveness of a system of internal control over financial reporting in<br />
future periods can change as conditions change.<br />
The adequacy of <strong>EOG</strong>'s financial controls and the accounting principles employed by <strong>EOG</strong> in its financial<br />
reporting are under the general oversight of the Audit Committee of the Board of Directors. No member of this<br />
committee is an officer or employee of <strong>EOG</strong>. Moreover, <strong>EOG</strong>'s independent registered public accounting firm and<br />
internal auditors have full, free, separate and direct access to the Audit Committee and meet with the committee from<br />
time to time to discuss accounting, auditing and financial reporting matters.<br />
<strong>EOG</strong>'s management assessed the effectiveness of <strong>EOG</strong>'s internal control over financial reporting as of<br />
December 31, <strong>2009</strong>. In making this assessment, we used the criteria set forth by the Committee of Sponsoring<br />
Organizations of the Treadway Commission (COSO) in Internal Control - Integrated Framework. These criteria cover<br />
the control environment, risk assessment process, control activities, information and communication systems, and<br />
monitoring activities. Based on this assessment and those criteria, management believes that <strong>EOG</strong> maintained effective<br />
internal control over financial reporting as of December 31, <strong>2009</strong>.<br />
Deloitte & Touche LLP, independent registered public accounting firm, was engaged to audit the consolidated<br />
financial statements of <strong>EOG</strong> and to issue a report thereon. In the conduct of the audit, Deloitte & Touche LLP was<br />
given unrestricted access to all financial records and related data, including minutes of all meetings of stockholders, the<br />
Board of Directors and committees of the Board. Management believes that all representations made to Deloitte &<br />
Touche LLP during the audit were valid and appropriate. Their audit was made in accordance with standards of the<br />
Public Company Accounting Oversight Board (United States) and included a review of <strong>EOG</strong>'s system of internal<br />
controls to the extent considered necessary to determine the audit procedures required to support their opinion on <strong>EOG</strong>'s<br />
consolidated financial statements and the effectiveness of <strong>EOG</strong>'s internal control over financial reporting. Their report<br />
begins on page F-3.<br />
MARK G. PAPA<br />
Chairman of the Board and<br />
Chief Executive Officer<br />
TIMOTHY K. DRIGGERS<br />
Vice President and Chief<br />
Financial Officer<br />
Houston, Texas<br />
February 25, 2010<br />
F-2
REPORT OF INDEPENDENT REGISTERED PUBLIC ACCOUNTING FIRM<br />
To the Board of Directors and Stockholders of<br />
<strong>EOG</strong> <strong>Resources</strong>, <strong>Inc</strong>.<br />
Houston, Texas<br />
We have audited the accompanying consolidated balance sheets of <strong>EOG</strong> <strong>Resources</strong>, <strong>Inc</strong>. and subsidiaries (the<br />
"Company") as of December 31, <strong>2009</strong> and 2008, and the related consolidated statements of income and<br />
comprehensive income, stockholders' equity, and cash flows for each of the three years in the period ended<br />
December 31, <strong>2009</strong>. Our audits also included the financial statement schedule listed in the Index at Item 15. We<br />
also have audited the Company's internal control over financial reporting as of December 31, <strong>2009</strong>, based on criteria<br />
established in Internal Control - Integrated Framework issued by the Committee of Sponsoring Organizations of the<br />
Treadway Commission. The Company's management is responsible for these financial statements and financial<br />
statement schedule, for maintaining effective internal control over financial reporting, and for its assessment of the<br />
effectiveness of internal control over financial reporting, included in the accompanying Management's <strong>Annual</strong><br />
<strong>Report</strong> on Internal Control over Financial <strong>Report</strong>ing. Our responsibility is to express an opinion on these financial<br />
statements and financial statement schedule and an opinion on the Company's internal control over financial<br />
reporting based on our audits.<br />
We conducted our audits in accordance with the standards of the Public Company Accounting Oversight Board<br />
(United States). Those standards require that we plan and perform the audit to obtain reasonable assurance about<br />
whether the financial statements are free of material misstatement and whether effective internal control over<br />
financial reporting was maintained in all material respects. Our audits of the financial statements included<br />
examining, on a test basis, evidence supporting the amounts and disclosures in the financial statements, assessing the<br />
accounting principles used and significant estimates made by management, and evaluating the overall financial<br />
statement presentation. Our audit of internal control over financial reporting included obtaining an understanding of<br />
internal control over financial reporting, assessing the risk that a material weakness exists, and testing and evaluating<br />
the design and operating effectiveness of internal control based on the assessed risk. Our audits also included<br />
performing such other procedures as we considered necessary in the circumstances. We believe that our audits<br />
provide a reasonable basis for our opinions.<br />
A company's internal control over financial reporting is a process designed by, or under the supervision of, the<br />
company's principal executive and principal financial officers, or persons performing similar functions, and effected<br />
by the company's board of directors, management, and other personnel to provide reasonable assurance regarding the<br />
reliability of financial reporting and the preparation of financial statements for external purposes in accordance with<br />
generally accepted accounting principles. A company's internal control over financial reporting includes those<br />
policies and procedures that (1) pertain to the maintenance of records that, in reasonable detail, accurately and fairly<br />
reflect the transactions and dispositions of the assets of the company; (2) provide reasonable assurance that<br />
transactions are recorded as necessary to permit preparation of financial statements in accordance with generally<br />
accepted accounting principles and that receipts and expenditures of the company are being made only in accordance<br />
with authorizations of management and directors of the company; and (3) provide reasonable assurance regarding<br />
prevention or timely detection of unauthorized acquisition, use, or disposition of the company's assets that could<br />
have a material effect on the financial statements.<br />
Because of the inherent limitations of internal control over financial reporting, including the possibility of collusion<br />
or improper management override of controls, material misstatements due to error or fraud may not be prevented or<br />
detected on a timely basis. Also, projections of any evaluation of the effectiveness of the internal control over<br />
financial reporting to future periods are subject to the risk that the controls may become inadequate because of<br />
changes in conditions, or that the degree of compliance with the policies or procedures may deteriorate.<br />
F-3
In our opinion, the consolidated financial statements referred to above present fairly, in all material respects, the<br />
financial position of the <strong>EOG</strong> <strong>Resources</strong>, <strong>Inc</strong>. and subsidiaries as of December 31, <strong>2009</strong> and 2008, and the results of<br />
their operations and their cash flows for each of the three years in the period ended December 31, <strong>2009</strong>, in<br />
conformity with accounting principles generally accepted in the United States of America. Also, in our opinion, such<br />
financial statement schedule, when considered in relation to the basic consolidated financial statements taken as a<br />
whole, present fairly, in all material respects, the information set forth therein. Also, in our opinion, the Company<br />
maintained, in all material respects, effective internal control over financial reporting as of December 31, <strong>2009</strong>,<br />
based on the criteria established in Internal Control - Integrated Framework issued by the Committee of Sponsoring<br />
Organizations of the Treadway Commission.<br />
As discussed in Note 1 to the consolidated financial statements, on December 31, <strong>2009</strong>, the Company adopted<br />
Accounting Standards Update No. 2010-3, "Oil and Gas Reserve Estimation and Disclosures."<br />
DELOITTE & TOUCHE LLP<br />
Houston, Texas<br />
February 25, 2010<br />
F-4
<strong>EOG</strong> RESOURCES, INC.<br />
CONSOLIDATED STATEMENTS OF INCOME AND COMPREHENSIVE INCOME<br />
(In Thousands, Except Per Share Data)<br />
Year Ended December 31 <strong>2009</strong> 2008 2007<br />
Net Operating Revenues<br />
Natural Gas $ 2,050,963 $ 4,452,058 $ 3,032,805<br />
Crude Oil, Condensate and Natural Gas Liquids 1,348,510 1,769,926 987,523<br />
Gains on Mark-to-Market Commodity Derivative Contracts 431,757 597,911 93,108<br />
Gathering, Processing and Marketing 407,116 164,535 73,539<br />
Gains on Property Dispositions, Net 535,436 123,473 43,628<br />
Other, Net 13,177 19,240 8,700<br />
Total 4,786,959 7,127,143 4,239,303<br />
Operating Expenses<br />
Lease and Well 579,290 559,185 452,044<br />
Transportation Costs 283,329 274,090 152,236<br />
Gathering and Processing Costs 57,632 40,550 27,775<br />
Exploration Costs 169,592 193,886 150,445<br />
Dry Hole Costs 51,243 55,167 115,382<br />
Impairments 305,832 192,859 147,517<br />
Marketing Costs 397,375 152,842 66,680<br />
Depreciation, Depletion and Amortization 1,549,188 1,326,875 1,065,545<br />
General and Administrative 248,274 243,708 205,210<br />
Taxes Other Than <strong>Inc</strong>ome 174,363 320,796 208,073<br />
Total 3,816,118 3,359,958 2,590,907<br />
Operating <strong>Inc</strong>ome 970,841 3,767,185 1,648,396<br />
Other <strong>Inc</strong>ome, Net 2,071 31,012 29,250<br />
<strong>Inc</strong>ome Before Interest Expense and <strong>Inc</strong>ome Taxes 972,912 3,798,197 1,677,646<br />
Interest Expense<br />
<strong>Inc</strong>urred 155,820 94,286 76,102<br />
Capitalized (54,919) (42,628) (29,324)<br />
Net Interest Expense 100,901 51,658 46,778<br />
<strong>Inc</strong>ome Before <strong>Inc</strong>ome Taxes 872,011 3,746,539 1,630,868<br />
<strong>Inc</strong>ome Tax Provision 325,384 1,309,620 540,950<br />
Net <strong>Inc</strong>ome 546,627 2,436,919 1,089,918<br />
Preferred Stock Dividends - 443 6,663<br />
Net <strong>Inc</strong>ome Available to Common Stockholders $ 546,627 $ 2,436,476 $ 1,083,255<br />
Net <strong>Inc</strong>ome Per Share Available to Common Stockholders<br />
Basic $ 2.20 $ 9.88 $ 4.45<br />
Diluted $ 2.17 $ 9.72 $ 4.37<br />
Dividends Declared per Common Share $ 0.58 $ 0.51 $ 0.36<br />
Average Number of Common Shares<br />
Basic 248,996 246,662 243,469<br />
Diluted 251,884 250,542 247,637<br />
Comprehensive <strong>Inc</strong>ome<br />
Net <strong>Inc</strong>ome $ 546,627 $ 2,436,919 $ 1,089,918<br />
Other Comprehensive <strong>Inc</strong>ome (Loss)<br />
Foreign Currency Translation Adjustments 308,286 (431,940) 282,619<br />
Foreign Currency Swap Transaction 6,336 (9,637) 10,789<br />
<strong>Inc</strong>ome Tax Related to Foreign Currency Swap Transaction (1,519) 2,442 (3,086)<br />
Defined Benefit Pension and Postretirement Plans (1,469) 608 (595)<br />
<strong>Inc</strong>ome Tax Related to Defined Benefit Pension and Postretirement<br />
Plans 299 (388) 271<br />
Comprehensive <strong>Inc</strong>ome $ 858,560 $ 1,998,004 $ 1,379,916<br />
The accompanying notes are an integral part of these consolidated financial statements.<br />
F-5
<strong>EOG</strong> RESOURCES, INC.<br />
CONSOLIDATED BALANCE SHEETS<br />
(In Thousands, Except Share Data)<br />
At December 31 <strong>2009</strong> 2008<br />
ASSETS<br />
Current Assets<br />
Cash and Cash Equivalents $ 685,751 $ 331,311<br />
Accounts Receivable, Net 771,417 722,695<br />
Inventories 261,723 187,970<br />
Assets from Price Risk Management Activities 20,915 779,483<br />
<strong>Inc</strong>ome Taxes Receivable 37,009 27,053<br />
Other 62,726 59,939<br />
Total 1,839,541 2,108,451<br />
Property, Plant and Equipment<br />
Oil and Gas Properties (Successful Efforts Method) 24,614,311 20,803,629<br />
Other Property, Plant and Equipment 1,350,132 1,057,888<br />
Total Property, Plant and Equipment 25,964,443 21,861,517<br />
Less: Accumulated Depreciation, Depletion and Amortization (9,825,218) (8,204,215)<br />
Total Property, Plant and Equipment, Net 16,139,225 13,657,302<br />
Other Assets 139,901 185,473<br />
Total Assets $ 18,118,667 $ 15,951,226<br />
LIABILITIES AND STOCKHOLDERS' EQUITY<br />
Current Liabilities<br />
Accounts Payable $ 979,139 $ 1,122,209<br />
Accrued Taxes Payable 92,858 86,265<br />
Dividends Payable 36,286 33,461<br />
Liabilities from Price Risk Management Activities 27,218 4,429<br />
Deferred <strong>Inc</strong>ome Taxes 35,414 368,231<br />
Current Portion of Long-Term Debt 37,000 37,000<br />
Other 137,645 113,321<br />
Total 1,345,560 1,764,916<br />
Long-Term Debt 2,760,000 1,860,000<br />
Other Liabilities 632,652 498,291<br />
Deferred <strong>Inc</strong>ome Taxes 3,382,413 2,813,522<br />
Commitment and Contingencies (Note 7)<br />
Stockholders' Equity<br />
Common Stock, $0.01 Par, 640,000,000 Shares Authorized:<br />
252,627,177 Shares and 249,758,577 Shares Issued at December 31,<br />
<strong>2009</strong> and 2008, respectively 202,526 202,498<br />
Additional Paid in Capital 596,702 323,805<br />
Accumulated Other Comprehensive <strong>Inc</strong>ome 339,720 27,787<br />
Retained Earnings 8,866,747 8,466,143<br />
Common Stock Held in Treasury, 118,525 Shares and 126,911<br />
Shares at December 31, <strong>2009</strong> and 2008, respectively (7,653) (5,736)<br />
Total Stockholders' Equity 9,998,042 9,014,497<br />
Total Liabilities and Stockholders' Equity $ 18,118,667 $ 15,951,226<br />
The accompanying notes are an integral part of these consolidated financial statements.<br />
F-6
<strong>EOG</strong> RESOURCES, INC.<br />
CONSOLIDATED STATEMENTS OF STOCKHOLDERS' EQUITY<br />
(In Thousands, Except Per Share Data)<br />
Accumulated<br />
Common<br />
Additional Other Stock Total<br />
Preferred Common Paid In Comprehensive Retained Held In Stockholders'<br />
Stock Stock Capital <strong>Inc</strong>ome (Loss) Earnings Treasury Equity<br />
Balance at December 31, 2006 $ 52,887 $202,495 $129,986 $176,704 $5,151,034 $(113,435) $5,599,671<br />
Net <strong>Inc</strong>ome - - - - 1,089,918 - 1,089,918<br />
Redemption of Preferred Stock (48,260) - - - - - (48,260)<br />
Amortization of Preferred<br />
Stock Discount 350 - - - (350) - -<br />
Preferred Stock Dividends Declared - - - - (6,313) - (6,313)<br />
Common Stock Dividends<br />
Declared, $0.36 Per Share - - - - (88,368) - (88,368)<br />
Foreign Currency Translation Adjustments - - - 282,619 - - 282,619<br />
Foreign Currency Swap Transaction,<br />
Net of Tax - - - 7,703 - - 7,703<br />
Defined Benefit Pension and Post<br />
Retirement Plans, Net of Tax - - - (324) - - (324)<br />
Treasury Stock Issued Under<br />
Stock Plans - - 16,205 - - 30,106 46,311<br />
Excess Tax Benefits from Stock-Based<br />
Compensation - - 29,084 - - - 29,084<br />
Restricted Stock and Restricted Stock Units - - (21,426) - - 21,426 -<br />
Stock-Based Compensation Expenses - - 67,253 - - - 67,253<br />
Adoption of Accounting Standard for<br />
Uncertainty in <strong>Inc</strong>ome Taxes - - - - 10,800 - 10,800<br />
Balance at December 31, 2007 4,977 202,495 221,102 466,702 6,156,721 (61,903) 6,990,094<br />
Net <strong>Inc</strong>ome - - - - 2,436,919 - 2,436,919<br />
Redemption of Preferred Stock (5,000) - - - - - (5,000)<br />
Amortization of Preferred<br />
Stock Discount 23 - - - (23) - -<br />
Preferred Stock Dividends Declared - - - - (420) - (420)<br />
Common Stock Dividends<br />
Declared, $0.51 Per Share - - - - (127,054) - (127,054)<br />
Foreign Currency Translation Adjustments - - - (431,940) - - (431,940)<br />
Foreign Currency Swap Transaction,<br />
Net of Tax - - - (7,195) - - (7,195)<br />
Defined Benefit Pension and Post<br />
Retirement Plans, Net of Tax - - - 220 - - 220<br />
Treasury Stock Issued Under<br />
Stock Plans - - 7,260 - - 47,649 54,909<br />
Excess Tax Benefits from Stock-Based<br />
Compensation - - 6,446 - - - 6,446<br />
Restricted Stock and Restricted Stock Units - 3 (8,515) - - 8,512 -<br />
Stock-Based Compensation Expenses - - 97,493 - - - 97,493<br />
Treasury Stock Issued as<br />
Compensation - - 19 - - 6 25<br />
Balance at December 31, 2008 - 202,498 323,805 27,787 8,466,143 (5,736) 9,014,497<br />
Net <strong>Inc</strong>ome - - - - 546,627 - 546,627<br />
Common Stock Issued Under Stock Plans - 3 18,641 - - - 18,644<br />
Common Stock Dividends<br />
Declared, $0.58 Per Share - - - - (146,023) - (146,023)<br />
Foreign Currency Translation Adjustments - - - 308,286 - - 308,286<br />
Foreign Currency Swap Transaction,<br />
Net of Tax - - - 4,817 - - 4,817<br />
Defined Benefit Pension and Post<br />
Retirement Plans, Net of Tax - - - (1,170) - - (1,170)<br />
Treasury Stock Issued Under<br />
Stock Plans - - (4,240) - - (4,923) (9,163)<br />
Excess Tax Benefits from Stock-Based<br />
Compensation - - 76,134 - - - 76,134<br />
Restricted Stock and Restricted Stock Units - 10 (2,483) - - 2,473 -<br />
Stock-Based Compensation Expenses - - 95,037 - - - 95,037<br />
Shares Issued for Property Acquisition - 15 89,566 - - - 89,581<br />
Treasury Stock Issued as<br />
Compensation - - 242 - - 533 775<br />
Balance at December 31, <strong>2009</strong> $ - $202,526 $596,702 $339,720 $8,866,747 $ (7,653) $9,998,042<br />
The accompanying notes are an integral part of these consolidated financial statements.<br />
F-7
<strong>EOG</strong> RESOURCES, INC.<br />
CONSOLIDATED STATEMENTS OF CASH FLOWS<br />
(In Thousands)<br />
Year Ended December 31 <strong>2009</strong> 2008 2007<br />
Cash Flows From Operating Activities<br />
Reconciliation of Net <strong>Inc</strong>ome to Net Cash Provided by Operating Activities:<br />
Net <strong>Inc</strong>ome $ 546,627 $ 2,436,919 $ 1,089,918<br />
Items Not Requiring (Providing) Cash<br />
Depreciation, Depletion and Amortization 1,549,188 1,326,875 1,065,545<br />
Impairments 305,832 192,859 147,517<br />
Stock-Based Compensation Expenses 95,180 97,493 67,253<br />
Deferred <strong>Inc</strong>ome Taxes 174,392 1,133,630 426,827<br />
Gains on Property Dispositions, Net (535,436) (123,473) (43,628)<br />
Other, Net 6,761 (14,919) (510)<br />
Dry Hole Costs 51,243 55,167 115,382<br />
Mark-to-Market Commodity Derivative Contracts<br />
Total Gains (431,757) (597,911) (93,108)<br />
Realized Gains (Losses) 1,277,584 (136,625) 127,969<br />
Excess Tax Benefits from Stock-Based Compensation (76,134) (6,446) (27,339)<br />
Other, Net 18,862 13,229 24,268<br />
Changes in Components of Working Capital and Other Assets and<br />
Liabilities<br />
Accounts Receivable (47,818) 95,165 (85,024)<br />
Inventories (50,146) (92,049) 9,638<br />
Accounts Payable (153,565) 30,253 228,354<br />
Accrued Taxes Payable 90,929 72,467 (12,663)<br />
Other Assets (5,515) (10,715) (8,416)<br />
Other Liabilities (12,305) 9,061 12,614<br />
Changes in Components of Working Capital<br />
Associated with Investing and Financing Activities 118,517 152,269 (143,594)<br />
Net Cash Provided by Operating Activities 2,922,439 4,633,249 2,901,003<br />
Investing Cash Flows<br />
Additions to Oil and Gas Properties (3,176,783) (4,718,860) (3,401,986)<br />
Additions to Other Property, Plant and Equipment (326,226) (476,611) (277,076)<br />
Proceeds from Sales of Assets 212,000 383,559 83,295<br />
Changes in Components of Working Capital<br />
Associated with Investing Activities (118,221) (152,374) 143,668<br />
Other, Net (5,321) (2,232) (3,675)<br />
Net Cash Used in Investing Activities (3,414,551) (4,966,518) (3,455,774)<br />
Financing Cash Flows<br />
Long-Term Debt Borrowings 900,000 750,000 610,000<br />
Long-Term Debt Repayments - (38,000) (158,442)<br />
Dividends Paid (142,260) (115,204) (84,020)<br />
Redemption of Preferred Stock - (5,395) (51,197)<br />
Excess Tax Benefits from Stock-Based Compensation 76,134 6,446 27,339<br />
Treasury Stock Purchased (10,986) (17,834) (7,638)<br />
Proceeds from Stock Options Exercised and Employee Stock<br />
Purchase Plan 20,465 72,572 55,320<br />
Debt Issuance Costs (8,895) (7,585) (5,206)<br />
Other, Net (296) 105 (71)<br />
Net Cash Provided by Financing Activities 834,162 645,105 386,085<br />
Effect of Exchange Rate Changes on Cash 12,390 (34,756) 4,662<br />
<strong>Inc</strong>rease (Decrease) in Cash and Cash Equivalents 354,440 277,080 (164,024)<br />
Cash and Cash Equivalents at Beginning of Year 331,311 54,231 218,255<br />
Cash and Cash Equivalents at End of Year $ 685,751 $ 331,311 $ 54,231<br />
The accompanying notes are an integral part of these consolidated financial statements.<br />
F-8
<strong>EOG</strong> RESOURCES, INC.<br />
NOTES TO CONSOLIDATED FINANCIAL STATEMENTS<br />
1. Summary of Significant Accounting Policies<br />
Principles of Consolidation. The consolidated financial statements of <strong>EOG</strong> <strong>Resources</strong>, <strong>Inc</strong>. (<strong>EOG</strong>) include<br />
the accounts of all domestic and foreign subsidiaries. Investments in unconsolidated affiliates, in which <strong>EOG</strong> is able<br />
to exercise significant influence, are accounted for using the equity method. All intercompany accounts and<br />
transactions have been eliminated.<br />
The preparation of financial statements in conformity with accounting principles generally accepted in the<br />
United States of America (GAAP) requires management to make estimates and assumptions that affect the reported<br />
amounts of assets and liabilities and disclosure of contingent assets and liabilities at the date of the financial<br />
statements and the reported amounts of revenues and expenses during the reporting period. Actual results could<br />
differ from those estimates.<br />
Certain reclassifications have been made to prior period financial statements to conform with the current<br />
presentation.<br />
Financial Instruments. <strong>EOG</strong>'s financial instruments consist of cash and cash equivalents, commodity<br />
derivative contracts, accounts receivable, accounts payable and current and long-term debt. The carrying values of cash<br />
and cash equivalents, marketable securities, commodity derivative contracts, accounts receivable and accounts payable<br />
approximate fair value (see Notes 2 and 11).<br />
Cash and Cash Equivalents. <strong>EOG</strong> records as cash equivalents all highly liquid short-term investments with<br />
original maturities of three months or less.<br />
Oil and Gas Operations. <strong>EOG</strong> accounts for its natural gas and crude oil exploration and production activities<br />
under the successful efforts method of accounting.<br />
Oil and gas lease acquisition costs are capitalized when incurred. Unproved properties with individually<br />
significant acquisition costs are amortized over the lease term and analyzed on a property-by-property basis for any<br />
impairment in value. Unproved properties with acquisition costs that are not individually significant are aggregated,<br />
and the portion of such costs estimated to be nonproductive is amortized over the remaining lease term. If the<br />
unproved properties are determined to be productive, the appropriate related costs are transferred to proved oil and<br />
gas properties. Lease rentals are expensed as incurred.<br />
Oil and gas exploration costs, other than the costs of drilling exploratory wells, are charged to expense as<br />
incurred. The costs of drilling exploratory wells are capitalized pending determination of whether they have<br />
discovered proved commercial reserves. Exploratory drilling costs are capitalized when drilling is complete if it is<br />
determined that there is economic producibility supported by either actual production, a conclusive formation test or<br />
by certain technical data if the discovery is located offshore in the Gulf of Mexico. If proved commercial reserves<br />
are not discovered, such drilling costs are expensed. In some circumstances, it may be uncertain whether proved<br />
commercial reserves have been found when drilling has been completed. Such exploratory well drilling costs may<br />
continue to be capitalized if the reserve quantity is sufficient to justify its completion as a producing well and<br />
sufficient progress in assessing the reserves and the economic and operating viability of the project is being made<br />
(see Note 16). Costs to develop proved reserves, including the costs of all development wells and related equipment<br />
used in the production of natural gas and crude oil, are capitalized.<br />
F-9
Depreciation, depletion and amortization of the cost of proved oil and gas properties is calculated using the<br />
unit-of-production method. The reserve base used to calculate depreciation, depletion and amortization for leasehold<br />
acquisition costs and the cost to acquire proved properties is the sum of proved developed reserves and proved<br />
undeveloped reserves. With respect to lease and well equipment costs, which include development costs and successful<br />
exploration drilling costs, the reserve base includes only proved developed reserves. Estimated future dismantlement,<br />
restoration and abandonment costs, net of salvage values, are taken into account. Certain other assets, including<br />
gathering and processing facilities, are depreciated on a straight-line basis over the estimated useful life of the asset.<br />
Assets are grouped in accordance with the Extractive Industries - Oil and Gas Topic of the Financial<br />
Accounting Standards Board (FASB) Accounting Standards Codification (ASC). The basis for grouping is a reasonable<br />
aggregation of properties with a common geological structural feature or stratigraphic condition, such as a reservoir or<br />
field.<br />
Amortization rates are updated quarterly to reflect: 1) the addition of capital costs, 2) reserve revisions<br />
(upwards or downwards) and additions, 3) property acquisitions and/or property dispositions and 4) impairments.<br />
When circumstances indicate that an asset may be impaired, <strong>EOG</strong> compares expected undiscounted future<br />
cash flows at a producing field level to the unamortized capitalized cost of the asset. If the future undiscounted cash<br />
flows, based on <strong>EOG</strong>'s estimate of future natural gas and crude oil prices, operating costs, anticipated production<br />
from proved reserves and other relevant data, are lower than the unamortized capitalized cost, the capitalized cost is<br />
reduced to fair value. Fair value is calculated by discounting the future cash flows at an appropriate risk-adjusted<br />
discount rate.<br />
Inventories, consisting primarily of tubular goods and well equipment held for use in the exploration for and<br />
development and production of natural gas and crude oil reserves, are carried at cost with adjustments made from time<br />
to time to recognize, as appropriate, any reductions in value.<br />
Arrangements for natural gas, crude oil and condensate and natural gas liquids sales are evidenced by signed<br />
contracts with determinable market prices, and revenues are recorded when production is delivered. A significant<br />
majority of the purchasers of these products have investment grade credit ratings and material credit losses have been<br />
rare. Revenues are recorded on the entitlement method based on <strong>EOG</strong>'s percentage ownership of current production.<br />
Each working interest owner in a well generally has the right to a specific percentage of production, although actual<br />
production sold on that owner's behalf may differ from that owner's ownership percentage. Under entitlement<br />
accounting, a receivable is recorded when underproduction occurs and a payable is recorded when overproduction<br />
occurs. Gathering, processing and marketing revenues represent sales of third-party natural gas, crude oil and<br />
condensate and natural gas liquids as well as gathering fees associated with gathering third-party natural gas.<br />
Other Property, Plant and Equipment. Other property, plant and equipment consist of gathering and<br />
processing assets, compressors, vehicles, buildings and leasehold improvements, furniture and fixtures, and computer<br />
hardware and software.<br />
Capitalized Interest Costs. Interest capitalization is required for those properties if its effect, compared<br />
with the effect of expensing interest, is material. Accordingly, certain interest costs have been capitalized as a part of<br />
the historical cost of unproved oil and gas properties. The amount capitalized is an allocation of the interest cost<br />
incurred during the reporting period. Capitalized interest is computed only during the exploration and development<br />
phases and ceases once production begins. The interest rate used for capitalization purposes is based on the interest<br />
rates on <strong>EOG</strong>'s outstanding borrowings.<br />
Accounting for Price Risk Management Activities. <strong>EOG</strong> accounts for its price risk management activities<br />
under the provisions of the Derivatives and Hedging Topic of the ASC (ASC Topic 815). The related provisions<br />
establish accounting and reporting standards requiring that every derivative instrument be recorded on the balance sheet<br />
as either an asset or liability measured at its fair value. The related provisions require that changes in the derivative's fair<br />
value be recognized currently in earnings unless specific hedge accounting criteria are met. During the three-year period<br />
ended December 31, <strong>2009</strong>, <strong>EOG</strong> elected not to designate any of its commodity price risk management activities as<br />
accounting hedges under ASC Topic 815, and accordingly, accounted for them using the mark-to-market accounting<br />
method. Under this accounting method, the changes in the fair value of outstanding financial instruments are recognized<br />
as gains or losses in the period of change. The gains or losses are recorded in Gains (Losses) on Mark-to-Market<br />
Commodity Derivative Contracts. The related cash flow impact is reflected as cash flows from operating activities. See<br />
Note 11. <strong>EOG</strong> entered into a foreign currency swap transaction in March 2004 (see Note 2). <strong>EOG</strong> employs net<br />
presentation of derivative assets and liabilities for financial reporting purposes when such assets and liabilities are<br />
with the same counterparty and subject to a master netting arrangement.<br />
F-10
<strong>Inc</strong>ome Taxes. <strong>EOG</strong> accounts for income taxes under the provisions of the <strong>Inc</strong>ome Taxes Topic of the ASC<br />
(ASC Topic 740). ASC Topic 740 requires the asset and liability approach for accounting for income taxes. Under<br />
this approach, deferred tax assets and liabilities are recognized based on anticipated future tax consequences<br />
attributable to differences between financial statement carrying amounts of assets and liabilities and their respective<br />
tax basis (see Note 5).<br />
Foreign Currency Translation. For subsidiaries whose functional currency is deemed to be other than the<br />
United States dollar, asset and liability accounts are translated at year-end exchange rates and revenues and expenses are<br />
translated at average exchange rates prevailing during the year. Translation adjustments are included in Accumulated<br />
Other Comprehensive <strong>Inc</strong>ome. Any gains or losses on transactions or monetary assets or liabilities in currencies other<br />
than the functional currency are included in net income in the current period.<br />
Net <strong>Inc</strong>ome Per Share. Basic net income per share is computed on the basis of the weighted-average number<br />
of common shares outstanding during the periods. Diluted net income per share is computed based upon the weightedaverage<br />
number of common shares plus the assumed issuance of common shares for all potentially dilutive securities<br />
(see Note 8).<br />
Stock-Based Compensation. In accordance with the provisions of the Stock Compensation Topic of the<br />
ASC (ASC Topic 718), <strong>EOG</strong> measures the cost of employee services received in exchange for an award of equity<br />
instruments based on the grant-date fair value of the award.<br />
Recently Issued Accounting Standards and Developments. In January 2010, the FASB issued FASB<br />
Accounting Standards Update (ASU) No. 2010-03, "Oil and Gas Reserve Estimations and Disclosures" (ASU No.<br />
2010-03). This update aligns the current oil and gas reserve estimation and disclosure requirements of the Extractive<br />
Industries - Oil and Gas topic of the FASB Accounting Standards Codification (ASC Topic 932) with the changes<br />
required by the United States Securities and Exchange Commission (SEC) final rule, "Modernization of Oil and Gas<br />
<strong>Report</strong>ing," as discussed below. ASU No. 2010-03 expands the disclosures required for equity method investments,<br />
revises the definition of oil- and gas-producing activities to include nontraditional resources in reserves unless not<br />
intended to be upgraded into synthetic oil or gas, amends the definition of proved oil and gas reserves to require 12-<br />
month average pricing in estimating reserves, amends and adds definitions in the Master Glossary that is used in<br />
estimating proved oil and gas quantities and provides guidance on geographic area with respect to disclosure of<br />
information about significant reserves. ASU No. 2010-03 must be applied prospectively as a change in accounting<br />
principle that is inseparable from a change in accounting estimate and is effective for entities with annual reporting<br />
periods ending on or after December 31, <strong>2009</strong>. <strong>EOG</strong> adopted ASU No. 2010-03 (see Supplemental Information to<br />
Consolidated Financial Statements) effective December 31, <strong>2009</strong>.<br />
In December 2008, the SEC released a final rule, "Modernization of Oil and Gas <strong>Report</strong>ing," which amends<br />
the oil and gas reporting requirements. The key revisions to the reporting requirements include: using a 12-month<br />
average price to determine reserves; including nontraditional resources in reserves if they are intended to be<br />
upgraded to synthetic oil and gas; ability to use reliable technologies to determine and estimate reserves; and<br />
permitting the optional disclosure of probable and possible reserves. In addition, the final rule includes the<br />
requirements to report the independence and qualifications of the reserve preparer or auditor; to file a report as an<br />
exhibit when a third party is relied upon to prepare reserve estimates or conduct reserve audits; and to disclose the<br />
development of any proved undeveloped reserves (PUDs), including the total quantity of PUDs at year-end, material<br />
changes to PUDs during the year, investments and progress toward the development of PUDs and an explanation of<br />
the reasons why material concentrations of PUDs have remained undeveloped for five years or more after disclosure<br />
as PUDs. The accounting changes resulting from changes in definitions and pricing assumptions should be treated as<br />
a change in accounting principle that is inseparable from a change in accounting estimate, which is to be applied<br />
prospectively. The final rule is effective for annual reports for fiscal years ending on or after December 31, <strong>2009</strong>.<br />
<strong>EOG</strong> adopted the provisions of the new rule effective December 31, <strong>2009</strong>.<br />
F-11
In June <strong>2009</strong>, the FASB issued guidance which establishes the FASB ASC as the source of authoritative<br />
accounting principles recognized by the FASB to be applied in the preparation of financial statements in conformity<br />
with GAAP. This guidance explicitly recognizes rules and interpretive releases of the SEC under federal securities<br />
laws as authoritative GAAP for SEC registrants. The ASC became effective for interim and annual periods ending<br />
after September 15, <strong>2009</strong>. <strong>EOG</strong> has modified its disclosures to appropriately update references to GAAP included in<br />
this <strong>Annual</strong> <strong>Report</strong> on Form 10-K.<br />
Effective April 1, <strong>2009</strong>, <strong>EOG</strong> adopted the provisions of the Subsequent Events Topic of the ASC (ASC<br />
Topic 855). ASC Topic 855 clarifies that management must evaluate, as of each reporting period, events or<br />
transactions that occur after the balance sheet date and through the date that the financial statements are issued or<br />
available to be issued, both for interim and annual reporting periods. The provisions of ASC Topic 855 became<br />
effective prospectively for interim and annual reporting periods ending after June 15, <strong>2009</strong>. As of February 25,<br />
2010, <strong>EOG</strong> has determined that there are no subsequent events which require recognition or disclosure in these<br />
consolidated financial statements.<br />
Effective January 1, <strong>2009</strong>, <strong>EOG</strong> adopted the provisions of the Business Combinations Topic of the ASC<br />
(ASC Topic 805). ASC Topic 805 establishes principles and requirements for how the acquirer recognizes and<br />
measures in the financial statements the identifiable assets acquired, the liabilities assumed and any noncontrolling<br />
interest in the acquired, as well as determines what information to disclose to enable users of the financial statements<br />
to evaluate the nature and financial effects of the business combination. In April <strong>2009</strong>, the FASB amended the<br />
provisions of ASC Topic 805 related to recognition, measurement and disclosure of assets and liabilities assumed in<br />
a business combination that arise from contingencies. The amended provisions of ASC Topic 805 became effective<br />
January 1, <strong>2009</strong>. See Note 17.<br />
Effective January 1, <strong>2009</strong>, <strong>EOG</strong> adopted the expanded disclosure provisions of ASC Topic 815. The new<br />
provisions, which were issued by the FASB in March 2008, do not expand the scope of ASC Topic 815, but require<br />
expanded disclosures about an entity's derivative instruments and hedging activities. The expanded disclosure<br />
provisions became effective for financial statements issued for fiscal years and interim periods beginning after<br />
November 15, 2008. See Note 13.<br />
The Fair Value Measurements and Disclosures Topic of the ASC (ASC Topic 820) was issued by the FASB<br />
in September 2006 and provides a definition of fair value, establishes a framework for measuring fair value and<br />
expands disclosures about fair value measurements. ASC Topic 820 also establishes a fair value hierarchy and<br />
requires disclosure of fair value measurements within that hierarchy. In February 2008, the FASB amended ASC<br />
Topic 820 to delay the effective date of the measurement and disclosure provisions for all nonrecurring fair value<br />
measurements of nonfinancial assets and nonfinancial liabilities until fiscal years beginning after November 15,<br />
2008. <strong>EOG</strong> partially adopted ASC Topic 820 effective January 1, 2008 and adopted the provisions related to<br />
nonfinancial assets and liabilities effective January 1, <strong>2009</strong>. See Note 12.<br />
2. Long-Term Debt<br />
Long-Term Debt at December 31, <strong>2009</strong> and 2008 consisted of the following (in thousands):<br />
<strong>2009</strong> 2008<br />
6.125% Senior Notes due 2013 $ 400,000 $ 400,000<br />
5.875% Senior Notes due 2017 600,000 600,000<br />
6.875% Senior Notes due 2018 350,000 350,000<br />
5.625% Senior Notes due 2019 900,000 -<br />
6.65% Senior Notes due 2028 140,000 140,000<br />
Subsidiary Revolving Credit Facility due 2010 37,000 37,000<br />
7.00% Subsidiary Debt due 2011 220,000 220,000<br />
4.75% Subsidiary Debt due 2014 150,000 150,000<br />
2,797,000 1,897,000<br />
Less: Current Portion of Long-Term Debt 37,000 37,000<br />
Total $ 2,760,000 $ 1,860,000<br />
F-12
At December 31, <strong>2009</strong>, the aggregate annual maturities of long-term debt were $37 million in 2010, $220<br />
million in 2011, zero in 2012, $400 million in 2013 and $150 million in 2014.<br />
During <strong>2009</strong> and 2008, <strong>EOG</strong> utilized commercial paper and short-term borrowings under uncommitted<br />
credit facilities, bearing market interest rates, for various corporate financing purposes. <strong>EOG</strong> had no outstanding<br />
borrowings from commercial paper or uncommitted credit facilities at December 31, <strong>2009</strong>. The weighted average<br />
interest rates for commercial paper and uncommitted credit facility borrowings for <strong>2009</strong> were 0.96% and 1.07%,<br />
respectively.<br />
On May 21, <strong>2009</strong>, <strong>EOG</strong> completed its public offering of $900 million aggregate principal amount of<br />
5.625% Senior Notes due 2019 (2019 Notes). Interest on the 2019 Notes is payable semi-annually in arrears on June<br />
1 and December 1 of each year, beginning December 1, <strong>2009</strong>. Net proceeds from the offering of approximately<br />
$891 million were used for general corporate purposes, including repayment of outstanding commercial paper<br />
borrowings.<br />
On May 11, <strong>2009</strong>, <strong>EOG</strong> <strong>Resources</strong> Trinidad Limited, a wholly owned foreign subsidiary of <strong>EOG</strong>, amended<br />
its 3-year, $75 million Revolving Credit Agreement (Credit Agreement) to extend the scheduled maturity date of the<br />
remaining outstanding balance of $37 million from May 12, <strong>2009</strong> to May 12, 2010. Borrowings under the Credit<br />
Agreement accrue interest based, at <strong>EOG</strong>'s option, on either the Eurodollar rate or the base rate of the Credit<br />
Agreement's administrative agent. The applicable Eurodollar rate at December 31, <strong>2009</strong> was 2.73%. The weighted<br />
average Eurodollar rate for the amount outstanding during the year ended December 31, <strong>2009</strong> was 2.79%.<br />
On September 30, 2008, <strong>EOG</strong> completed its public offering of $400 million aggregate principal amount of<br />
6.125% Senior Notes due 2013 and $350 million aggregate principal amount of 6.875% Senior Notes due 2018<br />
(Notes). Interest on the Notes is payable semi-annually in arrears on April 1 and October 1 of each year, beginning<br />
April 1, <strong>2009</strong>. Net proceeds from the offering of approximately $743 million were used for general corporate<br />
purposes, including repayment of outstanding commercial paper and borrowings under other uncommitted credit<br />
facilities.<br />
<strong>EOG</strong> currently has a $1.0 billion unsecured Revolving Credit Agreement (Agreement) with domestic and<br />
foreign lenders. The Agreement matures on June 28, 2012. At December 31, <strong>2009</strong>, there were no borrowings or<br />
letters of credit outstanding under the Agreement. Advances under the Agreement accrue interest based, at <strong>EOG</strong>'s<br />
option, on either the London InterBank Offering Rate plus an applicable margin (Eurodollar rate) or the base rate of<br />
the Agreement's administrative agent. At December 31, <strong>2009</strong>, the Eurodollar rate and applicable base rate, had there<br />
been any amounts borrowed under the Agreement, would have been 0.42% and 3.25%, respectively.<br />
The Agreement and the Credit Agreement each contain certain restrictive covenants applicable to <strong>EOG</strong>,<br />
including a financial covenant with a maximum debt-to-total capitalization ratio of 65%. There are no other<br />
financial covenants in <strong>EOG</strong>'s financing agreements. <strong>EOG</strong> continues to comply with this financial covenant and does<br />
not view it as materially restrictive.<br />
The 6.125% Senior Notes due 2013, the 5.875% Senior Notes due 2017, the 6.875% Senior Notes due<br />
2018, the 2019 Notes and the 6.65% Senior Notes due 2028 were issued through public offerings and have effective<br />
interest rates of 6.276%, 5.971%, 7.042%, 5.735% and 6.785%, respectively. The 7.00% Subsidiary Debt due 2011<br />
bears interest at a fixed rate of 7.00% and is guaranteed by <strong>EOG</strong>.<br />
On March 9, 2004, under Rule 144A of the Securities Act of 1933, as amended, <strong>EOG</strong> <strong>Resources</strong> Canada<br />
<strong>Inc</strong>., a wholly-owned subsidiary of <strong>EOG</strong>, issued notes with a total principal amount of $150 million, an annual<br />
interest rate of 4.75% and a maturity date of March 15, 2014. The notes are guaranteed by <strong>EOG</strong>. In conjunction<br />
with the offering, <strong>EOG</strong> entered into a foreign currency swap transaction with multiple banks for the equivalent<br />
amount of the notes and related interest, which has in effect converted this indebtedness into $201.3 million<br />
Canadian dollars with a 5.275% interest rate. <strong>EOG</strong> accounts for the foreign currency swap transaction using the<br />
hedge accounting method, pursuant to the provisions of ASC Topic 815. Under those provisions, as of December<br />
31, <strong>2009</strong> and 2008, <strong>EOG</strong> recorded the fair value of the foreign currency swap of $49 million and $26 million,<br />
respectively, in Other Liabilities on the Consolidated Balance Sheets. Changes in the fair value of the foreign<br />
currency swap resulted in no net impact to Net <strong>Inc</strong>ome Available to Common Stockholders on the Consolidated<br />
Statements of <strong>Inc</strong>ome and Comprehensive <strong>Inc</strong>ome. The after-tax net impact from the foreign currency swap<br />
transaction was an increase in Other Comprehensive <strong>Inc</strong>ome of $5 million and $8 million for the years ended<br />
December 31, <strong>2009</strong> and 2007, respectively, and a decrease in Other Comprehensive <strong>Inc</strong>ome of $7 million for the<br />
year ended December 31, 2008.<br />
F-13
Fair Value of Debt. At December 31, <strong>2009</strong> and 2008, <strong>EOG</strong> had $2,797 million and $1,897 million,<br />
respectively, of debt, which had estimated fair values of approximately $3,056 million and $1,933 million,<br />
respectively. The estimated fair value of debt was based upon quoted market prices and, where such prices were not<br />
available, upon interest rates available to <strong>EOG</strong> at year-end.<br />
3. Stockholders' Equity<br />
Common Stock. <strong>EOG</strong> purchases shares of its common stock from time to time in the open market. In<br />
September 2001, <strong>EOG</strong>'s Board of Directors (Board) authorized the purchase of an aggregate maximum of 10 million<br />
shares of common stock of <strong>EOG</strong> that superseded all previous authorizations. At December 31, <strong>2009</strong>, 6,386,200<br />
shares remained available for purchase under this authorization. In addition, shares of <strong>EOG</strong>'s common stock are<br />
from time to time withheld by, or returned to, <strong>EOG</strong> in satisfaction of tax withholding obligations arising upon the<br />
exercise of employee stock options or stock-settled stock appreciation rights. the vesting of restricted stock or<br />
restricted stock unit grants or in payment of the exercise price of employee stock options. Such shares withheld or<br />
returned do not count against the Board authorization discussed above. Shares purchased, withheld and returned are<br />
held in treasury for, among other purposes, fulfilling any obligations arising under <strong>EOG</strong>'s stock plans and any other<br />
approved transactions or activities for which such shares of common stock shall be required.<br />
The Board increased the quarterly cash dividend on <strong>EOG</strong>'s common stock from $0.06 per share to $0.09 per<br />
share on January 31, 2007 effective beginning with the dividend paid on April 30, 2007, to $0.12 per share on<br />
February 7, 2008 effective beginning with the dividend paid on April 30, 2008, to $0.135 per share on July 29, 2008<br />
effective beginning with the dividend paid on October 31, 2008 and to $0.145 per share on February 4, <strong>2009</strong><br />
effective beginning with the dividend paid on April 30, <strong>2009</strong>. On February 9, 2010, <strong>EOG</strong>'s Board increased the<br />
quarterly cash dividend on the common stock from the current $0.145 per share to $0.155 per share effective<br />
beginning with the dividend to be paid on April 30, 2010.<br />
The following summarizes <strong>EOG</strong>'s common stock activity for each of the years ended December 31, 2007,<br />
2008 and <strong>2009</strong> (in thousands):<br />
Common Shares<br />
Issued Treasury Outstanding<br />
Balance at December 31, 2006 249,460 (5,725) 243,735<br />
Treasury Stock Purchased (1) - (126) (126)<br />
Treasury Stock Issued Under Employee Stock Purchase Plan - 102 102<br />
Treasury Stock Issued Under Other Equity Compensation Plans - 2,814 2,814<br />
Balance at December 31, 2007 249,460 (2,935) 246,525<br />
Common Stock Issued Under Equity Compensation Plans 299 - 299<br />
Treasury Stock Purchased (1) - (195) (195)<br />
Treasury Stock Issued Under Employee Stock Purchase Plan - 103 103<br />
Treasury Stock Issued Under Other Equity Compensation Plans - 2,900 2,900<br />
Balance at December 31, 2008 249,759 (127) 249,632<br />
Common Stock Issued Under Equity Compensation Plans 1,347 - 1,347<br />
Treasury Stock Purchased (1) - (168) (168)<br />
Common Stock Issued Under Employee Stock Purchase Plan 71 - 71<br />
Treasury Stock Issued Under Other Equity Compensation Plans - 177 177<br />
Common Stock Issued for Property Acquisition 1,450 - 1,450<br />
Balance at December 31, <strong>2009</strong> 252,627 (118) 252,509<br />
(1) Represents shares that were withheld by, or returned to, <strong>EOG</strong> in satisfaction of tax withholding obligations that arose upon the<br />
exercise of employee stock options or stock-settled stock appreciation rights, the vesting of restricted stock or restricted stock<br />
unit grants or in payment of the exercise price of employee stock options.<br />
F-14
Common Stock Rights Agreement. In February 2000, the Board declared a dividend of one preferred share<br />
purchase right (a Right, and the agreement governing the terms of such Rights, as amended, the Rights Agreement)<br />
for each outstanding share of <strong>EOG</strong> common stock. In accordance with the Rights Agreement, each share of common<br />
stock issued thereafter by <strong>EOG</strong> also had one Right associated with it, including each share issued in connection with<br />
the two-for-one stock split effected in March 2005. The Rights and the Rights Agreement expired on February 24,<br />
2010.<br />
Preferred Stock. <strong>EOG</strong> currently has one authorized series of preferred stock. In February 2000, <strong>EOG</strong>'s<br />
Board, in connection with the Rights Agreement, authorized 1,500,000 shares of the Series E Junior Participating<br />
Preferred Stock (Series E) with the rights and preferences. In February 2005, <strong>EOG</strong>'s Board increased the authorized<br />
shares of the Series E to 3,000,000 in connection with the two-for-one stock split of <strong>EOG</strong>'s common stock effected in<br />
March 2005. As of December 31, <strong>2009</strong>, there were no shares of the Series E outstanding.<br />
In July 2000, <strong>EOG</strong>'s Board authorized 100,000 shares of 7.195% Fixed Rate Cumulative Perpetual Senior<br />
Preferred Stock, Series B, with a $1,000 liquidation preference per share (Series B). Dividends were payable<br />
quarterly, in cash, on the shares of the Series B as declared by <strong>EOG</strong>'s Board at a rate of $71.95 per share per year, on<br />
March 15, June 15, September 15 and December 15 of each year. In separate transactions in 2007 and 2008, <strong>EOG</strong><br />
purchased all of the outstanding shares of the Series B. In March 2008, <strong>EOG</strong> filed a certificate of elimination with<br />
respect to the Series B with the Delaware Secretary of State, eliminating all matters with respect to the Series B from<br />
<strong>EOG</strong>'s restated certificate of incorporation and effectively eliminating the Series B as an authorized series of <strong>EOG</strong>'s<br />
preferred stock.<br />
4. Other <strong>Inc</strong>ome, Net<br />
Other income, net for <strong>2009</strong> included equity income from investments in the Caribbean Nitrogen Company<br />
Limited (CNCL) and Nitrogen (2000) Unlimited (N2000) ammonia plants ($4 million), net foreign currency<br />
transaction gains ($4 million) and losses on sales of warehouse stock ($4 million). Other income, net for 2008<br />
included interest income ($9 million), equity income from investments in CNCL and N2000 ammonia plants ($19<br />
million), net foreign currency transaction losses ($5 million) and settlements received related to the Enron Corp.<br />
bankruptcy ($3 million).<br />
5. <strong>Inc</strong>ome Taxes<br />
The principal components of <strong>EOG</strong>'s net deferred income tax liabilities at December 31, <strong>2009</strong> and 2008 were as<br />
follows (in thousands):<br />
<strong>2009</strong> 2008<br />
Current Deferred <strong>Inc</strong>ome Tax (Assets) Liabilities<br />
Commodity Hedging Contracts $ 11,559 $ 276,438<br />
Deferred Compensation Plans (11,121) (8,226)<br />
Timing Differences Associated With Different Year-ends in Foreign<br />
Jurisdictions 27,659 98,736<br />
Other 7,317 1,283<br />
Total Net Current Deferred <strong>Inc</strong>ome Tax Liabilities $ 35,414 $ 368,231<br />
Noncurrent Deferred <strong>Inc</strong>ome Tax (Assets) Liabilities<br />
Oil and Gas Exploration and Development Costs Deducted for<br />
Tax Over Book Depreciation, Depletion and Amortization $ 3,746,302 $ 3,048,651<br />
Non-Producing Leasehold Costs (67,347) (50,841)<br />
Seismic Costs Capitalized for Tax (64,917) (47,325)<br />
Equity Awards (76,978) (52,300)<br />
Capitalized Interest 76,852 62,488<br />
Alternative Minimum Tax Credit Carryforward (200,034) (143,142)<br />
Other (31,465) (4,009)<br />
Total Net Noncurrent Deferred <strong>Inc</strong>ome Tax Liabilities $ 3,382,413 $ 2,813,522<br />
Total Net Deferred <strong>Inc</strong>ome Tax Liabilities $ 3,417,827 $ 3,181,753<br />
F-15
The components of <strong>Inc</strong>ome Before <strong>Inc</strong>ome Taxes for the years indicated below were as follows (in thousands):<br />
<strong>2009</strong> 2008 2007<br />
United States $ 784,248 $ 3,138,175 $ 1,191,093<br />
Foreign 87,763 608,364 439,775<br />
Total $ 872,011 $ 3,746,539 $ 1,630,868<br />
The principal components of <strong>EOG</strong>'s <strong>Inc</strong>ome Tax Provision for the years indicated below were as follows (in<br />
thousands):<br />
<strong>2009</strong> 2008 2007<br />
Current:<br />
Federal $ 95,194 $ 50,776 $ (7,284)<br />
State 8,783 5,674 (3,999)<br />
Foreign 47,015 119,540 125,406<br />
Total 150,992 175,990 114,123<br />
Deferred:<br />
Federal 166,045 1,010,535 416,925<br />
State 31,580 56,540 26,506<br />
Foreign (23,233) 66,555 (16,604)<br />
Total 174,392 1,133,630 426,827<br />
<strong>Inc</strong>ome Tax Provision $ 325,384 $ 1,309,620 $ 540,950<br />
The differences between taxes computed at the United States federal statutory tax rate and <strong>EOG</strong>'s effective<br />
rate were as follows:<br />
<strong>2009</strong> 2008 2007<br />
Statutory Federal <strong>Inc</strong>ome Tax Rate 35.00% 35.00% 35.00%<br />
State <strong>Inc</strong>ome Tax, Net of Federal Benefit 3.00 1.08 0.90<br />
<strong>Inc</strong>ome Tax Provision Related to Foreign Operations (0.80) (0.72) (0.67)<br />
Change in Canadian Federal and Provincial Statutory Tax Rates and<br />
Other Canadian Adjustments - - (2.10)<br />
Domestic Production Activities Deduction 0.06 0.01 0.11<br />
Other 0.05 (0.41) (0.07)<br />
Effective <strong>Inc</strong>ome Tax Rate 37.31% 34.96% 33.17%<br />
The balance of unrecognized tax benefits at December 31, <strong>2009</strong> was $29 million ($16 million related to<br />
<strong>2009</strong>), all of which, if recognized, would affect the effective tax rate. <strong>EOG</strong> records interest and penalties related to<br />
unrecognized tax benefits to its income tax provision. Currently, there are no amounts of interest or penalties<br />
recognized in the Consolidated Statements of <strong>Inc</strong>ome and Comprehensive <strong>Inc</strong>ome or in the Consolidated Balance<br />
Sheets. <strong>EOG</strong> does not anticipate that the amount of the unrecognized tax benefits will significantly change during<br />
the next twelve months. <strong>EOG</strong> and its subsidiaries file income tax returns in the United States and various state, local<br />
and foreign jurisdictions. <strong>EOG</strong> is generally no longer subject to income tax examinations by tax authorities in the<br />
United States (federal), Canada, the United Kingdom, Trinidad and China for taxable years before 2005, 2005, 2008,<br />
2002 and 2008, respectively.<br />
<strong>EOG</strong>'s foreign subsidiaries' undistributed earnings of approximately $3.0 billion at December 31, <strong>2009</strong> are<br />
considered to be indefinitely invested outside the United States and, accordingly, no United States federal or state<br />
income taxes have been provided thereon. Upon distribution of those earnings, <strong>EOG</strong> may be subject to both foreign<br />
withholding taxes and United States income taxes, net of allowable foreign tax credits. Determination of any<br />
potential amount of unrecognized deferred income tax liabilities is not practicable.<br />
F-16
ASC Topic 718, which relates to accounting for stock-based compensation, provides that when settlement<br />
of a stock award contributes to a net operating loss carryforward, neither the associated excess tax benefit nor the<br />
credit to additional paid in capital (APIC) should be recorded until the stock award deduction reduces income taxes<br />
payable. In 2008, <strong>EOG</strong> generated a regular tax net operating loss of $184 million, which was expected to be carried<br />
forward and applied against regular taxable income in future periods. In November <strong>2009</strong>, the Worker,<br />
Homeownership, and Business Assistance Act of <strong>2009</strong> was enacted, thereby allowing the 2008 net operating loss to<br />
be fully utilized as a carryback rather than as a carryforward and as such provided an immediate reduction in income<br />
taxes, via a refund, resulting in a benefit of $66 million being reflected in APIC.<br />
In <strong>2009</strong>, <strong>EOG</strong> paid alternative minimum tax (AMT) of $21 million. The AMT paid in <strong>2009</strong>, along with<br />
AMT of $179 million paid in prior years (cumulative total of $200 million), will be carried forward as a credit<br />
available to offset regular income taxes in future periods.<br />
6. Employee Benefit Plans<br />
Pension Plans and Postretirement Benefits<br />
At December 31, <strong>2009</strong>, <strong>EOG</strong> and its subsidiaries in Canada and Trinidad maintained certain defined benefit<br />
pension and postretirement medical plans covering certain eligible employees. <strong>EOG</strong> plan assets and benefit<br />
obligations are currently measured as of the date of <strong>EOG</strong>'s fiscal year-end. During <strong>2009</strong>, approximately $0.1 million<br />
from such plans was amortized from accumulated other comprehensive income through net periodic benefit costs.<br />
Pension Plans. <strong>EOG</strong> has a non-contributory defined contribution pension plan and a matched defined<br />
contribution savings plan in place for most of its employees in the United States. <strong>EOG</strong>'s contributions to these<br />
pension plans are based on various percentages of compensation and, in some instances, are based upon the amount<br />
of the employees' contributions. <strong>EOG</strong>'s total costs recognized for these plans were $22 million, $20 million and $16<br />
million for <strong>2009</strong>, 2008 and 2007, respectively.<br />
In addition, <strong>EOG</strong>'s Canadian subsidiary maintains both a non-contributory defined benefit pension plan and<br />
a non-contributory defined contribution pension plan, as well as a matched defined contribution savings plan. <strong>EOG</strong>'s<br />
Trinidadian subsidiary maintains a contributory defined benefit pension plan and a matched savings plan. With the<br />
exception of Canada's non-contributory defined benefit pension plan, which is closed to new employees, these<br />
pension plans are available to most employees of the Canadian and Trinidadian subsidiaries. <strong>EOG</strong>'s combined<br />
contributions to these plans were $2.3 million, $2.7 million and $2.7 million for <strong>2009</strong>, 2008 and 2007, respectively.<br />
For the Canadian and Trinidadian defined benefit pension plans, the benefit obligation, fair value of plan<br />
assets and prepaid/(accrued) benefit cost totaled $9.1 million, $7.7 million and $(0.9) million, respectively, at<br />
December 31, <strong>2009</strong> and $6.2 million, $6.2 million and $0.3 million, respectively, at December 31, 2008. Weighted<br />
average discount rate, expected return on plan assets, rate of compensation increase and rate of pension increase<br />
assumptions used to determine net periodic benefit cost for the pension plans were 7.87%, 7.99%, 5.73% and 1.51%,<br />
respectively, at December 31, <strong>2009</strong>; 7.90%, 8.05%, 5.80% and 1.46%, respectively, at December 31, 2008 and<br />
6.85%, 7.47%, 5.15% and 1.90%, respectively, at December 31, 2007. Weighted average discount rate, rate of<br />
compensation increase and rate of pension increase assumptions used to determine benefit obligations for the<br />
pension plans were 5.76%, 4.14% and 1.74%, respectively, for the year ended December 31, <strong>2009</strong> and 7.59%,<br />
5.02% and 1.99%, respectively, for the year ended December 31, 2008. The weighted average asset allocation at<br />
December 31, <strong>2009</strong> consisted of equities (46%), debt and fixed income securities (44%) and other assets (10%).<br />
The weighted average asset allocation at December 31, 2008 consisted of equities (48%), debt and fixed income<br />
securities (44%) and other assets (8%).<br />
The fair value of Canada's pension plan assets was $5.0 million at December 31, <strong>2009</strong>. Such assets consisted<br />
of mutual funds valued using Level 1 inputs, which represent quoted market prices in active markets. The fair value of<br />
Trinidad's pension plan assets was $2.7 million at December 31, <strong>2009</strong>. Such assets consisted of cash in other currencies<br />
($0.5 million), cash in United States dollars ($0.1 million) and foreign equities ($0.1 million) valued using Level 1<br />
inputs, as well as bonds ($1.6 million), local equities ($0.3 million) and regional equities ($0.1 million) valued using<br />
Level 2 inputs, which represent indirectly observable inputs other than quoted market prices (see Note 12).<br />
F-17
The investment policy for the defined benefit pension plan in Trinidad is determined by the pension plan's<br />
trustee, with input from <strong>EOG</strong>. The plan's asset allocation policy is largely dictated by local statutory requirements which<br />
restrict total investment in equities to a maximum of 50% of the plan's assets and investment overseas to 20% of the<br />
plan's assets. The investment policy for the defined benefit pension plan in Canada provides that <strong>EOG</strong> shall invest the<br />
plan assets in one or more balanced funds with Canadian and foreign equity components as deemed appropriate for the<br />
purpose of diversification.<br />
<strong>EOG</strong>'s United Kingdom subsidiary maintains a pension plan which includes a non-contributory defined<br />
contribution pension plan and a matched defined contribution savings plan. The pension plan is available to all<br />
employees of the United Kingdom subsidiary. <strong>EOG</strong>'s combined contributions to these pension plans were<br />
approximately $0.1 million for each of the years <strong>2009</strong>, 2008 and 2007.<br />
Postretirement Health Care. <strong>EOG</strong> has postretirement medical and dental benefits in place for eligible United<br />
States and Trinidad employees and their eligible dependents. <strong>EOG</strong> accrues these postretirement benefit costs over the<br />
service lives of the employees expected to be eligible to receive such benefits.<br />
The benefit obligation and accrued benefit cost for the postretirement benefit plans totaled $5.2 million and<br />
$5.1 million, respectively, at December 31, <strong>2009</strong> and each totaled $4.4 million at December 31, 2008. Weighted<br />
average discount rate assumptions used to determine benefit obligations for the postretirement plans at December 31,<br />
<strong>2009</strong> and 2008 were 5.83% and 6.25%, respectively. Weighted average discount rate assumptions used to determine<br />
net periodic benefit cost for the years ended December 31, <strong>2009</strong>, 2008 and 2007 were 6.28%, 6.33% and 5.96%,<br />
respectively. Net periodic benefit cost recognized for the postretirement benefit plans totaled $0.8 million, $0.8<br />
million and $0.7 million for the years ended December 31, <strong>2009</strong>, 2008 and 2007.<br />
Estimated Future Employer-Paid Benefits. The following benefits, which reflect expected future service, as<br />
appropriate, are expected to be paid by <strong>EOG</strong> in the next 10 years (in thousands):<br />
Pension<br />
Plans<br />
Postretirement<br />
Plans<br />
2010 $ 242 $ 198<br />
2011 294 237<br />
2012 260 267<br />
2013 287 325<br />
2014 458 390<br />
2015 - 2019 2,655 2,880<br />
Postretirement health care trend rates had minimal effect on the amounts reported for the postretirement<br />
health care plans for both <strong>2009</strong> and 2008. Most future increases or decreases in healthcare costs would be borne by<br />
the employee.<br />
Stock-Based Compensation<br />
During <strong>2009</strong>, <strong>EOG</strong> maintained various stock-based compensation plans as discussed below. <strong>EOG</strong><br />
recognizes compensation expense on grants of stock options, stock-settled stock appreciation rights (SARs),<br />
restricted stock, restricted stock units and grants made under its Employee Stock Purchase Plan (ESPP). Stockbased<br />
compensation expense is calculated based upon the grant date estimated fair value of the awards, net of<br />
forfeitures, based upon <strong>EOG</strong>'s historical employee turnover rate. For awards made prior to January 1, 2006,<br />
compensation expense is amortized over the vesting period on a straight-line basis. For awards made subsequent to<br />
January 1, 2006, compensation expense is amortized over the shorter of the vesting period or the period from date of<br />
grant until the date the employee becomes eligible to retire without company approval.<br />
F-18
Stock-based compensation expense is included in the Consolidated Statements of <strong>Inc</strong>ome and<br />
Comprehensive <strong>Inc</strong>ome based upon job functions of the employees receiving the grants. Compensation expense<br />
related to <strong>EOG</strong>'s stock-based compensation plans for the years ended December 31, <strong>2009</strong>, 2008 and 2007 was as<br />
follows (in millions):<br />
<strong>2009</strong> 2008 2007<br />
Lease and Well $ 23 $ 20 $ 14<br />
Exploration Costs 21 18 13<br />
General and Administrative 51 59 40<br />
Total $ 95 $ 97 $ 67<br />
<strong>EOG</strong>'s stockholders approved the <strong>EOG</strong> <strong>Resources</strong>, <strong>Inc</strong>. 2008 Omnibus Equity Compensation Plan (2008<br />
Plan) at the 2008 <strong>Annual</strong> Meeting of Stockholders in May 2008. The 2008 Plan provides for grants of stock options,<br />
SARs, restricted stock, restricted stock units and other stock-based awards, up to an aggregate maximum of 6.0<br />
million shares of common stock, plus shares underlying forfeited or cancelled grants under the prior stock plans.<br />
Under the 2008 Plan, grants may be made to employees and non-employee members of <strong>EOG</strong>'s Board. At December<br />
31, <strong>2009</strong>, approximately 2.2 million common shares remained available for grant under the 2008 Plan. Effective with<br />
the adoption of the 2008 Plan, <strong>EOG</strong>'s policy is to issue shares related to the 2008 Plan from previously authorized<br />
unissued shares.<br />
During <strong>2009</strong>, 2008 and 2007, <strong>EOG</strong> issued treasury shares in connection with stock option exercises,<br />
restricted stock grants, restricted stock unit releases and ESPP purchases. The difference between the cost of the<br />
treasury shares and the exercise price of the options is reflected as an adjustment to APIC to the extent <strong>EOG</strong> has<br />
accumulated APIC relating to treasury stock and to retained earnings thereafter. Additionally, <strong>EOG</strong> recognized, as<br />
an adjustment to APIC, federal income tax benefits of $76 million, $6 million and $29 million for <strong>2009</strong>, 2008 and<br />
2007, respectively, related to the exercise of stock options/SARs and the release of restricted stock and restricted<br />
stock units.<br />
Stock Options and Stock Appreciation Rights and Employee Stock Purchase Plan. Participants in <strong>EOG</strong>'s<br />
stock plans (including the 2008 Plan) have been or may be granted options to purchase shares of common stock of<br />
<strong>EOG</strong>. In addition, participants in <strong>EOG</strong>'s stock plans (including the 2008 Plan) have been or may be granted SARs,<br />
representing the right to receive shares of <strong>EOG</strong> common stock based on the appreciation in the stock price from the<br />
date of grant on the number of SARs granted. Stock options and SARs are granted at a price not less than the market<br />
price of the common stock on the date of grant. Stock options and SARs granted vest on a graded vesting schedule<br />
up to four years from the date of grant based on the nature of the grants and as defined in individual grant<br />
agreements. Terms for stock options and SARs granted have not exceeded a maximum term of 10 years. <strong>EOG</strong>'s<br />
ESPP allows eligible employees to semi-annually purchase, through payroll deductions, shares of <strong>EOG</strong> common<br />
stock at 85 percent of the fair market value at specified dates. Contributions to the ESPP are limited to 10 percent of<br />
the employee's pay (subject to certain ESPP limits) during each of the two six-month offering periods each year.<br />
The fair value of all ESPP grants is estimated using the Black-Scholes-Merton model. Certain of <strong>EOG</strong>'s<br />
stock options granted in 2005 contain a feature that limits the potential gain that can be realized by requiring vested<br />
options to be exercised if the market price of <strong>EOG</strong>'s common stock reaches 200% of the grant price for five<br />
consecutive trading days (Capped Option). <strong>EOG</strong> may or may not issue Capped Options in the future. The fair value<br />
of each Capped Option grant was estimated using a Monte Carlo simulation. The fair value of stock option grants<br />
not containing the Capped Option feature and SAR grants was estimated using the Hull-White II binomial option<br />
pricing model. Stock-based compensation expense related to stock option, SAR and ESPP grants totaled $38.0<br />
million, $38.9 million and $36.7 million for the years ended December 31, <strong>2009</strong>, 2008 and 2007, respectively.<br />
F-19
Weighted average fair values and valuation assumptions used to value stock option, SAR and ESPP grants<br />
for the years ended December 31, <strong>2009</strong>, 2008 and 2007 were as follows:<br />
Stock Options/SARs<br />
ESPP<br />
<strong>2009</strong> 2008 2007 <strong>2009</strong> 2008 2007<br />
Weighted Average Fair Value<br />
of Grants $30.13 $32.19 $24.23 $25.78 $29.68 $16.11<br />
Expected Volatility 41.90% 38.55% 30.68% 78.89% 37.58% 29.76%<br />
Risk-Free Interest Rate 1.42% 2.53% 4.48% 0.25% 2.64% 5.01%<br />
Dividend Yield 0.70% 0.60% 0.30% 1.00% 0.50% 0.30%<br />
Expected Life 5.5 yrs 5.3 yrs 5.2 yrs 0.5 yrs 0.5 yrs 0.5 yrs<br />
Expected volatility is based on an equal weighting of historical volatility and implied volatility from traded<br />
options in <strong>EOG</strong>'s common stock. The risk-free interest rate is based upon United States Treasury yields in effect at<br />
the time of grant. The expected life is based upon historical experience and contractual terms of stock option, SAR<br />
and ESPP grants.<br />
The following table sets forth the stock option and SAR transactions for the years ended December 31, <strong>2009</strong>,<br />
2008 and 2007 (stock options and SARs in thousands):<br />
<strong>2009</strong> 2008 2007<br />
Number Weighted Number Weighted Number Weighted<br />
of Stock Average of Stock Average Of Stock Average<br />
Options/ Grant Options/ Grant Options/ Grant<br />
SARs Price SARs Price SARs Price<br />
Outstanding at January 1 7,802 $52.56 9,373 $41.04 10,150 $35.29<br />
Granted 1,270 80.95 1,231 90.57 1,210 73.46<br />
Exercised (1) (636) 46.56 (2,628) 28.19 (1,820) 29.12<br />
Forfeited (101) 74.07 (174) 69.22 (167) 56.39<br />
Outstanding at December 31 8,335 57.08 7,802 52.56 9,373 41.04<br />
Stock Options/SARs Exercisable at<br />
December 31 5,394 44.45 4,711 37.23 5,617 27.21<br />
Available for Future Grant 2,222 4,555 1,140<br />
(1) The total intrinsic value of stock options/SARs exercised during the years <strong>2009</strong>, 2008 and 2007 was $21.4 million, $217.9<br />
million and $86.4 million, respectively. The intrinsic value is based upon the difference between the market price of <strong>EOG</strong><br />
common stock on the date of exercise and the grant price of the stock options/SARs.<br />
At December 31, <strong>2009</strong>, there were 8,099,972 stock options/SARs vested or expected to vest with a<br />
weighted average grant price of $56.40, an intrinsic value of $333 million and a weighted average remaining<br />
contractual life of 4.1 years.<br />
F-20
The following table summarizes certain information for the stock options and SARs outstanding at<br />
December 31, <strong>2009</strong> (stock options and SARs in thousands):<br />
Stock Options/SARs Outstanding<br />
Stock Options/SARs Exercisable<br />
Weighted<br />
Weighted<br />
Average Weighted Average Weighted<br />
Range of Stock Remaining Average Aggregate Stock Remaining Average Aggregate<br />
Grant Options/ Life Grant Intrinsic Options/ Life Grant Intrinsic<br />
Prices SARs (Years) Price Value (1) SARs (Years) Price Value (1)<br />
$ 7.00 to $ 16.99 476 1 $16.60 476 1 $16.60<br />
17.00 to 19.99 1,425 3 18.37 1,425 3 18.37<br />
20.00 to 48.99 683 3 23.42 681 3 23.36<br />
49.00 to 69.99 2,310 3 61.94 1,933 3 61.99<br />
70.00 to 136.99 3,441 6 82.13 879 5 79.61<br />
8,335 4 57.08 $336,606 5,394 3 44.45 $285,524<br />
(1) Based upon the difference between the closing market price of <strong>EOG</strong> common stock on the last trading day of the year and the grant price of<br />
in-the-money stock options and SARs.<br />
At December 31, <strong>2009</strong>, unrecognized compensation expense related to non-vested stock option and SAR<br />
grants totaled $77.9 million. This unrecognized expense will be amortized on a straight-line basis over a weighted<br />
average period of 2.7 years.<br />
<strong>EOG</strong> suspended the ESPP, effective for the July 1, <strong>2009</strong> to December 31, <strong>2009</strong> offering period, due to an<br />
insufficient number of shares remaining available under the ESPP. Subject to stockholder approval of an<br />
amendment to the ESPP to increase the shares available under the ESPP at the 2010 <strong>Annual</strong> Meeting of<br />
Stockholders, <strong>EOG</strong> expects to resume the ESPP for the January 1, 2010 to June 30, 2010 offering period. The ESPP<br />
was originally approved by <strong>EOG</strong>'s stockholders in 2001 and has a term expiring on July 1, 2011; the amendment to<br />
be presented to <strong>EOG</strong>'s stockholders at the 2010 <strong>Annual</strong> Meeting of Stockholders will, if approved, also extend the<br />
term of the ESPP to July 1, 2021. The following table summarizes ESPP activities for the years ended December 31,<br />
<strong>2009</strong>, 2008 and 2007 (in thousands, except number of participants):<br />
<strong>2009</strong> 2008 2007<br />
Approximate Number of Participants 1,128 1,075 860<br />
Shares Purchased 72 103 102<br />
Aggregate Purchase Price $ 4,150 $ 6,724 $ 5,840<br />
Restricted Stock and Restricted Stock Units. Employees may be granted restricted (non-vested) stock<br />
and/or restricted stock units without cost to them. The restricted stock and restricted stock units generally vest five<br />
years after the date of grant, except for certain bonus grants, and as defined in individual grant agreements. Upon<br />
vesting of restricted stock, common shares are released to the employee. Restricted stock units are converted into<br />
common shares upon vesting and released to the employee. Stock-based compensation expense related to restricted<br />
stock and restricted stock units totaled $57.2 million, $58.6 million and $30.6 million for the years ended December<br />
31, <strong>2009</strong>, 2008 and 2007, respectively.<br />
F-21
The following table sets forth the restricted stock and restricted stock unit transactions for the years ended<br />
December 31, <strong>2009</strong>, 2008 and 2007 (shares and units in thousands):<br />
<strong>2009</strong> 2008 2007<br />
Weighted Weighted Weighted<br />
Number of Average Number of Average Number of Average<br />
Shares and Grant Date Shares and Grant Date Shares and Grant Date<br />
Units Fair Value Units Fair Value Units Fair Value<br />
Outstanding at January 1 3,048 $70.24 3,000 $50.61 2,301 $36.13<br />
Granted 1,197 63.13 795 106.67 1,141 71.28<br />
Released (1) (553) 31.35 (623) 22.77 (346) 21.20<br />
Forfeited (56) 78.18 (124) 67.42 (96) 54.58<br />
Outstanding at December 31 (2) 3,636 73.69 3,048 70.24 3,000 50.61<br />
(1) The total intrinsic value of restricted stock and restricted stock units released during the years ended December 31, <strong>2009</strong>, 2008 and 2007<br />
was $36.9 million, $55.7 million and $23.8 million, respectively. The intrinsic value is based upon the closing price of <strong>EOG</strong>'s common<br />
stock on the date restricted stock and restricted stock units are released.<br />
(2) The aggregate intrinsic value of restricted stock and restricted stock units outstanding at December 31, <strong>2009</strong> and 2008 was approximately<br />
$353.8 million and $203.0 million, respectively.<br />
At December 31, <strong>2009</strong>, unrecognized compensation expense related to restricted stock and restricted stock<br />
units totaled $137.4 million. Such unrecognized expense will be recognized on a straight-line basis over a weighted<br />
average period of 3.0 years.<br />
7. Commitments and Contingencies<br />
Letters of Credit. At December 31, <strong>2009</strong>, <strong>EOG</strong> had standby letters of credit and guarantees outstanding<br />
totaling approximately $681 million, of which $407 million represents guarantees of subsidiary indebtedness (see<br />
Note 2) and $274 million primarily represents guarantees of payment obligations on behalf of subsidiaries. At<br />
December 31, 2008, <strong>EOG</strong> had standby letters of credit and guarantees outstanding totaling approximately $568<br />
million, of which $445 million represents guarantees of subsidiary indebtedness and $123 million primarily<br />
represents guarantees of payment obligations on behalf of subsidiaries. As of February 24, 2010, there were no<br />
demands for payment under these guarantees.<br />
Minimum Commitments. At December 31, <strong>2009</strong>, total minimum commitments from long-term noncancelable<br />
operating leases, drilling rig commitments, seismic purchase and other purchase obligations, and pipeline<br />
transportation service commitments, based on current pipeline transportation rates and the foreign currency exchange<br />
rates used to convert Canadian dollars and British pounds into United States dollars at December 31, <strong>2009</strong>, are as<br />
follows (in thousands):<br />
Total Minimum<br />
Commitments<br />
2010 $ 582,385<br />
2011 - 2012 702,166<br />
2013 - 2014 652,454<br />
2015 and beyond 1,221,976<br />
$ 3,158,981<br />
<strong>Inc</strong>luded in the table above are leases for buildings, facilities and equipment with varying expiration dates<br />
through 2022. Rental expenses associated with existing leases amounted to $77 million, $70 million and $60 million<br />
for <strong>2009</strong>, 2008 and 2007, respectively.<br />
Contingencies. There are currently various suits and claims pending against <strong>EOG</strong> that have arisen in the<br />
ordinary course of <strong>EOG</strong>'s business, including contract disputes, personal injury and property damage claims and title<br />
disputes. While the ultimate outcome and impact on <strong>EOG</strong> cannot be predicted with certainty, management believes<br />
that the resolution of these suits and claims will not, individually or in the aggregate, have a material adverse effect<br />
on <strong>EOG</strong>'s consolidated financial position, results of operations or cash flow. <strong>EOG</strong> records reserves for contingencies<br />
when information available indicates that a loss is probable and the amount of the loss can be reasonably estimated.<br />
F-22
8. Net <strong>Inc</strong>ome Per Share Available to Common Stockholders<br />
The following table sets forth the computation of Net <strong>Inc</strong>ome Per Share Available to Common Stockholders<br />
for the years ended December 31, <strong>2009</strong>, 2008 and 2007 (in thousands, except per share data):<br />
<strong>2009</strong> 2008 2007<br />
Numerator for Basic and Diluted Earnings per Share -<br />
Net <strong>Inc</strong>ome $ 546,627 $ 2,436,919 $ 1,089,918<br />
Less: Preferred Stock Dividends - 443 6,663<br />
Net <strong>Inc</strong>ome Available to Common Stockholders $ 546,627 $ 2,436,476 $ 1,083,255<br />
Denominator for Basic Earnings per Share -<br />
Weighted Average Shares 248,996 246,662 243,469<br />
Potential Dilutive Common Shares -<br />
Stock Options/SARs 1,691 2,629 2,915<br />
Restricted Stock and Restricted Stock Units 1,197 1,251 1,253<br />
Denominator for Diluted Earnings per Share -<br />
Adjusted Diluted Weighted Average Shares 251,884 250,542 247,637<br />
Net <strong>Inc</strong>ome Per Share Available to Common Stockholders<br />
Basic $ 2.20 $ 9.88 $ 4.45<br />
Diluted $ 2.17 $ 9.72 $ 4.37<br />
The diluted earnings per share calculation excludes stock options and SARs that were anti-dilutive. The<br />
excluded stock options and SARs totaled 2.5 million, 0.1 million and 2.4 million for the years ended December 31,<br />
<strong>2009</strong>, 2008 and 2007, respectively.<br />
9. Supplemental Cash Flow Information<br />
Cash paid for interest and income taxes, net of refunds received, was as follows for the years ended<br />
December 31, <strong>2009</strong>, 2008 and 2007 (in thousands):<br />
<strong>2009</strong> 2008 2007<br />
Interest $ 100,939 $ 48,029 $ 38,616<br />
<strong>Inc</strong>ome Taxes, Net of Refunds Received $ 51,684 $ 94,598 $ 144,234<br />
Non-cash investing and financing activities for the year ended December 31, <strong>2009</strong> included the following (see<br />
Note 17):<br />
the issuance of 1,450,000 shares of <strong>EOG</strong> common stock valued at $90 million at the transaction closing date in<br />
connection with <strong>EOG</strong>'s purchase of certain proved developed and undeveloped reserves and unproved acreage;<br />
non-cash additions to <strong>EOG</strong>'s oil and gas properties in the amount of $353 million in connection with <strong>EOG</strong>'s<br />
asset exchange agreement; and<br />
non-cash additions to <strong>EOG</strong>'s oil and gas properties in connection with contingent consideration valued at $35<br />
million at December 31, <strong>2009</strong> in connection with <strong>EOG</strong>'s acquisition of certain unproved properties.<br />
10. Business Segment Information<br />
<strong>EOG</strong>'s operations are all natural gas and crude oil exploration and production related. The Segment<br />
<strong>Report</strong>ing Topic of the ASC establishes standards for reporting information about operating segments in annual<br />
financial statements. Operating segments are defined as components of an enterprise about which separate financial<br />
information is available and evaluated regularly by the chief operating decision maker, or decision-making group, in<br />
deciding how to allocate resources and in assessing performance. <strong>EOG</strong>'s chief operating decision making process is<br />
informal and involves the Chairman of the Board and Chief Executive Officer and other key officers. This group<br />
routinely reviews and makes operating decisions related to significant issues associated with each of <strong>EOG</strong>'s major<br />
producing areas in the United States, Canada, Trinidad, the United Kingdom and China. For segment reporting<br />
purposes, the chief operating decision maker considers the major United States producing areas to be one operating<br />
segment.<br />
F-23
Financial information by reportable segment is presented below as of and for the years ended<br />
December 31, <strong>2009</strong>, 2008 and 2007 (in thousands):<br />
United<br />
Other<br />
States Canada Trinidad International Total<br />
<strong>2009</strong><br />
Natural Gas $ 1,540,042 $ 315,792 $ 172,560 $ 22,569 $ 2,050,963<br />
Crude Oil, Condensate and Natural<br />
Gas Liquids 1,192,045 98,118 57,089 1,258 1,348,510<br />
Gains on Mark-to-Market Commodity<br />
Derivative Contracts 431,757 - - - 431,757<br />
Gathering, Processing and Marketing 407,097 - 19 - 407,116<br />
Gains on Property Dispositions, Net 535,295 141 - - 535,436<br />
Other, Net 9,693 (16) 3,500 - 13,177<br />
Net Operating Revenues (2) 4,115,929 414,035 233,168 23,827 4,786,959<br />
Depreciation, Depletion and Amortization 1,282,180 211,514 47,119 8,375 1,549,188<br />
Operating <strong>Inc</strong>ome (Expense) 896,937 (31,767) 143,993 (38,322) 970,841<br />
Interest <strong>Inc</strong>ome 137 612 146 205 1,100<br />
Other <strong>Inc</strong>ome (Expense) (7,396) 5,212 4,387 (1,232) 971<br />
Net Interest Expense 84,411 28,934 1,332 (13,776) 100,901<br />
<strong>Inc</strong>ome Before <strong>Inc</strong>ome Taxes 805,267 (54,877) 147,194 (25,573) 872,011<br />
<strong>Inc</strong>ome Tax Provision (Benefit) 290,473 (27,073) 57,363 4,621 325,384<br />
Additions to Oil and Gas Properties,<br />
Excluding Dry Hole Costs 2,770,482 268,604 31,219 55,235 3,125,540<br />
Total Property, Plant and Equipment, Net 12,769,240 2,740,473 532,989 96,523 16,139,225<br />
Total Assets 14,108,129 2,888,949 813,901 307,688 18,118,667<br />
2008<br />
Natural Gas $ 3,497,620 $ 619,792 $ 285,184 $ 49,462 $ 4,452,058<br />
Crude Oil, Condensate and Natural<br />
Gas Liquids 1,552,163 107,915 107,878 1,970 1,769,926<br />
Gains on Mark-to-Market Commodity<br />
Derivative Contracts 597,911 - - - 597,911<br />
Gathering, Processing and Marketing 164,535 - - - 164,535<br />
Gains (Losses) on Property Dispositions, Net 129,011 (1,894) (3,644) - 123,473<br />
Other, Net 18,193 1,002 45 - 19,240<br />
Net Operating Revenues (2) 5,959,433 726,815 389,463 51,432 7,127,143<br />
Depreciation, Depletion and Amortization 1,100,917 189,796 26,596 9,566 1,326,875<br />
Operating <strong>Inc</strong>ome (Expense) 3,183,547 306,967 286,600 (9,929) 3,767,185<br />
Interest <strong>Inc</strong>ome 1,589 2,703 2,641 1,793 8,726<br />
Other <strong>Inc</strong>ome (Expense) 7,961 (2,111) 18,868 (2,432) 22,286<br />
Net Interest Expense 29,586 27,195 6,150 (11,273) 51,658<br />
<strong>Inc</strong>ome Before <strong>Inc</strong>ome Taxes 3,163,511 280,364 301,959 705 3,746,539<br />
<strong>Inc</strong>ome Tax Provision (Benefit) 1,131,631 68,593 110,242 (846) 1,309,620<br />
Additions to Oil and Gas Properties,<br />
Excluding Dry Hole Costs 4,094,265 464,836 86,907 17,685 4,663,693<br />
Total Property, Plant and Equipment, Net 10,771,911 2,298,823 539,576 46,992 13,657,302<br />
Total Assets 12,668,763 2,421,979 735,387 125,097 15,951,226<br />
F-24
United<br />
Other<br />
States Canada Trinidad International Total<br />
2007<br />
Natural Gas $ 2,220,892 $ 510,473 $ 248,553 $ 52,887 $ 3,032,805<br />
Crude Oil, Condensate and Natural<br />
Gas Liquids 806,037 74,841 104,324 2,321 987,523<br />
Gains on Mark-to-Market Commodity<br />
Derivative Contracts 93,108 - - - 93,108<br />
Gathering, Processing and Marketing 73,539 - - - 73,539<br />
Gains (Losses) on Property Dispositions, Net 43,714 55 (116) (25) 43,628<br />
Other, Net 8,796 (105) (17) 26 8,700<br />
Net Operating Revenues (2) 3,246,086 585,264 352,744 55,209 4,239,303<br />
Depreciation, Depletion and Amortization 848,051 170,666 24,883 21,945 1,065,545<br />
Operating <strong>Inc</strong>ome 1,199,816 197,207 247,638 3,735 1,648,396<br />
Interest <strong>Inc</strong>ome 850 2,474 5,226 1,143 9,693<br />
Other <strong>Inc</strong>ome (Expense) 7,384 (4,348) 16,609 (88) 19,557<br />
Net Interest Expense 20,262 20,391 6,148 (23) 46,778<br />
<strong>Inc</strong>ome Before <strong>Inc</strong>ome Taxes 1,187,788 174,942 263,325 4,813 1,630,868<br />
<strong>Inc</strong>ome Tax Provision (Benefit) 427,531 (6,728) 116,684 3,463 540,950<br />
Additions to Oil and Gas Properties,<br />
Excluding Dry Hole Costs 2,810,265 355,474 109,273 11,592 3,286,604<br />
Total Property, Plant and Equipment, Net 7,364,648 2,543,781 472,096 48,729 10,429,254<br />
Total Assets 8,687,320 2,649,925 692,353 59,309 12,088,907<br />
(1) Other International includes <strong>EOG</strong>'s United Kingdom operations and, effective July 1, 2008, <strong>EOG</strong>'s China operations.<br />
(2) <strong>EOG</strong> had no purchasers in <strong>2009</strong>, 2008 or 2007 whose sales totaled 10 percent or more of consolidated Net Operating Revenues.<br />
11. Risk Management Activities<br />
Commodity Price Risks. <strong>EOG</strong> engages in price risk management activities from time to time. These<br />
activities are intended to manage <strong>EOG</strong>'s exposure to fluctuations in commodity prices for natural gas and crude oil.<br />
<strong>EOG</strong> utilizes financial commodity derivative instruments, primarily price swap, collar and basis swap contracts, as a<br />
means to manage this price risk. In addition to financial transactions, <strong>EOG</strong> is a party to various physical commodity<br />
contracts for the sale of hydrocarbons that cover varying periods of time and have varying pricing provisions. Under<br />
the provisions of ASC Topic 815 (Derivatives and Hedging), these physical commodity contracts qualify for the<br />
normal purchases and normal sales exception and, therefore, are not subject to hedge accounting or mark-to-market<br />
accounting. The financial impact of physical commodity contracts is included in revenues at the time of settlement,<br />
which in turn affects average realized hydrocarbon prices.<br />
During <strong>2009</strong>, 2008 and 2007, <strong>EOG</strong> elected not to designate any of its financial commodity derivative<br />
contracts as accounting hedges and, accordingly, accounted for these financial commodity derivative contracts using<br />
the mark-to-market accounting method. During <strong>2009</strong>, <strong>EOG</strong> recognized net gains on mark-to-market financial<br />
commodity derivative contracts of $432 million, which included net realized gains of $1,278 million. During 2008,<br />
<strong>EOG</strong> recognized net gains on mark-to-market financial commodity derivative contracts of $598 million, which<br />
included net realized losses of $137 million. During 2007, <strong>EOG</strong> recognized net gains on mark-to-market financial<br />
commodity derivative contracts of $93 million, which included net realized gains of $128 million.<br />
At December 31, <strong>2009</strong>, the fair value of <strong>EOG</strong>'s financial commodity derivative contracts was reflected in<br />
the Consolidated Balance Sheets as Current Assets - Assets From Price Risk Management Activities ($21 million),<br />
Current Liabilities - Liabilities from Price Risk Management Activities ($27 million) and Other Liabilities ($10<br />
million). At December 31, 2008, the fair value of <strong>EOG</strong>'s financial commodity derivative contracts was reflected in<br />
the Consolidated Balance Sheets as Current Assets - Assets From Price Risk Management Activities ($779 million),<br />
Other Assets ($57 million), Current Liabilities - Liabilities from Price Risk Management Activities ($4 million) and<br />
Other Liabilities ($8 million).<br />
F-25
Financial Collar Contracts. Presented below is a comprehensive summary of <strong>EOG</strong>'s natural gas financial<br />
collar contracts at December 31, <strong>2009</strong>. The notional volumes are expressed in million British thermal units per day<br />
(MMBtud) and prices are expressed in dollars per million British thermal units ($/MMBtu). The average floor price<br />
of <strong>EOG</strong>'s outstanding natural gas financial collar contracts for 2010 is $10.10 per million British thermal units<br />
(MMBtu) and the average ceiling price is $12.38 per MMBtu.<br />
Natural Gas Financial Collar Contracts<br />
Floor Price<br />
Ceiling Price<br />
Weighted<br />
Weighted<br />
Average Ceiling Average<br />
Volume Floor Range Price Range Price<br />
(MMBtud) ($/MMBtu) ($/MMBtu) ($/MMBtu) ($/MMBtu)<br />
2010<br />
January (closed) 40,000 $11.44 - 11.47 $11.45 $13.79 - 13.90 $13.85<br />
February 40,000 11.38 - 11.41 11.40 13.75 - 13.85 13.80<br />
March 40,000 11.13 - 11.15 11.14 13.50 - 13.60 13.55<br />
April 40,000 9.40 - 9.45 9.42 11.55 - 11.65 11.60<br />
May 40,000 9.24 - 9.29 9.26 11.41 - 11.55 11.48<br />
June 40,000 9.31 - 9.36 9.34 11.49 - 11.60 11.55<br />
On April 29, <strong>2009</strong>, <strong>EOG</strong> settled its natural gas financial collar contracts with notional volumes of 40,000<br />
MMBtud for the July 1, 2010 to December 31, 2010 period and received proceeds of $26.5 million.<br />
Financial Price Swap Contracts. Presented below is a comprehensive summary of <strong>EOG</strong>'s natural gas<br />
financial price swap contracts at December 31, <strong>2009</strong>. The average price of <strong>EOG</strong>'s outstanding natural gas financial<br />
price swap contracts for 2010 is $9.92 per MMBtu.<br />
Natural Gas Financial Price Swap Contracts<br />
Weighted<br />
Volume Average Price<br />
(MMBtud) ($/MMBtu)<br />
2010<br />
January (closed) 20,000 $11.20<br />
February 20,000 11.15<br />
March 20,000 10.89<br />
April 20,000 9.29<br />
May 20,000 9.13<br />
June 20,000 9.21<br />
On April 24, <strong>2009</strong>, <strong>EOG</strong> settled its natural gas financial price swap contracts with notional volumes of<br />
20,000 MMBtud for the July 1, 2010 to December 31, 2010 period and received proceeds of $12.1 million.<br />
F-26
Financial Basis Swap Contracts. Prices received by <strong>EOG</strong> for its natural gas production generally vary from<br />
New York Mercantile Exchange (NYMEX) prices due to adjustments for delivery location (basis) and other factors.<br />
<strong>EOG</strong> has entered into natural gas financial basis swap contracts in order to fix the differential between prices in the<br />
Rocky Mountain area and NYMEX Henry Hub prices. Presented below is a comprehensive summary of <strong>EOG</strong>'s<br />
natural gas financial basis swap contracts at December 31, <strong>2009</strong>. The weighted average price differential represents<br />
the amount of reduction to NYMEX gas prices per MMBtu for the notional volumes covered by the basis swap.<br />
Natural Gas Financial Basis Swap Contracts<br />
Weighted<br />
Average Price<br />
Volume Differential<br />
(MMBtud) ($/MMBtu)<br />
2010<br />
First Quarter (1) 65,000 $(1.72)<br />
Second Quarter 65,000 (2.56)<br />
Third Quarter 65,000 (3.17)<br />
Fourth Quarter 65,000 (3.73)<br />
2011<br />
First Quarter 65,000 $(1.89)<br />
(1) <strong>Inc</strong>ludes closed contracts for the month of January 2010.<br />
Foreign Currency Exchange Rate Risk. <strong>EOG</strong> is party to a foreign currency swap transaction with multiple<br />
banks to eliminate any exchange rate impacts that may result from the $150 million principal amount of notes issued<br />
by one of <strong>EOG</strong>'s Canadian subsidiaries. <strong>EOG</strong> accounts for the foreign currency swap transaction using the hedge<br />
accounting method, pursuant to the provisions of ASC Topic 815. See Note 2.<br />
The following table sets forth the amounts, on a gross basis, and classification of <strong>EOG</strong>'s outstanding<br />
derivative financial instruments at December 31, <strong>2009</strong> and December 31, 2008. Certain amounts may be presented<br />
on a net basis in the consolidated financial statements when such amounts are with the same counterparty and subject<br />
to master netting arrangements (in millions):<br />
Fair Value at<br />
December 31, December 31,<br />
Description Location on Balance Sheet <strong>2009</strong> 2008<br />
Asset Derivatives<br />
Natural gas collars and price swaps -<br />
Current portion<br />
Assets from Price Risk<br />
Management Activities $ 50 $ 786<br />
Noncurrent portion Other Assets $ - $ 63<br />
Liability Derivatives<br />
Natural gas basis swaps -<br />
Current portion<br />
Liabilities from Price Risk<br />
Management Activities $ 57 $ 11<br />
Noncurrent portion Other Liabilities $ 9 $ 14<br />
Foreign currency rate swap -<br />
Noncurrent portion Other Liabilities $ 49 $ 26<br />
F-27
Credit Risk. Notional contract amounts are used to express the magnitude of commodity price and foreign<br />
currency swap agreements. The amounts potentially subject to credit risk, in the event of nonperformance by the<br />
counterparties, are equal to the fair value of such contracts (see Note 12). <strong>EOG</strong> evaluates its exposure to significant<br />
counterparties on an ongoing basis, including those arising from physical and financial transactions. In some<br />
instances, <strong>EOG</strong> requires collateral, parent guarantees or letters of credit to minimize credit risk. At December 31,<br />
<strong>2009</strong>, <strong>EOG</strong>'s net accounts receivable balance related to United States, Canada, and United Kingdom hydrocarbon<br />
sales included one receivable balance which constituted 12% of the total balance. These receivables were due from<br />
a crude oil marketing company. The related amounts were collected during early 2010. At December 31, 2008, no<br />
individual purchaser's net accounts receivable balance related to United States, Canada and United Kingdom<br />
hydrocarbon sales accounted for 10% or more of the total balance. In <strong>2009</strong> and 2008, natural gas from <strong>EOG</strong>'s<br />
Trinidad operations was sold to the National Gas Company of Trinidad and Tobago and natural gas from <strong>EOG</strong>'s<br />
China operations was sold to Petrochina Company Limited.<br />
All of <strong>EOG</strong>'s outstanding derivative instruments are covered by International Swap Dealers Association<br />
Master Agreements (ISDA) with counterparties. The ISDAs may contain provisions that require <strong>EOG</strong>, if it is the<br />
party in a net liability position, to post collateral when the amount of the net liability exceeds the threshold level<br />
specified for <strong>EOG</strong>'s then-current credit ratings. In addition, the ISDAs may also provide that as a result of certain<br />
circumstances, including certain events that cause <strong>EOG</strong>'s credit ratings to become materially weaker than its thencurrent<br />
ratings, the counterparty may require all outstanding derivatives under the ISDA to be settled immediately.<br />
See Note 12 for the aggregate fair value of all derivative instruments with credit-risk related contingent features that<br />
are in a net liability position at December 31, <strong>2009</strong> and 2008. <strong>EOG</strong> had zero collateral posted at both December 31,<br />
<strong>2009</strong> and 2008.<br />
At December 31, <strong>2009</strong> and 2008, <strong>EOG</strong> had an allowance for doubtful accounts of $13 million for both<br />
years of which $11 million for both years were associated with the Enron Corp. bankruptcies in December 2001.<br />
Substantially all of <strong>EOG</strong>'s accounts receivable at December 31, <strong>2009</strong> and 2008 resulted from hydrocarbon<br />
sales and/or joint interest billings to third-party companies, including foreign state-owned entities in the oil and gas<br />
industry. This concentration of customers and joint interest owners may impact <strong>EOG</strong>'s overall credit risk, either<br />
positively or negatively, in that these entities may be similarly affected by changes in economic or other conditions.<br />
In determining whether or not to require collateral or other credit enhancements from a customer or joint interest<br />
owner, <strong>EOG</strong> typically analyzes the entity's net worth, cash flows, earnings and credit ratings. Receivables are<br />
generally not collateralized. During the three-year period ended December 31, <strong>2009</strong>, credit losses incurred on<br />
receivables by <strong>EOG</strong> have been immaterial.<br />
12. Fair Value Measurements<br />
Certain of <strong>EOG</strong>'s financial and nonfinancial assets and liabilities are reported at fair value on the<br />
accompanying Consolidated Balance Sheets. Effective January 1, 2008, <strong>EOG</strong> adopted the provisions of the Fair<br />
Value Measurements and Disclosures Topic of the ASC (ASC Topic 820) for its financial assets and liabilities. ASC<br />
Topic 820 defines fair value, establishes a framework for measuring fair value and expands disclosures about fair<br />
value measurements. To increase consistency and comparability in fair value measurements and related disclosures,<br />
ASC Topic 820 establishes a fair value hierarchy that prioritizes the relative reliability of inputs used in fair value<br />
measurements. The hierarchy gives highest priority to Level 1 inputs that represent unadjusted quoted market prices<br />
in active markets for identical assets and liabilities that the reporting entity has the ability to access at the<br />
measurement date. Level 2 inputs are directly or indirectly observable inputs other than quoted prices included<br />
within Level 1. Level 3 inputs are unobservable inputs and have the lowest priority in the hierarchy. ASC Topic<br />
820 requires that an entity give consideration to the credit risk of its counterparties, as well as its own credit risk,<br />
when measuring financial assets and liabilities at fair value. <strong>EOG</strong> adopted the provisions of ASC Topic 820 relating<br />
to nonfinancial assets and liabilities effective January 1, <strong>2009</strong>.<br />
F-28
The following table provides fair value measurement information within the hierarchy for certain of <strong>EOG</strong>'s<br />
financial assets and liabilities carried at fair value at December 31, <strong>2009</strong> and 2008 (in millions):<br />
Fair Value Measurements Using:<br />
Quoted Significant<br />
Prices in Other Significant<br />
Active Observable Unobservable<br />
Markets Inputs Inputs<br />
(Level 1) (Level 2) (Level 3) Total<br />
At December 31, <strong>2009</strong><br />
Financial Assets:<br />
Natural gas collars, price swaps<br />
and basis swaps $ - $ 21 $ - $ 21<br />
Financial Liabilities:<br />
Natural gas collars, price swaps<br />
and basis swaps $ - $ 37 $ - $ 37<br />
Foreign currency rate swap - 49 - 49<br />
Contingent consideration (see Note 17) - - 35 35<br />
At December 31, 2008<br />
Financial Assets:<br />
Natural gas collars, price swaps<br />
and basis swaps $ - $ 836 $ - $ 836<br />
Financial Liabilities:<br />
Natural gas collars, price swaps<br />
and basis swaps $ - $ 12 $ - $ 12<br />
Foreign currency rate swap - 26 - 26<br />
The estimated fair value of natural gas collar, price swap and basis swap contracts was based upon forward<br />
commodity price curves based on quoted market prices. The estimated fair value of the foreign currency rate swap<br />
was based upon forward currency rates.<br />
In connection with the acquisition of certain unproved acreage in Nacogdoches County, Texas, during the<br />
fourth quarter of <strong>2009</strong>, <strong>EOG</strong> could be required to make an additional one-time payment to the sellers contingent<br />
upon future natural gas prices over a five year period (see Note 17). <strong>EOG</strong> recorded the fair value of the contingent<br />
consideration using present value techniques based upon an assessment of the probability that <strong>EOG</strong> would be<br />
required to make such future payment. Level 3 inputs used in such assessment include <strong>EOG</strong>'s internal estimates of<br />
future natural gas prices and an appropriate risk-adjusted discount rate.<br />
In connection with an exchange of certain natural gas properties during the fourth quarter of <strong>2009</strong> (see Note<br />
17), <strong>EOG</strong> recorded oil and gas properties with a fair value of $545 million. Significant Level 3 inputs used in<br />
determining the fair value of the properties received in the exchange transaction included <strong>EOG</strong>'s estimate of future<br />
natural gas prices, production costs, development expenditures, anticipated production of proved reserves,<br />
appropriate risk-adjusted discount rates and other relevant data.<br />
The initial measurement of asset retirement obligations at fair value is calculated using discounted cash flow<br />
techniques and based on internal estimates of future retirement costs associated with oil and gas properties.<br />
Significant Level 3 inputs used in the calculation of asset retirement obligations include plugging costs and reserve<br />
lives. A reconciliation of <strong>EOG</strong>'s asset retirement obligations is presented in Note 14.<br />
Proved oil and gas properties with a carrying amount of $307 million were written down to their fair value<br />
of $213 million, resulting in a pretax impairment charge of $94 million for the year ended December 31, <strong>2009</strong>.<br />
Significant Level 3 assumptions associated with the calculation of discounted cash flows used in the impairment<br />
analysis include <strong>EOG</strong>'s estimate of future natural gas and crude oil prices, production costs, development<br />
expenditures, anticipated production of proved reserves, appropriate risk-adjusted discount rates and other relevant<br />
data. See Note 13.<br />
F-29
13. Accounting for Certain Long-Lived Assets<br />
<strong>EOG</strong> reviews its proved oil and gas properties for impairment purposes by comparing the expected<br />
undiscounted future cash flows at a producing field level to the unamortized capitalized cost of the asset. During<br />
<strong>2009</strong>, 2008 and 2007, such reviews indicated that unamortized capitalized costs of certain properties were higher<br />
than their expected undiscounted future cash flows due primarily to downward reserve revisions, drilling of marginal<br />
or uneconomic wells, or development dry holes in certain producing fields. As a result, <strong>EOG</strong> recorded pretax<br />
charges of $90 million, $58 million and $60 million in the United States operating segment during <strong>2009</strong>, 2008 and<br />
2007, respectively, and $4 million, $2 million and $22 million in the Canada operating segment during <strong>2009</strong>, 2008<br />
and 2007, respectively. Additionally, during 2008, <strong>EOG</strong> recorded pretax charges of $20 million and $6 million in<br />
the Trinidad and United Kingdom operating segments, respectively. The pretax charges are included in Impairments<br />
on the Consolidated Statements of <strong>Inc</strong>ome and Comprehensive <strong>Inc</strong>ome. The carrying values for assets determined to<br />
be impaired were adjusted to estimated fair values based on projected future net cash flows discounted using an<br />
appropriate risk-adjusted discount rate. Amortization of unproved oil and gas property costs, including amortization<br />
of capitalized interest, was $212 million, $107 million and $66 million for <strong>2009</strong>, 2008 and 2007, respectively.<br />
14. Asset Retirement Obligations<br />
The following table presents the reconciliation of the beginning and ending aggregate carrying amounts of<br />
short-term and long-term legal obligations associated with the retirement of property, plant and equipment for the<br />
years ended December 31, <strong>2009</strong> and 2008 (in thousands):<br />
<strong>2009</strong> 2008<br />
Carrying Amount at Beginning of Period $ 368,159 $ 211,124<br />
Liabilities <strong>Inc</strong>urred 70,932 58,942<br />
Liabilities Settled (29,920) (18,813)<br />
Accretion 24,218 15,356<br />
Revisions (1) 10,564 111,112<br />
Foreign Currency Translations 12,531 (9,562)<br />
Carrying Amount at End of Period $ 456,484 $ 368,159<br />
Current Portion $ 29,630 $ 19,459<br />
Noncurrent Portion $ 426,854 $ 348,700<br />
(1) Revisions to asset retirement obligations primarily reflect changes in abandonment cost estimates.<br />
The current and noncurrent portions of <strong>EOG</strong>'s asset retirement obligations are included in Current Liabilities -<br />
Other and Other Liabilities, respectively, on the Consolidated Balance Sheets.<br />
15. Investment in Caribbean Nitrogen Company Limited and Nitrogen (2000) Unlimited<br />
<strong>EOG</strong>, through certain wholly-owned subsidiaries, owns equity interests in two Trinidadian companies:<br />
Caribbean Nitrogen Company Limited (CNCL) and Nitrogen (2000) Unlimited (N2000). At December 31, <strong>2009</strong>,<br />
<strong>EOG</strong>'s equity interests in CNCL and N2000 were 12% and 10%, respectively.<br />
At December 31, <strong>2009</strong>, the investment in CNCL was $22 million. CNCL commenced ammonia production<br />
in June 2002. At December 31, <strong>2009</strong>, CNCL had a long-term debt balance of $59 million, which is non-recourse to<br />
CNCL's shareholders. <strong>EOG</strong> would be liable for its share of any post-completion deficiency funds, loans to fund the<br />
costs of operation, payment of principal and interest to the principal creditor and other cash deficiencies of CNCL up<br />
to $15 million, approximately $2 million of which is net to <strong>EOG</strong>'s interest. Since inception, there have been no<br />
borrowings under this agreement. The shareholders' agreement governing CNCL requires the consent of the holders<br />
of 90% or more of the shares to take certain material actions. Accordingly, given its current level of equity<br />
ownership, <strong>EOG</strong> is able to exercise significant influence over the operating and financial policies of CNCL and,<br />
therefore, it accounts for the investment using the equity method. During <strong>2009</strong>, <strong>EOG</strong> recognized equity income of<br />
$0.5 million and received cash dividends of $3 million from CNCL.<br />
F-30
At December 31, <strong>2009</strong>, the investment in N2000 was $19 million. N2000 commenced ammonia production<br />
in August 2004. At December 31, <strong>2009</strong>, N2000 had a long-term debt balance of $74 million, which is non-recourse<br />
to N2000's shareholders. <strong>EOG</strong> would be liable for its share of any post-completion deficiency funds, loans to fund<br />
the costs of operation, payment of principal and interest to the principal creditor and other cash deficiencies of<br />
N2000 up to $15 million, approximately $2 million of which is net to <strong>EOG</strong>'s interest. Since inception, there have<br />
been no borrowings under this agreement. The shareholders' agreement governing N2000 requires the consent of the<br />
holders of 100% of the shares to take certain material actions. Accordingly, given its current level of equity<br />
ownership, <strong>EOG</strong> is able to exercise significant influence over the operating and financial policies of N2000 and,<br />
therefore, it accounts for the investment using the equity method. During <strong>2009</strong>, <strong>EOG</strong> recognized equity income of<br />
$3 million and received cash dividends of $4 million from N2000.<br />
16. Suspended Well Costs<br />
<strong>EOG</strong>'s net changes in suspended well costs for the years ended December 31, <strong>2009</strong>, 2008 and 2007 are<br />
presented below (in thousands):<br />
Year Ended December 31,<br />
<strong>2009</strong> 2008 2007<br />
Balance at January 1 $ 85,255 $ 148,881 $ 77,365<br />
Additions Pending the Determination of Proved Reserves 75,362 96,698 132,993<br />
Reclassifications to Proved Properties (40,614) (120,110) (23,716)<br />
Charged to Dry Hole Costs (11,223) (22,116) (18,232)<br />
Foreign Currency Translations 9,679 (18,098) 6,105<br />
Other - - (25,634)<br />
Balance at December 31 $ 118,459 $ 85,255 $ 148,881<br />
(1)<br />
(1) During 2007, <strong>EOG</strong> decided to no longer participate in the further evaluation of the Northwest Territories discovery and sold all<br />
of its interest to the outside operator for $5 million. Prior to the sale, <strong>EOG</strong> recorded an impairment charge of approximately $21<br />
million.<br />
The following table provides an aging of suspended well costs at December 31, <strong>2009</strong>, 2008 and 2007 (in<br />
thousands, except well count):<br />
Year Ended December 31,<br />
<strong>2009</strong> 2008 2007<br />
Capitalized exploratory well costs that have been<br />
capitalized for a period less than one year $ 51,141 $ 31,784 $ 97,624<br />
Capitalized exploratory well costs that have been<br />
capitalized for a period greater than one year 67,318<br />
(1)<br />
53,471<br />
(2)<br />
51,257<br />
Total $ 118,459 $ 85,255 $ 148,881<br />
Number of exploratory wells that have been capitalized<br />
for a period greater than one year 4 3 2<br />
(3)<br />
(1) Consists of costs related to three shale projects in British Columbia, Canada (B.C.) ($45 million) and an outside operated,<br />
offshore Central North Sea project in the United Kingdom (U.K.) ($22 million). In the B.C. shale projects, <strong>EOG</strong> is currently<br />
evaluating infrastructure alternatives for delivery of product. In the Central North Sea project, <strong>EOG</strong> is currently evaluating an<br />
export route for production from the project. The operator expects to submit a revised field development plan to the U.K.<br />
Department of Energy and Climate Change during the second quarter of 2010 and anticipates approval in late 2010.<br />
(2) Costs related to two shale projects in British Columbia, Canada (B.C.) ($35 million) and an outside operated, offshore Central<br />
North Sea project in the United Kingdom ($19 million).<br />
(3) Costs related to a shale project in B.C. ($38 million) and an outside operated, offshore Central North Sea project in the United<br />
Kingdom ($13 million).<br />
F-31
17. Property Acquisitions and Divestitures<br />
In December <strong>2009</strong>, <strong>EOG</strong> and a third party entered into an asset exchange agreement whereby the two<br />
parties exchanged certain natural gas related properties in the Rocky Mountain area. In accordance with provisions<br />
of ASC Topic 805 (Business Combinations), <strong>EOG</strong> realized a pretax gain of $390 million on the exchange to reflect<br />
the excess of the fair value of the properties received over the book basis of the properties given up in the transaction<br />
(see Note 12).<br />
In November <strong>2009</strong>, <strong>EOG</strong> entered into an agreement to sell its crude oil and natural gas related assets<br />
located in California for consideration of $202 million subject to customary adjustments under the agreement. The<br />
assets sold accounted for less than 1% of <strong>EOG</strong>'s total <strong>2009</strong> production. The transaction closed on December 10,<br />
<strong>2009</strong>. <strong>EOG</strong> realized a pretax gain of approximately $146 million on the sale.<br />
In October <strong>2009</strong>, <strong>EOG</strong> entered into an agreement to acquire unproved acreage located in Nacogdoches<br />
County, Texas within the Haynesville and Bossier Shale formations (Haynesville Assets). <strong>EOG</strong> acquired a portion<br />
of the unproved acreage at the principal and supplemental closings held in October <strong>2009</strong> and December <strong>2009</strong>,<br />
respectively. The acquisition agreement provides for an additional one-time supplemental cash payment to the<br />
sellers of the Haynesville Assets that is contingent on the satisfaction of certain conditions (within a five-year period<br />
beginning on the principal closing date) set forth in the acquisition agreement with respect to future natural gas<br />
prices. <strong>EOG</strong> estimated the fair value of the contingent consideration as of the acquisition dates in accordance with<br />
the provisions of the ASC Topic 805 and has included such amount in Other Liabilities on the Consolidated Balance<br />
Sheets. The fair value of such contingent consideration was $35 million at December 31, <strong>2009</strong> (see Note 12). The<br />
aggregate consideration recorded in <strong>2009</strong> for the acquisition of the Haynesville Assets was $134 million, including<br />
the contingent consideration.<br />
During the third quarter of <strong>2009</strong>, <strong>EOG</strong> completed three transactions to acquire certain crude oil and natural<br />
gas properties and related assets located in Montague and Cooke Counties, Texas (Barnett Shale Combo Assets).<br />
The Barnett Shale Combo Assets consist of proved developed and undeveloped reserves and unproved acreage. The<br />
aggregate purchase price of the transactions totaled $197 million, consisting of cash consideration of $107 million<br />
and 1,450,000 shares of <strong>EOG</strong> common stock valued at $89.6 million on the closing date of the applicable<br />
transaction.<br />
In February 2008, <strong>EOG</strong> completed a sale of the majority of its producing shallow gas assets and<br />
surrounding acreage in the Appalachian Basin to a subsidiary of EXCO <strong>Resources</strong>, <strong>Inc</strong>., an independent oil and gas<br />
company. The Appalachian area divested included approximately 2,400 operated wells that accounted for<br />
approximately 1% of <strong>EOG</strong>'s total 2007 production and approximately 2% of its total year-end 2007 proved reserves.<br />
Proceeds on the sale totaled $386 million and <strong>EOG</strong> realized a pretax gain of $128 million on the sale.<br />
F-32
<strong>EOG</strong> RESOURCES, INC.<br />
SUPPLEMENTAL INFORMATION TO CONSOLIDATED FINANCIAL STATEMENTS<br />
(In Thousands, Except Per Share Data Unless Otherwise Indicated)<br />
(Unaudited)<br />
Oil and Gas Producing Activities<br />
In December 2008, the United States Securities and Exchange Commission (SEC) released a final rule,<br />
"Modernization of Oil and Gas <strong>Report</strong>ing," which amends the oil and gas reporting requirements effective January 1,<br />
2010. The key revisions include:<br />
using a 12-month average price to determine reserves;<br />
including nontraditional resources in reserves if they are intended to be upgraded to synthetic oil and<br />
gas;<br />
the ability to use reliable technologies to determine and estimate reserves;<br />
permitting the optional disclosure of probable and possible reserves;<br />
reporting the independence and qualifications of the reserve preparer or auditor and filing a report as an<br />
exhibit when a third party is relied upon to prepare reserve estimates or conduct reserve audits; and<br />
disclosing the development of any proved undeveloped reserves, including the total quantity of proved<br />
undeveloped reserves at year-end, material changes to proved undeveloped reserves during the year,<br />
investments and progress toward the development of proved undeveloped reserves and an explanation<br />
of the reasons why material concentrations of proved undeveloped reserves have remained<br />
undeveloped for five years or more after disclosure as proved undeveloped reserves<br />
In January 2010, the Financial Accounting Standards Board (FASB) issued FASB Accounting Standards<br />
Update (ASU) No. 2010-03, "Oil and Gas Reserve Estimations and Disclosures" (ASU No. 2010-03). This update<br />
aligns the current oil and gas reserve estimation and disclosure requirements of the Extractive Industries - Oil and<br />
Gas topic of the FASB Accounting Standards Codification (ASC Topic 932) with the changes required by the SEC<br />
final rule, "Modernization of Oil and Gas <strong>Report</strong>ing." ASU No. 2010-03 must be applied prospectively as a change<br />
in accounting principle that is inseparable from a change in accounting estimate and is effective for entities with<br />
annual reporting periods ending on or after December 31, <strong>2009</strong>.<br />
Oil and Gas Reserves. Users of this information should be aware that the process of estimating quantities of<br />
"proved," "proved developed" and "proved undeveloped" natural gas and liquids reserves is very complex, requiring<br />
significant subjective decisions in the evaluation of all available geological, engineering and economic data for each<br />
reservoir. The data for a given reservoir may also change substantially over time as a result of numerous factors<br />
including, but not limited to, additional development activity, evolving production history and continual reassessment of<br />
the viability of production under varying economic conditions. Consequently, material revisions (upward or downward)<br />
to existing reserve estimates may occur from time to time. Although every reasonable effort is made to ensure that<br />
reserve estimates reported represent the most accurate assessments possible, the significance of the subjective decisions<br />
required and variances in available data for various reservoirs make these estimates generally less precise than other<br />
estimates presented in connection with financial statement disclosures. See ITEM 1A. Risk Factors.<br />
Proved reserves represent estimated quantities of natural gas and liquids that geoscience and engineering data<br />
can estimate with reasonable certainty, to be economically producible from a given day forward from known reservoirs<br />
under economic conditions, operating methods and government regulation before the time at which contracts providing<br />
the right to operate expire, unless evidence indicates that renewal is reasonably certain, regardless of whether<br />
deterministic or probabilistic methods are used for the estimation.<br />
F-33
<strong>EOG</strong> RESOURCES, INC.<br />
SUPPLEMENTAL INFORMATION TO CONSOLIDATED FINANCIAL STATEMENTS (Continued)<br />
Proved developed reserves are proved reserves expected to be recovered under operating methods being<br />
utilized at the time the estimates were made, through wells and equipment in place or if the cost of any required<br />
equipment is relatively minor compared to the cost of a new well.<br />
Proved undeveloped reserves are reserves that are expected to be recovered from new wells on undrilled<br />
acreage, or from existing wells where a relatively major expenditure is required. Reserves on undrilled acreage are<br />
limited to those directly offsetting development spacing areas that are reasonably certain of production when drilled,<br />
unless evidence using reliable technology exists that establishes reasonable certainty of economic producibility at greater<br />
distances. Undrilled locations can be classified as having undeveloped reserves only if a development plan has been<br />
adopted indicating that they are scheduled to be drilled within five years, unless the specific circumstances justify a<br />
longer time. Estimates for proved undeveloped reserves are not attributed to any acreage for which an application of<br />
fluid injection or other improved recovery technique is contemplated, unless such techniques have been proved effective<br />
by actual projects in the same reservoir or an analogous reservoir, or by other evidence using reliable technology<br />
establishing reasonable certainty.<br />
In making estimates of proved undeveloped reserves, <strong>EOG</strong> engineers and geoscientists performed detailed<br />
technical analysis of each potential drilling location within its entire inventory of prospects. In making a<br />
determination as to which of these locations would penetrate undrilled portions of a reservoir that can be judged,<br />
with reasonable certainty, to be continuous and contain economically producible oil and gas, studies were conducted<br />
employing numerous data elements and analysis techniques. Such data elements and analysis techniques included,<br />
but were not limited to, a combination of seismic data and interpretation, as well as comprehensive sets of wireline<br />
logs and/or core data and transient analysis techniques applied to pressure and production data from existing<br />
producing wells. <strong>EOG</strong> has found that studies conducted using the previously mentioned combination of data<br />
elements and analysis techniques have been proven effective based on application in analogous reservoirs.<br />
<strong>EOG</strong> has formulated development plans for all proved undeveloped locations. In these plans, substantially<br />
all of the proved undeveloped locations will be developed within the next five years. Those few locations developed<br />
in year six or later are located in areas in which <strong>EOG</strong> has a demonstrated track record of continuous development<br />
activity that exceeds the length of the current development plan.<br />
Canadian provincial royalties are determined based on a graduated percentage scale which varies with prices,<br />
production volumes and the length, both vertical and horizontal, of wells. Canadian reserves, as presented on a net<br />
basis, assume prices and legislated future royalty rates and <strong>EOG</strong>'s estimate of future production volumes. Similarly,<br />
certain of <strong>EOG</strong>'s Trinidad reserves are held under production sharing contracts where <strong>EOG</strong>'s interest varies with prices<br />
and production volumes. Trinidad reserves, as presented on a net basis, assume prices in existence at the time the<br />
estimates were made and <strong>EOG</strong>'s estimate of future production volumes. Future fluctuations in prices, production rates or<br />
changes in political or regulatory environments could cause <strong>EOG</strong>'s share of future production from Canadian and<br />
Trinidadian reserves to be materially different from that presented.<br />
Estimates of proved reserves at December 31, <strong>2009</strong>, 2008 and 2007 were based on studies performed by the<br />
engineering staff of <strong>EOG</strong>. The Engineering and Acquisitions Department is directly responsible for <strong>EOG</strong>'s reserve<br />
evaluation process and consists of seven professionals, all of whom hold, at a minimum, bachelor's degrees in<br />
engineering and three are Registered Professional Engineers. The Manager – Engineering and Acquisitions is the<br />
manager of this department and is the primary technical person responsible for this process. The Manager – Engineering<br />
and Acquisitions holds a Bachelor of Science degree in Petroleum Engineering, has 24 years of experience in reserve<br />
evaluations and is a Registered Professional Engineer in the State of Texas.<br />
F-34
<strong>EOG</strong> RESOURCES, INC.<br />
SUPPLEMENTAL INFORMATION TO CONSOLIDATED FINANCIAL STATEMENTS (Continued)<br />
<strong>EOG</strong>'s reserves estimation process is a collaborative effort coordinated by the Engineering and Acquisitions<br />
Department in compliance with <strong>EOG</strong>'s internal controls for such process. Reserve information as well as models used to<br />
estimate such reserves are stored on secured databases. Non-technical inputs used in reserve estimation models,<br />
including natural gas, natural gas liquids and crude oil prices, production costs, future capital expenditures and <strong>EOG</strong>'s<br />
net ownership percentages are obtained from other departments within <strong>EOG</strong>. <strong>EOG</strong>'s Internal Audit Department<br />
conducts testing with respect to such non-technical inputs. Additionally, <strong>EOG</strong> engages DeGolyer and MacNaughton<br />
(D&M), independent petroleum consultants, to perform independent reserves evaluation of select <strong>EOG</strong> properties of not<br />
less than 75 percent of proved reserves. <strong>EOG</strong>'s Board of Directors requires that D&M's and <strong>EOG</strong>'s reserve quantities<br />
for the properties evaluated by D&M vary by no more than 5 percent in the aggregate. Once completed, <strong>EOG</strong>'s year-end<br />
reserves are presented to senior management, including the Chairman of the Board and Chief Executive Officer, the<br />
Senior Executive Vice President, Exploration, the Senior Executive Vice President, Operations, the Executive Vice<br />
President, Exploration and the Vice President and Chief Financial Officer for approval.<br />
Opinions by D&M for the years ended December 31, <strong>2009</strong>, 2008 and 2007 covered producing areas containing<br />
81%, 79% and 79%, respectively, of proved reserves of <strong>EOG</strong> on a net-equivalent-cubic-feet-of-gas basis. D&M's<br />
opinions indicate that the estimates of proved reserves prepared by <strong>EOG</strong>'s Engineering and Acquisitions Department for<br />
the properties reviewed by D&M, when compared in total on a net-equivalent-cubic-feet-of-gas basis, do not differ<br />
materially from the estimates prepared by D&M. Such estimates by D&M in the aggregate varied by not more than 5%<br />
from those prepared by the Engineering and Acquisitions Department of <strong>EOG</strong>. All reports by D&M were developed<br />
utilizing geological and engineering data provided by <strong>EOG</strong>. The report of D&M dated February 4, 2010, which<br />
contains further discussion of the reserve estimates and evaluations prepared by D&M as well as the qualifications of<br />
D&M's technical person primarily responsible for overseeing such estimates and evaluations, is attached as Exhibit<br />
23.2 to this <strong>Annual</strong> <strong>Report</strong> on Form 10-K and incorporated herein by reference.<br />
No major discovery or other favorable or adverse event subsequent to December 31, <strong>2009</strong> is believed to have<br />
caused a material change in the estimates of proved or proved developed reserves as of that date.<br />
F-35
<strong>EOG</strong> RESOURCES, INC.<br />
SUPPLEMENTAL INFORMATION TO CONSOLIDATED FINANCIAL STATEMENTS (Continued)<br />
The following tables set forth <strong>EOG</strong>'s net proved and proved developed reserves at December 31 for each of the<br />
four years in the period ended December 31, <strong>2009</strong>, and the changes in the net proved reserves for each of the three years<br />
in the period ended December 31, <strong>2009</strong>, as estimated by the Engineering and Acquisitions Department of <strong>EOG</strong>:<br />
NET PROVED RESERVES<br />
NET PROVED AND PROVED DEVELOPED RESERVE SUMMARY<br />
United<br />
Other<br />
States Canada Trinidad International Total<br />
Natural Gas (Bcf) (2)<br />
Net proved reserves at December 31, 2006 3,470.9 1,309.6 1,295.4 19.0 6,094.9<br />
Revisions of previous estimates (63.2) (64.3) (16.9) 2.5 (141.9)<br />
Purchases in place 1.2 1.2 29.6 - 32.0<br />
Extensions, discoveries and other additions 1,177.5 54.9 - - 1,232.4<br />
Sales in place (5.7) - - - (5.7)<br />
Production (360.6) (81.6) (91.8) (8.6) (542.6)<br />
Net proved reserves at December 31, 2007 4,220.1 1,219.8 1,216.3 12.9 6,669.1<br />
Revisions of previous estimates (110.3) 22.9 62.2 (4.2) (29.4)<br />
Purchases in place 31.0 15.0 - 12.2 58.2<br />
Extensions, discoveries and other additions 1,384.4 60.6 - - 1,445.0<br />
Sales in place (200.2) - - - (200.2)<br />
Production (436.0) (81.1) (80.4) (6.0) (603.5)<br />
Net proved reserves at December 31, 2008 4,889.0 1,237.2 1,198.1 14.9 7,339.2<br />
Revisions of previous estimates (378.0) (447.2) (104.9) 3.0 (927.1)<br />
Purchases in place 450.8 - - - 450.8<br />
Extensions, discoveries and other additions 1,925.0 846.5 - - 2,771.5<br />
Sales in place (114.4) (5.1) - - (119.5)<br />
Production (422.3) (81.9) (107.4) (5.2) (616.8)<br />
Net proved reserves at December 31, <strong>2009</strong> 6,350.1 1,549.5 985.8 12.7 8,898.1<br />
F-36
<strong>EOG</strong> RESOURCES, INC.<br />
SUPPLEMENTAL INFORMATION TO CONSOLIDATED FINANCIAL STATEMENTS (Continued)<br />
United<br />
Other<br />
States Canada Trinidad International Total<br />
Liquids (MBbl) (3)<br />
Net proved reserves at December 31, 2006 96,616 9,580 11,504 62 117,762<br />
Revisions of previous estimates 27,933 1,169 (1,179) 20 27,943<br />
Purchases in place 37 - 69 - 106<br />
Extensions, discoveries and other additions 49,418 886 - - 50,304<br />
Sales in place (940) - - - (940)<br />
Production (13,043) (1,269) (1,494) (35) (15,841)<br />
Net proved reserves at December 31, 2007 160,021 10,366 8,900 47 179,334<br />
Revisions of previous estimates (1,592) 854 403 (20) (355)<br />
Purchases in place 6 - 184 58 248<br />
Extensions, discoveries and other additions 67,877 919 - - 68,796<br />
Sales in place (495) - - - (495)<br />
Production (19,971) (1,344) (1,161) (20) (22,496)<br />
Net proved reserves at December 31, 2008 205,846 10,795 8,326 65 225,032<br />
Revisions of previous estimates 10,511 (1,109) (1,760) 17 7,659<br />
Purchases in place 21,467 - - - 21,467<br />
Extensions, discoveries and other additions 76,804 19,807 - - 96,611<br />
Sales in place (8,973) (50) - - (9,023)<br />
Production (25,714) (1,885) (1,123) (24) (28,746)<br />
Net proved reserves at December 31, <strong>2009</strong> 279,941 27,558 5,443 58 313,000<br />
Liquids - <strong>2009</strong><br />
Crude Oil (MBbl)<br />
Net proved reserves at December 31, 2008 133,362 7,498 8,326 65 149,251<br />
Revisions of previous estimates 4,402 (183) (1,760) 17 2,476<br />
Purchases in place 15,666 - - - 15,666<br />
Extensions, discoveries and other additions 58,258 19,783 - - 78,041<br />
Sales in place (5,742) (20) - - (5,762)<br />
Production (17,494) (1,492) (1,123) (24) (20,133)<br />
Net proved reserves at December 31, <strong>2009</strong> 188,452 25,586 5,443 58 219,539<br />
Natural Gas Liquids (MBbl)<br />
Net proved reserves at December 31, 2008 72,484 3,297 - - 75,781<br />
Revisions of previous estimates 6,109 (926) - - 5,183<br />
Purchases in place 5,801 - - - 5,801<br />
Extensions, discoveries and other additions 18,546 24 - - 18,570<br />
Sales in place (3,231) (30) - - (3,261)<br />
Production (8,220) (393) - - (8,613)<br />
Net proved reserves at December 31, <strong>2009</strong> 91,489 1,972 - - 93,461<br />
F-37
<strong>EOG</strong> RESOURCES, INC.<br />
SUPPLEMENTAL INFORMATION TO CONSOLIDATED FINANCIAL STATEMENTS (Continued)<br />
United<br />
Other<br />
States Canada Trinidad International Total<br />
Bcf Equivalent (Bcfe) (2)<br />
Net proved reserves at December 31, 2006 4,050.6 1,367.1 1,364.4 19.4 6,801.5<br />
Revisions of previous estimates 104.4 (57.3) (23.9) 2.6 25.8<br />
Purchases in place 1.5 1.2 30.0 - 32.7<br />
Extensions, discoveries and other additions 1,474.0 60.2 - - 1,534.2<br />
Sales in place (11.4) - - - (11.4)<br />
Production (438.9) (89.2) (100.8) (8.8) (637.7)<br />
Net proved reserves at December 31, 2007 5,180.2 1,282.0 1,269.7 13.2 7,745.1<br />
Revisions of previous estimates (119.9) 28.1 64.7 (4.3) (31.4)<br />
Purchases in place 31.1 15.0 1.1 12.5 59.7<br />
Extensions, discoveries and other additions 1,791.6 66.1 - - 1,857.7<br />
Sales in place (203.2) - - - (203.2)<br />
Production (555.8) (89.2) (87.4) (6.1) (738.5)<br />
Net proved reserves at December 31, 2008 6,124.0 1,302.0 1,248.1 15.3 8,689.4<br />
Revisions of previous estimates (314.9) (453.8) (115.5) 3.1 (881.1)<br />
Purchases in place 579.6 - - - 579.6<br />
Extensions, discoveries and other additions 2,385.8 965.3 - - 3,351.1<br />
Sales in place (168.2) (5.4) - - (173.6)<br />
Production (576.6) (93.2) (114.1) (5.4) (789.3)<br />
Net proved reserves at December 31, <strong>2009</strong> 8,029.7 1,714.9 1,018.5 13.0 10,776.1<br />
<strong>EOG</strong>'s revisions of previous estimates for <strong>2009</strong> of negative 881.1 Bcfe included negative revisions of<br />
approximately 786.0 Bcfe which were primarily due to the decrease in the average natural gas price used in the<br />
December 31, <strong>2009</strong> reserves estimation as compared to the price used in the prior year estimate.<br />
Purchases in place include the reserves acquired in the Rocky Mountain property exchange and the<br />
acquisition of the Barnett Shale Combo Assets in Montague and Cooke Counties, Texas. Sales in place primarily<br />
include reserves from the properties relinquished in the Rocky Mountain property exchange and from the California<br />
asset sale. See Note 17.<br />
F-38
<strong>EOG</strong> RESOURCES, INC.<br />
SUPPLEMENTAL INFORMATION TO CONSOLIDATED FINANCIAL STATEMENTS (Continued)<br />
NET PROVED DEVELOPED RESERVES<br />
United<br />
Other<br />
States Canada Trinidad International Total<br />
Natural Gas (Bcf) (2)<br />
December 31, 2006 2,416.2 1,162.2 610.0 19.0 4,207.4<br />
December 31, 2007 3,141.8 1,079.1 916.7 12.9 5,150.5<br />
December 31, 2008 3,544.7 1,103.7 889.0 14.9 5,552.3<br />
December 31, <strong>2009</strong> 3,330.1 681.0 609.4 12.7 4,633.2<br />
Liquids (MBbl) (3)<br />
December 31, 2006 79,555 9,427 6,119 62.0 95,163<br />
December 31, 2007 119,949 10,193 7,222 47.0 137,411<br />
December 31, 2008 159,607 10,416 6,756 65.0 176,844<br />
December 31, <strong>2009</strong> 189,322 10,831 3,966 58.0 204,177<br />
Bcf Equivalents (Bcfe) (2)<br />
December 31, 2006 2,893.5 1,218.8 646.7 19.4 4,778.4<br />
December 31, 2007 3,861.5 1,140.3 960.0 13.2 5,975.0<br />
December 31, 2008 4,502.3 1,166.2 929.6 15.3 6,613.4<br />
December 31, <strong>2009</strong> 4,466.0 745.9 633.3 13.0 5,858.2<br />
NET PROVED UNDEVELOPED RESERVES<br />
Natural Gas (Bcf) (2)<br />
December 31, 2006 1,054.8 147.4 685.3 - 1,887.5<br />
December 31, 2007 1,078.3 140.7 299.6 - 1,518.6<br />
December 31, 2008 1,344.3 133.6 309.0 - 1,786.9<br />
December 31, <strong>2009</strong> 3,020.0 868.5 376.4 - 4,264.9<br />
Liquids (MBbl) (3)<br />
December 31, 2006 17,060 154 5,385 - 22,599<br />
December 31, 2007 40,072 173 1,678 - 41,923<br />
December 31, 2008 46,239 379 1,570 - 48,188<br />
December 31, <strong>2009</strong> 90,619 16,727 1,477 - 108,823<br />
Bcf Equivalents (Bcfe) (2)<br />
December 31, 2006 1,157.1 148.3 717.7 - 2,023.1<br />
December 31, 2007 1,318.7 141.7 309.7 - 1,770.1<br />
December 31, 2008 1,621.7 135.9 318.4 - 2,076.0<br />
December 31, <strong>2009</strong> 3,563.7 969.0 385.2 - 4,917.9<br />
(1) <strong>Inc</strong>ludes <strong>EOG</strong>'s United Kingdom operations and, effective July 1, 2008, <strong>EOG</strong>'s China operations.<br />
(2) Billion cubic feet or billion cubic feet equivalent, as applicable. Natural gas equivalents are determined using the ratio of 6.0<br />
thousand cubic feet of natural gas to 1.0 barrel of crude oil and condensate or natural gas liquids.<br />
(3) Thousand barrels; includes crude oil and condensate and natural gas liquids.<br />
For the twelve-month period ended December 31, <strong>2009</strong>, total proved undeveloped reserves increased by<br />
2,841.9 Bcfe to 4,917.9 Bcfe. Based on the new definition of proved undeveloped reserves and its applicability to large<br />
resource plays, <strong>EOG</strong> added significant proved undeveloped reserves in the Haynesville, Horn River, Barnett Combo and<br />
Marcellus shale plays. Purchases in place included proved undeveloped reserves from the Rocky Mountain property<br />
exchange and the acquisition of the Barnett Shale Combo Assets (see Note 17). During the year, <strong>EOG</strong> drilled and<br />
transferred approximately 176 Bcfe of proved undeveloped reserves to proved developed at a total capital cost of $280.5<br />
million. <strong>EOG</strong> does not have a material amount of reserves that have remained undeveloped for five years or more.<br />
F-39
Capitalized Costs Relating to Oil and Gas Producing Activities. The following table sets forth the capitalized<br />
costs relating to <strong>EOG</strong>'s natural gas and crude oil producing activities at December 31, <strong>2009</strong> and 2008:<br />
<strong>2009</strong> 2008<br />
Proved properties $ 23,097,568 $ 19,785,449<br />
Unproved properties 1,516,743 1,018,180<br />
Total 24,614,311 20,803,629<br />
Accumulated depreciation, depletion<br />
and amortization (9,479,525) (7,952,608)<br />
Net capitalized costs $ 15,134,786 $ 12,851,021<br />
Costs <strong>Inc</strong>urred in Oil and Gas Property Acquisition, Exploration and Development Activities. The acquisition,<br />
exploration and development costs disclosed in the following tables are in accordance with definitions in the Accounting<br />
Standards Codification.<br />
Acquisition costs include costs incurred to purchase, lease, or otherwise acquire property.<br />
Exploration costs include additions to exploratory wells, including those in progress and exploration expenses.<br />
F-40
<strong>EOG</strong> RESOURCES, INC.<br />
SUPPLEMENTAL INFORMATION TO CONSOLIDATED FINANCIAL STATEMENTS (Continued)<br />
Development costs include additions to production facilities and equipment and additions to development wells,<br />
including those in progress.<br />
The following tables set forth costs incurred related to <strong>EOG</strong>'s oil and gas activities for the years ended<br />
December 31, <strong>2009</strong>, 2008 and 2007:<br />
United<br />
Other<br />
States Canada Trinidad International Total<br />
<strong>2009</strong><br />
Acquisition Costs of Properties<br />
Unproved (2) $ 648,331 $ 17,806 $ 800 $ (311) $ 666,626<br />
Proved (3) 464,362 (33) - - 464,329<br />
Subtotal 1,112,693 17,773 800 (311) 1,130,955<br />
Exploration Costs 473,489 51,164 14,263 71,872 610,788<br />
Development Costs (4) 1,898,859 237,613 27,369 1,914 2,165,755<br />
Total $ 3,485,041 $ 306,550 $ 42,432 $ 73,475 $ 3,907,498<br />
2008<br />
Acquisition Costs of Properties<br />
Unproved $ 376,017 $ 141,080 $ 313 $ 3,438 $ 520,848<br />
Proved 69,612 14,071 14,836 10,301 108,820<br />
Subtotal 445,629 155,151 15,149 13,739 629,668<br />
Exploration Costs 550,725 95,647 6,638 16,693 669,703<br />
Development Costs (5) 3,405,627 281,480 99,384 7,166 3,793,657<br />
Total $ 4,401,981 $ 532,278 $ 121,171 $ 37,598 $ 5,093,028<br />
2007<br />
Acquisition Costs of Properties<br />
Unproved $ 233,337 $ 45,842 $ (38) $ (1,141) $ 278,000<br />
Proved 3,887 696 15,414 - 19,997<br />
Subtotal 237,224 46,538 15,376 (1,141) 297,997<br />
Exploration Costs 435,944 75,531 45,161 33,104 589,740<br />
Development Costs (6) 2,358,258 263,547 91,242 (1,417) 2,711,630<br />
Total $ 3,031,426 $ 385,616 $ 151,779 $ 30,546 $ 3,599,367<br />
(1) Other International primarily consists of <strong>EOG</strong>'s United Kingdom operations and, effective July 1, 2008, <strong>EOG</strong>'s China operations.<br />
(2) <strong>Inc</strong>ludes non-cash contingent consideration, with a fair value of $35 million, related to the acquisition of Haynesville Assets.<br />
(3) <strong>Inc</strong>ludes non-cash acquisition costs of $353 million related to a property exchange transaction in the Rocky Mountain area.<br />
(4) <strong>Inc</strong>ludes Asset Retirement Costs of $60 million, $18 million, $6 million and zero for the United States, Canada, Trinidad and<br />
Other International, respectively. Excludes other property, plant and equipment.<br />
(5) <strong>Inc</strong>ludes Asset Retirement Costs of $107 million, $38 million, $29 million and $7 million for the United States, Canada, Trinidad<br />
and Other International, respectively. Excludes other property, plant and equipment.<br />
(6) <strong>Inc</strong>ludes Asset Retirement Costs of $22 million, $9 million, zero and zero for the United States, Canada, Trinidad and Other<br />
International, respectively. Excludes other property, plant and equipment.<br />
F-41
<strong>EOG</strong> RESOURCES, INC.<br />
SUPPLEMENTAL INFORMATION TO CONSOLIDATED FINANCIAL STATEMENTS (Continued)<br />
Results of Operations for Oil and Gas Producing Activities (1) . The following tables set forth results of operations<br />
for oil and gas producing activities for the years ended December 31, <strong>2009</strong>, 2008 and 2007:<br />
United<br />
Other<br />
States Canada Trinidad International Total<br />
<strong>2009</strong><br />
Natural Gas, Crude Oil, Condensate and<br />
Natural Gas Liquids Revenues $ 2,732,088 $ 413,910 $ 229,649 $ 23,826 $ 3,399,473<br />
Other 9,692 (15) 3,500 - 13,177<br />
Total 2,741,780 413,895 233,149 23,826 3,412,650<br />
Exploration Costs 137,696 18,675 5,107 8,114 169,592<br />
Dry Hole Costs 39,570 1,461 - 10,212 51,243<br />
Transportation Costs 270,940 9,317 1,141 1,931 283,329<br />
Production Costs 556,236 145,292 27,616 9,452 738,596<br />
Impairments 272,195 32,996 - 641 305,832<br />
Depreciation, Depletion and Amortization 1,188,243 210,509 46,608 7,966 1,453,326<br />
<strong>Inc</strong>ome (Loss) Before <strong>Inc</strong>ome Taxes 276,900 (4,355) 152,677 (14,490) 410,732<br />
<strong>Inc</strong>ome Tax Provision (Benefit) 106,537 (1,276) 58,681 (6,067) 157,875<br />
Results of Operations $ 170,363 $ (3,079) $ 93,996 $ (8,423) $ 252,857<br />
2008<br />
Natural Gas, Crude Oil, Condensate and<br />
Natural Gas Liquids Revenues $ 5,049,783 $ 727,707 $ 393,062 $ 51,432 $ 6,221,984<br />
Other 18,193 1,002 45 - 19,240<br />
Total 5,067,976 728,709 393,107 51,432 6,241,224<br />
Exploration Costs 157,400 16,605 5,911 13,970 193,886<br />
Dry Hole Costs 43,215 12,408 (104) (352) 55,167<br />
Transportation Costs 260,628 9,819 247 3,396 274,090<br />
Production Costs 682,230 136,084 41,973 7,697 867,984<br />
Impairments 137,102 29,378 19,747 6,632 192,859<br />
Depreciation, Depletion and Amortization 1,037,125 188,860 26,039 9,080 1,261,104<br />
<strong>Inc</strong>ome Before <strong>Inc</strong>ome Taxes 2,750,276 335,555 299,294 11,009 3,396,134<br />
<strong>Inc</strong>ome Tax Provision 991,826 100,197 115,515 6,403 1,213,941<br />
Results of Operations $ 1,758,450 $ 235,358 $ 183,779 $ 4,606 $ 2,182,193<br />
2007<br />
Natural Gas, Crude Oil, Condensate and<br />
Natural Gas Liquids Revenues $ 3,026,929 $ 585,314 $ 352,877 $ 55,208 $ 4,020,328<br />
Other 8,796 (105) 8 1 8,700<br />
Total 3,035,725 585,209 352,885 55,209 4,029,028<br />
Exploration Costs 116,152 15,500 7,577 11,216 150,445<br />
Dry Hole Costs 83,160 5,349 19,350 7,523 115,382<br />
Transportation Costs 136,630 8,880 - 6,726 152,236<br />
Production Costs 454,164 137,003 45,634 3,381 640,182<br />
Impairments 108,037 37,076 - 2,404 147,517<br />
Depreciation, Depletion and Amortization 809,540 169,852 24,306 21,565 1,025,263<br />
<strong>Inc</strong>ome Before <strong>Inc</strong>ome Taxes 1,328,042 211,549 256,018 2,394 1,798,003<br />
<strong>Inc</strong>ome Tax Provision 477,826 68,330 112,996 1,960 661,112<br />
Results of Operations $ 850,216 $ 143,219 $ 143,022 $ 434 $ 1,136,891<br />
(1) Excludes gains or losses on mark-to-market financial commodity derivative contracts, gains or losses on sales of reserves and related assets, interest<br />
charges and general corporate expenses for each of the three years in the period ended December 31, <strong>2009</strong>.<br />
(2) Other International primarily consists of <strong>EOG</strong>'s United Kingdom operations and, effective July 1, 2008, <strong>EOG</strong>'s China operations.<br />
F-42
<strong>EOG</strong> RESOURCES, INC.<br />
SUPPLEMENTAL INFORMATION TO CONSOLIDATED FINANCIAL STATEMENTS (Continued)<br />
The following table sets forth production costs per thousand cubic feet equivalent, excluding severance/production<br />
and ad valorem taxes, for the years ended December 31, <strong>2009</strong>, 2008 and 2007:<br />
Production Costs Per Unit<br />
United<br />
Other<br />
States Canada Trinidad International Composite<br />
Year Ended December 31, <strong>2009</strong> $ 0.74 $ 1.40 $ 0.12 $ 1.74 $ 0.73<br />
Year Ended December 31, 2008 $ 0.75 $ 1.34 $ 0.17 $ 1.23 $ 0.76<br />
Year Ended December 31, 2007 $ 0.70 $ 1.37 $ 0.18 $ 0.38 $ 0.71<br />
(1) Other International primarily consists of <strong>EOG</strong>'s United Kingdom operations and, effective July 1, 2008, <strong>EOG</strong>'s China operations.<br />
Standardized Measure of Discounted Future Net Cash Flows Relating to Proved Oil and Gas Reserves. The<br />
following information has been developed utilizing procedures prescribed by ASC Topic 932 and based on natural gas and<br />
liquids reserves and production volumes estimated by the Engineering and Acquisitions Department of <strong>EOG</strong>. The estimates<br />
were based on a 12-month average for commodity prices for the year <strong>2009</strong> and year-end prices for the years 2008 and 2007.<br />
It may be useful for certain comparison purposes, but should not be solely relied upon in evaluating <strong>EOG</strong> or its performance.<br />
Further, information contained in the following table should not be considered as representative of realistic assessments of<br />
future cash flows, nor should the Standardized Measure of Discounted Future Net Cash Flows be viewed as representative of<br />
the current value of <strong>EOG</strong>.<br />
The future cash flows presented below are based on sales prices, cost rates, and statutory income tax rates in<br />
existence as of the date of the projections. It is expected that material revisions to some estimates of natural gas and liquids<br />
reserves may occur in the future, development and production of the reserves may occur in periods other than those assumed,<br />
and actual prices realized and costs incurred may vary significantly from those used.<br />
Management does not rely upon the following information in making investment and operating decisions. Such<br />
decisions are based upon a wide range of factors, including estimates of probable as well as proved reserves, and varying<br />
price and cost assumptions considered more representative of a range of possible economic conditions that may be<br />
anticipated.<br />
F-43
<strong>EOG</strong> RESOURCES, INC.<br />
SUPPLEMENTAL INFORMATION TO CONSOLIDATED FINANCIAL STATEMENTS (Continued)<br />
The following table sets forth the standardized measure of discounted future net cash flows from projected production of<br />
<strong>EOG</strong>'s oil and gas reserves for the years ended December 31, <strong>2009</strong>, 2008 and 2007:<br />
United<br />
Other<br />
States Canada Trinidad International Total<br />
<strong>2009</strong><br />
Future cash inflows (2) $ 34,506,336 $ 6,887,530 $ 2,133,778 $ 52,738 $ 43,580,382<br />
Future production costs (11,977,152) (2,537,001) (398,318) (27,791) (14,940,262)<br />
Future development costs (5,696,619) (2,255,088) (264,104) (346) (8,216,157)<br />
Future income taxes (5,307,041) (249,986) (525,873) (4,276) (6,087,176)<br />
Future net cash flows 11,525,524 1,845,455 945,483 20,325 14,336,787<br />
Discount to present value at 10% annual rate (5,702,608) (808,211) (279,920) (5,030) (6,795,769)<br />
Standardized measure of discounted<br />
future net cash flows relating<br />
to proved oil and gas reserves $ 5,822,916 $ 1,037,244 $ 665,563 $ 15,295 $ 7,541,018<br />
2008<br />
Future cash inflows (3) $ 30,251,481 $ 6,522,526 $ 2,073,962 $ 82,842 $ 38,930,811<br />
Future production costs (10,378,028) (2,100,701) (475,725) (35,504) (12,989,958)<br />
Future development costs (3,270,509) (395,609) (259,155) (6,174) (3,931,447)<br />
Future income taxes (4,789,311) (761,525) (401,264) (15,038) (5,967,138)<br />
Future net cash flows 11,813,633 3,264,691 937,818 26,126 16,042,268<br />
Discount to present value at 10% annual rate (5,505,921) (1,513,539) (336,765) (6,142) (7,362,367)<br />
Standardized measure of discounted<br />
future net cash flows relating<br />
to proved oil and gas reserves $ 6,307,712 $ 1,751,152 $ 601,053 $ 19,984 $ 8,679,901<br />
2007<br />
Future cash inflows (4) $ 41,151,570 $ 8,783,187 $ 6,196,996 $ 133,844 $ 56,265,597<br />
Future production costs (11,449,082) (2,766,329) (630,556) (29,022) (14,874,989)<br />
Future development costs (2,716,181) (493,772) (385,406) (8,049) (3,603,408)<br />
Future income taxes (8,195,111) (1,085,595) (2,065,505) (48,387) (11,394,598)<br />
Future net cash flows 18,791,196 4,437,491 3,115,529 48,386 26,392,602<br />
Discount to present value at 10% annual rate (9,326,881) (2,002,808) (1,276,573) (4,718) (12,610,980)<br />
Standardized measure of discounted<br />
future net cash flows relating<br />
to proved oil and gas reserves $ 9,464,315 $ 2,434,683 $ 1,838,956 $ 43,668 $ 13,781,622<br />
(1) Other International includes <strong>EOG</strong>'s United Kingdom operations and, effective July 1, 2008, <strong>EOG</strong>'s China operations.<br />
(2) Estimated natural gas prices used to calculate <strong>2009</strong> future cash inflows for the United States, Canada, Trinidad and Other International were $3.43, $3.50,<br />
$1.88 and $3.92, respectively. Estimated crude oil prices used to calculate <strong>2009</strong> future cash inflows for the United States, Canada, Trinidad and Other<br />
International were $53.64, $56.85, $51.35 and $52.87, respectively. Estimated natural gas liquids prices used to calculate <strong>2009</strong> future cash inflows for<br />
the United States and Canada were $28.75 and $19.31, respectively.<br />
(3) Estimated natural gas prices used to calculate 2008 future cash inflows for the United States, Canada, Trinidad and Other International were $5.05, $6.25,<br />
$1.49 and $5.14, respectively. Estimated liquids prices used to calculate 2008 future cash inflows for the United States, Canada, Trinidad and Other<br />
International were $27.02, $25.44, $33.98 and $98.09, respectively.<br />
(4) Estimated natural gas prices used to calculate 2007 future cash inflows for the United States, Canada, Trinidad and Other International were $6.79, $6.47,<br />
$4.29 and $10.05, respectively. Estimated liquids prices used to calculate 2007 future cash inflows for the United States, Canada, Trinidad and Other<br />
International were $78.13, $78.10, $86.11 and $84.20, respectively.<br />
F-44
<strong>EOG</strong> RESOURCES, INC.<br />
SUPPLEMENTAL INFORMATION TO CONSOLIDATED FINANCIAL STATEMENTS (Continued)<br />
Changes in Standardized Measure of Discounted Future Net Cash Flows. The following table sets forth the<br />
changes in the standardized measure of discounted future net cash flows at December 31, for each of the three years in the<br />
period ended December 31, <strong>2009</strong>:<br />
United<br />
Other<br />
States Canada Trinidad International Total<br />
December 31, 2006 $ 5,149,485 $ 1,962,556 $ 1,244,649 $ 20,971 $ 8,377,661<br />
Sales and transfers of oil<br />
and gas produced, net of<br />
production costs (2,408,307) (439,482) (307,237) (45,107) (3,200,133)<br />
Net changes in prices and<br />
production costs 3,397,803 747,389 961,686 76,223 5,183,101<br />
Extensions, discoveries,<br />
additions and improved<br />
recovery, net of related costs 3,708,015 184,691 - - 3,892,706<br />
Development costs incurred 459,700 42,300 139,100 - 641,100<br />
Revisions of estimated<br />
development cost (2,547) (56,336) (57,498) (70) (116,451)<br />
Revisions of previous quantity<br />
estimates 294,500 (135,562) (57,680) 19,645 120,903<br />
Accretion of discount 694,165 229,953 202,032 4,194 1,130,344<br />
Net change in income taxes (1,872,542) (46,935) (378,415) (22,697) (2,320,589)<br />
Purchases of reserves in place 5,309 1,726 55,372 - 62,407<br />
Sales of reserves in place (47,151) - - - (47,151)<br />
Changes in timing and other 85,885 (55,617) 36,947 (9,491) 57,724<br />
December 31, 2007 9,464,315 2,434,683 1,838,956 43,668 13,781,622<br />
Sales and transfers of oil<br />
and gas produced, net of<br />
production costs (4,106,925) (581,804) (350,842) (40,338) (5,079,909)<br />
Net changes in prices and<br />
production costs (5,043,379) (709,659) (2,148,861) (9,820) (7,911,719)<br />
Extensions, discoveries,<br />
additions and improved<br />
recovery, net of related costs 2,187,722 107,545 - - 2,295,267<br />
Development costs incurred 736,800 19,400 30,600 - 786,800<br />
Revisions of estimated<br />
development cost (5,329) 41,666 69,261 1,621 107,219<br />
Revisions of previous quantity<br />
estimates (184,671) 48,638 47,606 (22,611) (111,038)<br />
Accretion of discount 1,312,902 281,860 299,304 8,734 1,902,800<br />
Net change in income taxes 1,676,106 141,767 909,920 31,340 2,759,133<br />
Purchases of reserves in place 120,300 26,002 4,886 14,559 165,747<br />
Sales of reserves in place (277,781) - - - (277,781)<br />
Changes in timing and other 427,652 (58,946) (99,777) (7,169) 261,760<br />
December 31, 2008 6,307,712 1,751,152 601,053 19,984 8,679,901<br />
Sales and transfers of oil<br />
and gas produced, net of<br />
production costs (1,904,912) (259,301) (200,892) (12,443) (2,377,548)<br />
Net changes in prices and<br />
production costs (1,482,778) (902,629) 338,053 (13,868) (2,061,222)<br />
Extensions, discoveries,<br />
additions and improved<br />
recovery, net of related costs 1,702,471 259,305 - - 1,961,776<br />
Development costs incurred 344,500 14,200 - - 358,700<br />
Revisions of estimated<br />
development cost 595,875 68,883 (3,380) 4,555 665,933<br />
Revisions of previous quantity<br />
estimates (422,294) (425,018) (124,222) 1,016 (970,518)<br />
Accretion of discount 829,631 199,330 84,521 3,232 1,116,714<br />
Net change in income taxes 261,513 259,169 (105,766) 9,847 424,763<br />
Purchases of reserves in place 209,130 - - - 209,130<br />
Sales of reserves in place (264,482) (13,912) - - (278,394)<br />
Changes in timing and other (353,450) 86,065 76,196 2,972 (188,217)<br />
December 31, <strong>2009</strong> $ 5,822,916 $ 1,037,244 $ 665,563 $ 15,295 $ 7,541,018<br />
F-45
<strong>EOG</strong> RESOURCES, INC.<br />
SUPPLEMENTAL INFORMATION TO CONSOLIDATED FINANCIAL STATEMENTS (Concluded)<br />
Unaudited Quarterly Financial Information<br />
(In Thousands, Except Per Share Data)<br />
Quarter Ended Mar 31 Jun 30 Sep 30 Dec 31<br />
<strong>2009</strong><br />
Net Operating Revenues $ 1,158,209 $ 861,039 $ 1,006,849 $ 1,760,862<br />
Operating <strong>Inc</strong>ome $ 281,412 $ 18 $ 35,303 $ 654,108<br />
<strong>Inc</strong>ome Before <strong>Inc</strong>ome Taxes $ 264,775 $ (23,556) $ 4,557 $ 626,235<br />
<strong>Inc</strong>ome Tax Provision 106,065 (6,850) 361 225,808<br />
Net <strong>Inc</strong>ome Available to Common Stockholders $ 158,710 $ (16,706) $ 4,196 $ 400,427<br />
Net <strong>Inc</strong>ome Per Share Available to Common<br />
Stockholders (1)<br />
Basic $ 0.64 $ (0.07) $ 0.02 $ 1.60<br />
Diluted $ 0.63 $ (0.07) $ 0.02 $ 1.58<br />
Average Number of Common Shares<br />
Basic 247,991 248,207 249,535 250,127<br />
Diluted 250,204 248,207 252,422 253,493<br />
2008<br />
Net Operating Revenues $ 1,134,018 $ 1,095,512 $ 3,263,886 $ 1,633,727<br />
Operating <strong>Inc</strong>ome $ 380,720 $ 243,103 $ 2,392,183 $ 751,179<br />
<strong>Inc</strong>ome Before <strong>Inc</strong>ome Taxes $ 370,112 $ 247,383 $ 2,393,952 $ 735,092<br />
<strong>Inc</strong>ome Tax Provision 129,156 69,177 837,667 273,620<br />
Net <strong>Inc</strong>ome 240,956 178,206 1,556,285 461,472<br />
Preferred Stock Dividends (2) 443 - - -<br />
Net <strong>Inc</strong>ome Available to Common Stockholders $ 240,513 $ 178,206 $ 1,556,285 $ 461,472<br />
Net <strong>Inc</strong>ome Per Share Available to Common<br />
Stockholders (1)<br />
Basic $ 0.98 $ 0.72 $ 6.30 $ 1.86<br />
Diluted $ 0.96 $ 0.71 $ 6.20 $ 1.84<br />
Average Number of Common Shares<br />
Basic 245,430 246,536 247,155 247,672<br />
Diluted 249,763 251,135 250,930 250,162<br />
(1) The sum of quarterly net income per share available to common stockholders may not agree with total year net income per share<br />
available to common stockholders as each quarterly computation is based on the weighted average of common shares outstanding.<br />
(2) <strong>Inc</strong>ludes premium and fees associated with the repurchase of preferred stock in the first quarter of 2008. See Note 3 to Consolidated<br />
Financial Statements.<br />
F-46
Schedule II<br />
<strong>EOG</strong> RESOURCES, INC.<br />
VALUATION AND QUALIFYING ACCOUNTS<br />
For the Years Ended December 31, <strong>2009</strong>, 2008 and 2007<br />
(In Thousands)<br />
Column A Column B Column C Column D Column E<br />
Additions<br />
Balance at Charged to Deductions Balance at<br />
Beginning of Costs and From End of<br />
Description Year Expenses Reserves Year<br />
<strong>2009</strong><br />
Allowance deducted from Accounts Receivable $ 13,131 $ 145 $ 48 $ 13,228<br />
2008<br />
Allowance deducted from Accounts Receivable $ 16,019 $ 57 $ 2,945 $ 13,131<br />
2007<br />
Allowance deducted from Accounts Receivable $ 17,299 $ 16 $ 1,296 $ 16,019<br />
S-1
EXHIBITS<br />
Exhibits not incorporated herein by reference to a prior filing are designated by (i) an asterisk (*) and are filed herewith;<br />
or (ii) a pound sign (#) and are not filed herewith, and, pursuant to Item 601(b)(4)(iii)(A) of Regulation S-K, the registrant hereby<br />
agrees to furnish a copy of such exhibit to the SEC upon request.<br />
Exhibit<br />
Number<br />
Description<br />
3.1(a) - Restated Certificate of <strong>Inc</strong>orporation, dated September 3, 1987 (Exhibit 3.1(a) to <strong>EOG</strong>'s <strong>Annual</strong> <strong>Report</strong> on<br />
Form 10-K for the year ended December 31, 2008).<br />
3.1(b) - Certificate of Amendment of Restated Certificate of <strong>Inc</strong>orporation, dated May 5, 1993 (Exhibit 4.1(b) to<br />
<strong>EOG</strong>'s Registration Statement on Form S-8, SEC File No. 33-52201, filed February 8, 1994).<br />
3.1(c) - Certificate of Amendment of Restated Certificate of <strong>Inc</strong>orporation, dated June 14, 1994 (Exhibit 4.1(c) to<br />
<strong>EOG</strong>'s Registration Statement on Form S-8, SEC File No. 33-58103, filed March 15, 1995).<br />
3.1(d) - Certificate of Amendment of Restated Certificate of <strong>Inc</strong>orporation, dated June 11, 1996 (Exhibit 3(d) to<br />
<strong>EOG</strong>'s Registration Statement on Form S-3, SEC File No. 333-09919, filed August 9, 1996).<br />
3.1(e) - Certificate of Amendment of Restated Certificate of <strong>Inc</strong>orporation, dated May 7, 1997 (Exhibit 3(e) to<br />
<strong>EOG</strong>'s Registration Statement on Form S-3, SEC File No. 333-44785, filed January 23, 1998).<br />
3.1(f) - Certificate of Ownership and Merger Merging <strong>EOG</strong> <strong>Resources</strong>, <strong>Inc</strong>. into Enron Oil & Gas Company, dated<br />
August 26, 1999 (Exhibit 3.1(f) to <strong>EOG</strong>'s <strong>Annual</strong> <strong>Report</strong> on Form 10-K for the year ended December 31,<br />
1999) (SEC File No. 001-09743).<br />
3.1(g) - Certificate of Designations of Series E Junior Participating Preferred Stock, dated February 14, 2000<br />
(Exhibit 2 to <strong>EOG</strong>'s Registration Statement on Form 8-A, filed February 18, 2000).<br />
3.1(h) - Certificate of Elimination of the Fixed Rate Cumulative Perpetual Senior Preferred Stock, Series A, dated<br />
September 13, 2000 (Exhibit 3.1(j) to <strong>EOG</strong>'s Registration Statement on Form S-3, SEC File No. 333-<br />
46858, filed September 28, 2000).<br />
3.1(i) - Certificate of Elimination of the Flexible Money Market Cumulative Preferred Stock, Series C, dated<br />
September 13, 2000 (Exhibit 3.1(k) to <strong>EOG</strong>'s Registration Statement on Form S-3, SEC File No. 333-<br />
46858, filed September 28, 2000).<br />
3.1(j) - Certificate of Elimination of the Flexible Money Market Cumulative Preferred Stock, Series D, dated<br />
February 24, 2005 (Exhibit 3.1(k) to <strong>EOG</strong>'s <strong>Annual</strong> <strong>Report</strong> on Form 10-K for the year ended December 31,<br />
2004) (SEC File No. 001-09743).<br />
3.1(k) - Amended Certificate of Designations of Series E Junior Participating Preferred Stock, dated March 7,<br />
2005. (Exhibit 3.1(m) to <strong>EOG</strong>'s <strong>Annual</strong> <strong>Report</strong> on Form 10-K for the year ended December 31, 2007).<br />
3.1(l) - Certificate of Amendment of Restated Certificate of <strong>Inc</strong>orporation, dated May 3, 2005 (Exhibit 3.1(l) to<br />
<strong>EOG</strong>'s Quarterly <strong>Report</strong> on Form 10-Q for the quarter ended June 30, 2005).<br />
3.1(m) - Certificate of Elimination of Fixed Rate Cumulative Perpetual Senior Preferred Stock, Series B, dated<br />
March 6, 2008 (Exhibit 3.1 to <strong>EOG</strong>'s Current <strong>Report</strong> on Form 8-K, filed March 6, 2008).<br />
3.2 - Bylaws, as amended and restated effective as of February 26, <strong>2009</strong> (Exhibit 3.2(a) to <strong>EOG</strong>'s Current<br />
<strong>Report</strong> on Form 8-K, filed March 4, <strong>2009</strong>).<br />
E-1
Exhibit<br />
Number<br />
Description<br />
4.1 - Specimen of Certificate evidencing <strong>EOG</strong>'s Common Stock (Exhibit 3.3 to <strong>EOG</strong>'s <strong>Annual</strong> <strong>Report</strong> on Form<br />
10-K for the year ended December 31, 1999) (SEC File No. 001-09743).<br />
4.2 - Indenture, dated as of September 1, 1991, between Enron Oil & Gas Company (predecessor to <strong>EOG</strong>) and<br />
The Bank of New York Mellon Trust Company, N.A. (as successor in interest to JPMorgan Chase Bank,<br />
N.A. (formerly, Texas Commerce Bank National Association)), as Trustee (Exhibit 4(a) to <strong>EOG</strong>'s<br />
Registration Statement on Form S-3, SEC File No. 33-42640, filed September 6, 1991).<br />
4.3(a) - Officers' Certificate Establishing 6.125% Senior Notes due 2013 and 6.875% Senior Notes due 2018,<br />
dated September 30, 2008 (Exhibit 4.2 to <strong>EOG</strong>'s Current <strong>Report</strong> on Form 8-K, filed September 30,<br />
2008).<br />
4.3(b) - Form of Global Note with respect to the 6.125% Senior Notes due 2013 of <strong>EOG</strong> (Exhibit 4.3 to <strong>EOG</strong>'s<br />
Current <strong>Report</strong> on Form 8-K, filed September 30, 2008).<br />
4.3(c) - Form of Global Note with respect to the 6.875% Senior Notes due 2018 of <strong>EOG</strong> (Exhibit 4.4 to <strong>EOG</strong>'s<br />
Current <strong>Report</strong> on Form 8-K, filed September 30, 2008).<br />
4.4(a) - Officers' Certificate Establishing 5.875% Senior Notes due 2017 of <strong>EOG</strong>, dated September 10, 2007<br />
(Exhibit 4.2 to <strong>EOG</strong>'s Current <strong>Report</strong> on Form 8-K, filed September 10, 2007).<br />
4.4(b) - Form of Global Note with respect to the 5.875% Senior Notes due 2017 of <strong>EOG</strong> (Exhibit 4.3 to <strong>EOG</strong>'s<br />
Current <strong>Report</strong> on Form 8-K, filed September 10, 2007).<br />
#4.5(a) - Certificate, dated April 3, 1998, of the Senior Vice President and Chief Financial Officer of Enron Oil &<br />
Gas Company (predecessor to <strong>EOG</strong>) establishing the terms of the 6.65% Notes due April 1, 2028.<br />
#4.5(b) - Global Note with respect to the 6.65% Notes due April 1, 2028 of Enron Oil & Gas Company (predecessor<br />
to <strong>EOG</strong>).<br />
#4.6(a) - Indenture, dated as of November 15, 2001, between <strong>EOG</strong> Company of Canada, as Issuer, and Wells Fargo<br />
Bank, National Association, as successor Trustee, with respect to the 7.00% Senior Notes due 2011 of<br />
<strong>EOG</strong> Company of Canada.<br />
#4.6(b) - First Supplemental Indenture, dated as of April 2, 2002, to the Indenture, dated as of November 15, 2001,<br />
between <strong>EOG</strong> Company of Canada, as Issuer, and Wells Fargo Bank, National Association, as successor<br />
Trustee, with respect to the 7.00% Senior Notes due 2011 of <strong>EOG</strong> Company of Canada.<br />
#4.7 - Indenture, dated as of March 1, 2004, between <strong>EOG</strong> <strong>Resources</strong> Canada <strong>Inc</strong>., as Issuer, and The Bank of<br />
New York Trust Company, N.A., as Trustee, with respect to the 4.75% Senior Notes due 2014 of <strong>EOG</strong><br />
<strong>Resources</strong> Canada <strong>Inc</strong>.<br />
4.8 - Indenture, dated as of May 18, <strong>2009</strong>, between <strong>EOG</strong> and Wells Fargo Bank, NA, as Trustee (Exhibit 4.9 to<br />
<strong>EOG</strong>'s Registration Statement on Form S-3, filed May 18, <strong>2009</strong>).<br />
4.9(a) - Officers' Certificate Establishing 5.625% Senior Notes due 2019 of <strong>EOG</strong>, dated May 21, <strong>2009</strong> (Exhibit 4.2<br />
to <strong>EOG</strong>'s Current <strong>Report</strong> on Form 8-K, filed May 21, <strong>2009</strong>).<br />
4.9(b) - Form of Global Note with respect to the 5.625% Senior Notes due 2019 of <strong>EOG</strong> (Exhibit 4.3 to <strong>EOG</strong>'s<br />
Current <strong>Report</strong> on Form 8-K, filed May 21, <strong>2009</strong>).<br />
10.1(a) - <strong>EOG</strong> <strong>Resources</strong>, <strong>Inc</strong>. 2008 Omnibus Equity Compensation Plan, effective as of May 8, 2008 (Exhibit<br />
10.1 to <strong>EOG</strong>'s Current <strong>Report</strong> on Form 8-K, filed May 14, 2008).<br />
E-2
Exhibit<br />
Number<br />
Description<br />
10.1(b) - First Amendment to <strong>EOG</strong> <strong>Resources</strong>, <strong>Inc</strong>. 2008 Omnibus Equity Compensation Plan, dated effective as<br />
of September 4, 2008 (Exhibit 10.1 to <strong>EOG</strong>'s Quarterly <strong>Report</strong> on Form 10-Q for the quarter ended<br />
September 30, 2008).<br />
10.1(c) - Form of Stock Option Agreement for <strong>EOG</strong> <strong>Resources</strong>, <strong>Inc</strong>. 2008 Omnibus Equity Compensation Plan<br />
(Exhibit 10.2 to <strong>EOG</strong>'s Current <strong>Report</strong> on Form 8-K, filed May 14, 2008).<br />
10.1(d) - Form of Stock-Settled Stock Appreciation Right Agreement for <strong>EOG</strong> <strong>Resources</strong>, <strong>Inc</strong>. 2008 Omnibus<br />
Equity Compensation Plan (Exhibit 10.3 to <strong>EOG</strong>'s Current <strong>Report</strong> on Form 8-K, filed May 14, 2008).<br />
10.1(e) - Form of Nonemployee Director Stock-Settled Stock Appreciation Right Agreement for <strong>EOG</strong> <strong>Resources</strong>,<br />
<strong>Inc</strong>. 2008 Omnibus Equity Compensation Plan (Exhibit 10.4 to <strong>EOG</strong>'s Current <strong>Report</strong> on Form 8-K,<br />
filed May 14, 2008).<br />
10.1(f) - Form of Restricted Stock Award Agreement for <strong>EOG</strong> <strong>Resources</strong>, <strong>Inc</strong>. 2008 Omnibus Equity<br />
Compensation Plan (Exhibit 10.5 to <strong>EOG</strong>'s Current <strong>Report</strong> on Form 8-K, filed May 14, 2008).<br />
10.1(g) - Form of Restricted Stock Unit Award Agreement for <strong>EOG</strong> <strong>Resources</strong>, <strong>Inc</strong>. 2008 Omnibus Equity<br />
Compensation Plan (Exhibit 10.6 to <strong>EOG</strong>'s Current <strong>Report</strong> on Form 8-K, filed May 14, 2008).<br />
10.1(h) - Form of Nonemployee Director Restricted Stock Award Agreement for <strong>EOG</strong> <strong>Resources</strong>, <strong>Inc</strong>. 2008<br />
Omnibus Equity Compensation Plan (Exhibit 10.7 to <strong>EOG</strong>'s Current <strong>Report</strong> on Form 8-K, filed May 14,<br />
2008).<br />
10.2(a) - <strong>EOG</strong> <strong>Resources</strong>, <strong>Inc</strong>. 409A Deferred Compensation Plan - Nonqualified Supplemental Deferred<br />
Compensation Plan - Plan Document, effective as of December 16, 2008 (Exhibit 10.2(a) to <strong>EOG</strong>'s<br />
<strong>Annual</strong> <strong>Report</strong> on Form 10-K for the year ended December 31, 2008).<br />
10.2(b) - <strong>EOG</strong> <strong>Resources</strong>, <strong>Inc</strong>. 409A Deferred Compensation Plan - Nonqualified Supplemental Deferred<br />
Compensation Plan - Adoption Agreement, dated as of December 16, 2008 (Exhibit 10.2(b) to <strong>EOG</strong>'s<br />
<strong>Annual</strong> <strong>Report</strong> on Form 10-K for the year ended December 31, 2008).<br />
10.3(a) - Amended and Restated Enron Oil & Gas Company 1994 Stock Plan (Exhibit 4.3 to <strong>EOG</strong>'s Registration<br />
Statement on Form S-8, SEC File No. 33-58103, filed March 15, 1995).<br />
10.3(b) - Amendment to Amended and Restated Enron Oil & Gas Company 1994 Stock Plan, dated effective as of<br />
December 12, 1995 (Exhibit 4.3(a) to <strong>EOG</strong>'s <strong>Annual</strong> <strong>Report</strong> on Form 10-K for the year ended<br />
December 31, 1995) (SEC File No. 001-09743).<br />
10.3(c) - Amendment to Amended and Restated Enron Oil & Gas Company 1994 Stock Plan, dated effective as of<br />
December 10, 1996 (Exhibit 4.3(a) to <strong>EOG</strong>'s Registration Statement on Form S-8, SEC File No. 333-<br />
20841, filed January 31, 1997).<br />
10.3(d) - Third Amendment to Amended and Restated Enron Oil & Gas Company 1994 Stock Plan, dated effective<br />
as of December 9, 1997 (Exhibit 4.3(d) to <strong>EOG</strong>'s <strong>Annual</strong> <strong>Report</strong> on Form 10-K for the year ended<br />
December 31, 1997) (SEC File No. 001-09743).<br />
10.3(e) - Fourth Amendment to Amended and Restated Enron Oil & Gas Company 1994 Stock Plan, dated effective<br />
as of May 5, 1998 (Exhibit 4.3(e) to <strong>EOG</strong>'s <strong>Annual</strong> <strong>Report</strong> on Form 10-K for the year ended December 31,<br />
1998) (SEC File No. 001-09743).<br />
10.3(f) - Fifth Amendment to Amended and Restated Enron Oil & Gas Company 1994 Stock Plan, dated effective<br />
as of December 8, 1998 (Exhibit 4.3(f) to <strong>EOG</strong>'s <strong>Annual</strong> <strong>Report</strong> on Form 10-K for the year ended<br />
December 31, 1998) (SEC File No. 001-09743).<br />
E-3
Exhibit<br />
Number<br />
Description<br />
10.3(g) - Sixth Amendment to Amended and Restated <strong>EOG</strong> <strong>Resources</strong>, <strong>Inc</strong>. 1994 Stock Plan, dated effective as of<br />
May 8, 2001 (Exhibit 10.1(g) to <strong>EOG</strong>'s <strong>Annual</strong> <strong>Report</strong> on Form 10-K for the year ended December 31,<br />
2001) (SEC File No. 001-09743).<br />
10.3(h) - Seventh Amendment to Amended and Restated <strong>EOG</strong> <strong>Resources</strong>, <strong>Inc</strong>. 1994 Stock Plan, dated effective as of<br />
December 30, 2005 (Exhibit 10.1(h) to <strong>EOG</strong>'s <strong>Annual</strong> <strong>Report</strong> on Form 10-K for the year ended December<br />
31, 2005).<br />
10.4(a) - <strong>EOG</strong> <strong>Resources</strong>, <strong>Inc</strong>. 1993 Nonemployee Directors Stock Option Plan, as amended and restated effective<br />
May 7, 2002 (Exhibit A to <strong>EOG</strong>'s Proxy Statement, filed March 28, 2002, with respect to <strong>EOG</strong>'s 2002<br />
<strong>Annual</strong> Meeting of Stockholders) (SEC File No. 001-09743).<br />
10.4(b) - First Amendment to <strong>EOG</strong> <strong>Resources</strong>, <strong>Inc</strong>. 1993 Nonemployee Directors Stock Option Plan, dated effective<br />
as of December 30, 2005 (Exhibit 10.2(b) to <strong>EOG</strong>'s <strong>Annual</strong> <strong>Report</strong> on Form 10-K for the year ended<br />
December 31, 2005).<br />
10.5(a) - <strong>EOG</strong> <strong>Resources</strong>, <strong>Inc</strong>. 1992 Stock Plan, as amended and restated effective May 4, 2004 (Exhibit B to <strong>EOG</strong>'s<br />
Proxy Statement, filed March 29, 2004, with respect to <strong>EOG</strong>'s 2004 <strong>Annual</strong> Meeting of Stockholders)<br />
(SEC File No. 001-09743).<br />
10.5(b) - First Amendment to <strong>EOG</strong> <strong>Resources</strong>, <strong>Inc</strong>. 1992 Stock Plan, dated effective as of December 30, 2005<br />
(Exhibit 10.3(b) to <strong>EOG</strong>'s <strong>Annual</strong> <strong>Report</strong> on Form 10-K for the year ended December 31, 2005).<br />
10.6(a) - Executive Employment Agreement between <strong>EOG</strong> and Mark G. Papa, effective as of June 15, 2005 (Exhibit<br />
99.1 to <strong>EOG</strong>'s Current <strong>Report</strong> on Form 8-K filed, June 21, 2005).<br />
10.6(b) - First Amendment to Executive Employment Agreement between <strong>EOG</strong> and Mark G. Papa, effective as of<br />
March 16, <strong>2009</strong> (Exhibit 10.1 to <strong>EOG</strong>'s Current <strong>Report</strong> on Form 8-K, filed March 18, <strong>2009</strong>).<br />
10.6(c) - Amended and Restated Change of Control Agreement between <strong>EOG</strong> and Mark G. Papa, effective as of<br />
June 15, 2005 (Exhibit 99.6 to <strong>EOG</strong>'s Current <strong>Report</strong> on Form 8-K, filed June 21, 2005).<br />
10.6(d) - First Amendment to Amended and Restated Change of Control Agreement between <strong>EOG</strong> and Mark G.<br />
Papa, effective as of April 30, <strong>2009</strong> (Exhibit 10.1(b) to <strong>EOG</strong>'s Quarterly <strong>Report</strong> on Form 10-Q for the<br />
quarter ended March 31, <strong>2009</strong>).<br />
10.7(a) - Executive Employment Agreement between <strong>EOG</strong> and Loren M. Leiker, effective as of June 15, 2005<br />
(Exhibit 99.3 to <strong>EOG</strong>'s Current <strong>Report</strong> on Form 8-K, filed June 21, 2005).<br />
10.7(b) - First Amendment to Executive Employment Agreement between <strong>EOG</strong> and Loren M. Leiker, effective as of<br />
March 16, <strong>2009</strong> (Exhibit 10.2 to <strong>EOG</strong>'s Current <strong>Report</strong> on Form 8-K, filed March 18, <strong>2009</strong>).<br />
10.7(c) - Amended and Restated Change of Control Agreement between <strong>EOG</strong> and Loren M. Leiker, effective as of<br />
June 15, 2005 (Exhibit 99.8 to <strong>EOG</strong>'s Current <strong>Report</strong> on Form 8-K, filed June 21, 2005).<br />
10.7(d) - First Amendment to Amended and Restated Change of Control Agreement between <strong>EOG</strong> and Loren M.<br />
Leiker, effective as of April 30, <strong>2009</strong> (Exhibit 10.2(b) to <strong>EOG</strong>'s Quarterly <strong>Report</strong> on Form 10-Q for the<br />
quarter ended March 31, <strong>2009</strong>).<br />
10.8(a) - Executive Employment Agreement between <strong>EOG</strong> and Gary L. Thomas, effective as of June 15, 2005<br />
(Exhibit 99.4 to <strong>EOG</strong>'s Current <strong>Report</strong> on Form 8-K, filed June 21, 2005).<br />
10.8(b) - First Amendment to Executive Employment Agreement between <strong>EOG</strong> and Gary L. Thomas, effective as of<br />
March 16, <strong>2009</strong> (Exhibit 10.3 to <strong>EOG</strong>'s Current <strong>Report</strong> on Form 8-K, filed March 18, <strong>2009</strong>).<br />
E-4
Exhibit<br />
Number<br />
Description<br />
10.8(c) - Amended and Restated Change of Control Agreement between <strong>EOG</strong> and Gary L. Thomas, effective as of<br />
June 15, 2005 (Exhibit 99.9 to <strong>EOG</strong>'s Current <strong>Report</strong> on Form 8-K, filed June 21, 2005).<br />
10.8(d) - First Amendment to Amended and Restated Change of Control Agreement between <strong>EOG</strong> and Gary L.<br />
Thomas, effective as of April 30, <strong>2009</strong> (Exhibit 10.3(b) to <strong>EOG</strong>'s Quarterly <strong>Report</strong> on Form 10-Q for the<br />
quarter ended March 31, <strong>2009</strong>).<br />
10.9(a) - Amended and Restated Change of Control Agreement between <strong>EOG</strong> and Timothy K. Driggers, effective as<br />
of June 15, 2005 (Exhibit 99.11 to <strong>EOG</strong>'s Current <strong>Report</strong> on Form 8-K, filed June 21, 2005).<br />
10.9(b) - First Amendment to Amended and Restated Change of Control Agreement between <strong>EOG</strong> and Timothy K.<br />
Driggers, effective as of April 30, <strong>2009</strong> (Exhibit 10.5 to <strong>EOG</strong>'s Quarterly <strong>Report</strong> on Form 10-Q for the<br />
quarter ended March 31, <strong>2009</strong>).<br />
10.10(a) - Executive Employment Agreement between <strong>EOG</strong> and Frederick J. Plaeger, II, effective as of April 23,<br />
2007 (Exhibit 10.1 to <strong>EOG</strong>'s Quarterly <strong>Report</strong> on Form 10-Q for the quarter ended March 31, 2007).<br />
10.10(b) - First Amendment to Executive Employment Agreement between <strong>EOG</strong> and Frederick J. Plaeger, II,<br />
effective as of April 30, <strong>2009</strong> (Exhibit 10.4(a) to <strong>EOG</strong>'s Quarterly <strong>Report</strong> on Form 10-Q for the quarter<br />
ended March 31, <strong>2009</strong>).<br />
10.10(c) - Change of Control Agreement between <strong>EOG</strong> and Frederick J. Plaeger, II, effective as of April 23, 2007<br />
(Exhibit 10.2 to <strong>EOG</strong>'s Quarterly <strong>Report</strong> on Form 10-Q for the quarter ended March 31, 2007).<br />
10.10(d) - First Amendment to Change of Control Agreement between <strong>EOG</strong> and Frederick J. Plaeger, II, effective as<br />
of April 30, <strong>2009</strong> (Exhibit 10.4(b) to <strong>EOG</strong>'s Quarterly <strong>Report</strong> on Form 10-Q for the quarter ended March<br />
31, <strong>2009</strong>).<br />
10.11(a) - <strong>EOG</strong> <strong>Resources</strong>, <strong>Inc</strong>. Change of Control Severance Plan, as amended and restated effective as of June 15,<br />
2005 (Exhibit 99.12 to <strong>EOG</strong>'s Current <strong>Report</strong> on Form 8-K, filed June 21, 2005).<br />
10.11(b) - First Amendment to the <strong>EOG</strong> <strong>Resources</strong>, <strong>Inc</strong>. Change of Control Severance Plan, effective as of April<br />
30, <strong>2009</strong> (Exhibit 10.6 to <strong>EOG</strong>'s Quarterly <strong>Report</strong> on Form 10-Q for the quarter ended March 31, <strong>2009</strong>).<br />
10.12 - <strong>EOG</strong> <strong>Resources</strong>, <strong>Inc</strong>. Executive Officer <strong>Annual</strong> Bonus Plan (Exhibit C to <strong>EOG</strong>'s Proxy Statement, filed<br />
March 29, 2001, with respect to <strong>EOG</strong>'s 2001 <strong>Annual</strong> Meeting of Stockholders) (SEC File No. 001-09743).<br />
10.13(a) - Revolving Credit Agreement, dated as of June 28, 2005, among <strong>EOG</strong>, as Borrower, JPMorgan Chase<br />
Bank, N.A., as Administrative Agent, and the other financial institutions party thereto (Exhibit 10.1 to<br />
<strong>EOG</strong>'s Quarterly <strong>Report</strong> on Form 10-Q for the quarter ended June 30, 2005).<br />
10.13(b) - First Amendment to Revolving Credit Agreement, dated as of June 21, 2006, among <strong>EOG</strong>, as Borrower,<br />
JPMorgan Chase Bank, N.A., as Administrative Agent, and the other financial institutions party thereto<br />
(Exhibit 10.1 to <strong>EOG</strong>'s Quarterly <strong>Report</strong> on Form 10-Q for the quarter ended June 30, 2006).<br />
10.13(c) - Second Amendment to Revolving Credit Agreement, dated as of May 18, 2007, among <strong>EOG</strong>, as Borrower,<br />
JPMorgan Chase Bank, N.A., as Administrative Agent, and the other financial institutions party thereto<br />
(Exhibit 10.1 to <strong>EOG</strong>'s Quarterly <strong>Report</strong> on Form 10-Q for the quarter ended June 30, 2007).<br />
10.13(d) - Third Amendment to Revolving Credit Agreement, dated as of September 14, 2007, among <strong>EOG</strong>, as<br />
Borrower, JPMorgan Chase Bank, N.A., as Administrative Agent, and the other financial institutions<br />
party thereto (Exhibit 10.1 to <strong>EOG</strong>'s Quarterly <strong>Report</strong> on Form 10-Q for the quarter ended September 30,<br />
2007).<br />
E-5
Exhibit<br />
Number<br />
Description<br />
* 12 - Computation of Ratio of Earnings to Fixed Charges and to Combined Fixed Charges and Preferred Stock<br />
Dividends.<br />
* 21 - Subsidiaries of <strong>EOG</strong>, as of December 31, <strong>2009</strong>.<br />
* 23.1 - Consent of DeGolyer and MacNaughton.<br />
* 23.2 - Opinion of DeGolyer and MacNaughton dated February 4, 2010.<br />
* 23.3 - Consent of Deloitte & Touche LLP.<br />
* 24 - Powers of Attorney.<br />
* 31.1 - Section 302 Certification of <strong>Annual</strong> <strong>Report</strong> of Principal Executive Officer.<br />
* 31.2 - Section 302 Certification of <strong>Annual</strong> <strong>Report</strong> of Principal Financial Officer.<br />
* 32.1 - Section 906 Certification of <strong>Annual</strong> <strong>Report</strong> of Principal Executive Officer.<br />
* 32.2 - Section 906 Certification of <strong>Annual</strong> <strong>Report</strong> of Principal Financial Officer.<br />
* **101.INS - XBRL Instance Document.<br />
* **101.SCH - XBRL Schema Document.<br />
* **101.CAL - XBRL Calculation Linkbase Document.<br />
* **101.LAB - XBRL Label Linkbase Document.<br />
* **101.PRE - XBRL Presentation Linkbase Document.<br />
* **101.DEF - XBRL Definition Linkbase Document.<br />
*Exhibits filed herewith<br />
**Attached as Exhibit 101 to this report are the following documents formatted in XBRL (Extensible Business <strong>Report</strong>ing<br />
Language): (i) the Consolidated Statements of <strong>Inc</strong>ome and Comprehensive <strong>Inc</strong>ome for Each of the Three Years in the Period<br />
Ended December 31, <strong>2009</strong>, (ii) the Consolidated Balance Sheets - December 31, <strong>2009</strong> and 2008, (iii) the Consolidated<br />
Statements of Stockholders' Equity for Each of the Three Years in the Period Ended December 31, <strong>2009</strong>, (iv) the Consolidated<br />
Statements of Cash Flows for Each of the Three Years in the Period Ended December 31, <strong>2009</strong> and (v) Notes to Consolidated<br />
Financial Statements. Users of this data are advised pursuant to Rule 406T of Regulation S-T that this interactive data file is<br />
deemed not filed or part of a registration statement or prospectus for purposes of Sections 11 or 12 of the Securities Act of<br />
1933, as amended, is deemed not filed for purposes of Section 18 of the Securities Exchange Act of 1934, as amended, and<br />
otherwise is not subject to liability under these sections.<br />
E-6
SIGNATURES<br />
Pursuant to the requirements of Section 13 or 15(d) of the Securities Exchange Act of 1934, as amended, the registrant<br />
has duly caused this report to be signed on its behalf by the undersigned, thereunto duly authorized.<br />
<strong>EOG</strong> RESOURCES, INC.<br />
(Registrant)<br />
Date: February 25, 2010 By: /s/ TIMOTHY K. DRIGGERS<br />
Timothy K. Driggers<br />
Vice President and Chief Financial Officer<br />
(Principal Financial and Accounting Officer and Duly<br />
Authorized Officer)<br />
Pursuant to the requirements of the Securities Exchange Act of 1934, as amended, this report has been signed below by<br />
the following persons on behalf of the registrant and in the capacities with <strong>EOG</strong> <strong>Resources</strong>, <strong>Inc</strong>. indicated and on the 25 th day of<br />
February, 2010.<br />
Signature<br />
/s/ MARK G. PAPA<br />
(Mark G. Papa)<br />
/s/ TIMOTHY K. DRIGGERS<br />
(Timothy K. Driggers)<br />
Title<br />
Chairman of the Board and Chief Executive Officer and<br />
Director (Principal Executive Officer)<br />
Vice President and Chief Financial Officer<br />
(Principal Financial and Accounting Officer)<br />
* Director<br />
(George A. Alcorn)<br />
* Director<br />
(Charles R. Crisp)<br />
* Director<br />
(James C. Day)<br />
* Director<br />
(H. Leighton Steward)<br />
* Director<br />
(Donald F. Textor)<br />
* Director<br />
(Frank G. Wisner)<br />
*By<br />
/s/ MICHAEL P. DONALDSON<br />
(Michael P. Donaldson)<br />
(Attorney-in-fact for persons indicated)
QUANTITATIVE RECONCILIATION OF AFTER-TAX INTEREST EXPENSE (Non-GAAP), NET DEBT (Non-GAAP)<br />
AND TOTAL CAPITALIZATION (Non-GAAP) AS USED IN THE CALCULATIONS OF RETURN ON CAPITAL EMPLOYED<br />
(Non-GAAP) AND THE NET DEBT-TO-TOTAL CAPITALIZATION RATIO (Non-GAAP) TO INTEREST EXPENSE (GAAP),<br />
CURRENT AND LONG-TERM DEBT (GAAP) AND TOTAL CAPITALIZATION (GAAP), RESPECTIVELY<br />
(UNAUDITED; IN MILLIONS, EXCEPT RATIO DATA)<br />
The following chart reconciles Interest Expense (GAAP), Current and Long-Term Debt (GAAP) and Total Capitalization (GAAP) to<br />
After-Tax Interest Expense (Non-GAAP), Net Debt (Non-GAAP) and Total Capitalization (Non-GAAP), respectively, as used in the<br />
Return on Capital Employed (ROCE) and Net Debt-to-Total Capitalization ratio calculations. <strong>EOG</strong> believes this presentation may<br />
be useful to investors who follow the practice of some industry analysts who utilize After-Tax Interest Expense, Net Debt and Total<br />
Capitalization in their ROCE and Net Debt-to-Total Capitalization ratio calculations. <strong>EOG</strong> management uses this information for<br />
comparative purposes within the industry.<br />
Return on Capital Employed and<br />
Net Debt-to-Total Capitalization Ratio<br />
<strong>2009</strong> 2008 2007 2006 2005 2004 2003 2002 2001 2000 1999<br />
Interest Expense.. . . . . . . . . . . . . . . . . . . . . . . . . . . . . . . . . . . . . . . . . . $ 100.9 $ 51.7 $ 46.8 $ 43.2 $ 62.5 $ 63.1 $ 58.7 $ 59.7 $ 45.1 $ 61.0<br />
Tax Benefit Imputed (based on 35%) . . . . . . . . . . . . . . . . . . . . . . . . . . (35.3) (18.1) (16.4) (15.1) (21.9) (22.1) (20.5) (20.9) (15.8) (21.4)<br />
After-Tax Interest Expense (Non-GAAP) - (a). . . . . . . . . . . . . . . . . . . $ 65.6 $ 33.6 $ 30.4 $ 28.1 $ 40.6 $ 41.0 $ 38.2 $ 38.8 $ 29.3 $ 39.6<br />
Net <strong>Inc</strong>ome - (b) . . . . . . . . . . . . . . . . . . . . . . . . . . . . . . . . . . . . . . . . . . $ 546.6 $ 2,436.9 $1,089.9 $1,299.9 $1,259.6 $ 624.9 $ 430.1 $ 87.2 $ 398.6 $ 396.9<br />
Total Stockholders’ Equity - (c) .. . . . . . . . . . . . . . . . . . . . . . . . . . . . . . $ 9,998.0 $ 9,014.5 $6,990.1 $5,599.7 $4,316.3 $2,945.4 $2,223.4 $1,672.4 $1,642.7 $1,380.9 $1,129.6<br />
Current and Long-Term Debt - (d) . . . . . . . . . . . . . . . . . . . . . . . . . . . . $ 2,797.0 $ 1,897.0 $1,185.0 $ 733.4 $ 985.1 $1,077.6 $1,108.9 $1,145.1 $ 856.0 $ 859.0 $ 990.3<br />
Less: Cash.. . . . . . . . . . . . . . . . . . . . . . . . . . . . . . . . . . . . . . . . . . . . . . . (685.8) (331.3) (54.2) (218.3) (643.8) (21.0) (4.4) (9.8) (2.5) (20.2) (24.8)<br />
Net Debt (Non-GAAP) - (e).. . . . . . . . . . . . . . . . . . . . . . . . . . . . . . . . . $ 2,111.2 $ 1,565.7 $1,130.8 $ 515.1 $ 341.3 $1,056.6 $1,104.5 $1,135.3 $ 853.5 $ 838.8 $ 965.5<br />
Total Capitalization (GAAP) - (c) + (d) . . . . . . . . . . . . . . . . . . . . . . . . $12,795.0 $ 10,911.5 $8,175.1 $6,333.1 $5,301.4 $4,023.0 $3,332.3 $2,817.5 $2,498.7 $2,239.9 $2,119.9<br />
Total Capitalization (Non-GAAP) - (c) + (e) . . . . . . . . . . . . . . . . . . . . $12,109.2 $10,580.2 $8,120.9 $6,114.8 $4,657.6 $4,002.0 $3,327.9 $2,807.7 $2,496.2 $2,219.7 $2,095.1<br />
Average Total Capitalization (Non-GAAP)* - (f). . . . . . . . . . . . . . . . . $ 11,344.7 $ 9,350.6 $7,117.9 $5,386.2 $4,329.8 $3,665.0 $3,067.8 $2,652.0 $2,358.0 $2,157.4<br />
Return on Capital Employed (ROCE) (Non-GAAP) - [(a) + (b)] / (f). . 5.4% 26.4% 15.7% 24.7% 30.0% 18.2% 15.3% 4.8% 18.1% 20.2%<br />
Average ROCE (Non-GAAP) 2000-<strong>2009</strong>. . . . . . . . . . . . . . . . . . . . . . . 17.9%<br />
Debt-to-Total Capitalization (GAAP) - (d) / [(c) + (d)] . . . . . . . . . . . . 21.9%<br />
Net Debt-to-Total Capitalization (Non-GAAP) - (e) / [(c) + (e)].. . . . . 17.4%<br />
*Average of “Total Capitalization (Non-GAAP)” for the current and immediately preceding year<br />
Below are definitions for certain quantitative measures used in the Letter to Stockholders:<br />
Stock Appreciation<br />
Stock appreciation represents the increase in stock price during the period and is expressed as a percentage of the stock price at the<br />
beginning of the period.<br />
Total Reserve Replacement Costs from All Sources<br />
Total reserve replacement costs from all sources is the ratio of net reserve additions from drilling, acquisitions, total revisions and<br />
dispositions to total production.<br />
105
Glossary of Terms<br />
Bcf<br />
Bcfe<br />
$/Bbl<br />
$/Mcf<br />
MBbld<br />
MMboe<br />
MMcfd<br />
MMcfed<br />
NYMEX<br />
NYSE<br />
S&P<br />
Tcfe<br />
Billion cubic feet<br />
Billion cubic feet equivalent<br />
Dollars per barrel<br />
Dollars per thousand cubic feet<br />
Thousand barrels per day<br />
Million barrels of oil equivalent<br />
Million cubic feet per day<br />
Million cubic feet equivalent per day<br />
New York Mercantile Exchange<br />
New York Stock Exchange<br />
Standard and Poor’s<br />
Trillion cubic feet equivalent<br />
106
Officers and Directors<br />
Directors<br />
George A. Alcorn (1)<br />
Houston, Texas<br />
President, Alcorn Exploration, <strong>Inc</strong>.<br />
Charles R. Crisp (2)<br />
Houston, Texas<br />
Investments<br />
James C. Day (3)<br />
Sugar Land, Texas<br />
Retired Chairman of the Board and<br />
Chief Executive Officer,<br />
Noble Corporation<br />
Mark G. Papa<br />
Chairman of the Board and<br />
Chief Executive Officer,<br />
<strong>EOG</strong> <strong>Resources</strong>, <strong>Inc</strong>.<br />
H. Leighton Steward (4)<br />
Cody, Wyoming<br />
Author-Partner, Sugar Busters, LLC<br />
Donald F. Textor (5)<br />
Locust Valley, New York<br />
Portfolio Manager, Dorset Management<br />
Corporation and Partner, Knott Partners<br />
Management LLC<br />
Frank G. Wisner (6)<br />
New York, New York<br />
International Affairs Advisor,<br />
Patton Boggs LLP<br />
Officers<br />
(including key subsidiaries)<br />
Mark G. Papa<br />
Chairman of the Board and<br />
Chief Executive Officer<br />
Loren M. Leiker<br />
Senior Executive Vice President, Exploration<br />
Gary L. Thomas<br />
Senior Executive Vice President, Operations<br />
Kurt D. Doerr<br />
Executive Vice President and<br />
General Manager, Denver<br />
Robert K. Garrison<br />
Executive Vice President, Exploration<br />
William R. Thomas<br />
Executive Vice President and<br />
General Manager, Fort Worth<br />
Frederick J. Plaeger, II<br />
Senior Vice President and General Counsel<br />
Paul Arnott<br />
Vice President and General Manager,<br />
<strong>EOG</strong> <strong>Resources</strong> Canada <strong>Inc</strong>.<br />
Maire A. Baldwin<br />
Vice President, Investor Relations<br />
Sandeep Bhakhri<br />
Vice President and Chief Information Officer<br />
Timothy K. Driggers<br />
Vice President and Chief Financial Officer<br />
Kenneth E. Dunn<br />
Vice President and General Manager,<br />
Corpus Christi<br />
Patricia L. Edwards<br />
Vice President, Human <strong>Resources</strong> and<br />
Administration<br />
Marc R. Eschenburg<br />
Vice President, Marketing and<br />
Regulatory Affairs<br />
David J. Griffiths<br />
General Manager, <strong>EOG</strong> <strong>Resources</strong><br />
United Kingdom Limited<br />
Kevin S. Hanzel<br />
Vice President, Audit<br />
Lloyd W. Helms, Jr.<br />
Vice President and General Manager,<br />
Canada Shale Project<br />
Raymond L. Ingle<br />
Vice President and General Manager,<br />
Midstream<br />
Ann D. Janssen<br />
Vice President, Accounting<br />
Ernest J. LaFlure<br />
Vice President and General Manager, Tyler<br />
Helen Y. Lim<br />
Vice President and Treasurer<br />
Lindell L. Looger<br />
Vice President and General Manager,<br />
International<br />
President, <strong>EOG</strong> <strong>Resources</strong> International, <strong>Inc</strong>.<br />
Tony C. Maranto<br />
Vice President and General Manager,<br />
Oklahoma City<br />
Richard A. Ott<br />
Vice President, Tax<br />
Curtis C. Parsons<br />
Vice President and General Manager,<br />
Fort Worth North<br />
Sammy G. Pickering<br />
Managing Director, <strong>EOG</strong> <strong>Resources</strong><br />
Trinidad Limited<br />
Gary L. Pitts<br />
Vice President and General Manager,<br />
Midland<br />
Gary L. Smith<br />
Vice President and General Manager,<br />
Pittsburgh<br />
Robert C. Smith<br />
Vice President, Drilling<br />
J. Pat Woods<br />
Vice President and General Manager,<br />
Fort Worth South<br />
Michael P. Donaldson<br />
Corporate Secretary<br />
James C. Fletcher<br />
Controller, Land Administration<br />
John H. Haskins<br />
Controller, International Accounting<br />
Janet B. Johnson<br />
Controller, Compliance and Controls<br />
Joseph C. Landry<br />
Controller, Operations Accounting<br />
Gary Y. Peng<br />
Controller, Financial <strong>Report</strong>ing<br />
Robert L. West<br />
Controller, Financial Planning<br />
(1) Chairman, Compensation Committee;<br />
Member, Audit and Nominating and<br />
Governance Committees<br />
(2) Member, Audit, Compensation and Nominating<br />
and Governance Committees; 2010 Presiding<br />
Director<br />
(3) Member, Audit, Compensation and<br />
Nominating and Governance Committees;<br />
<strong>2009</strong> Presiding Director<br />
(4) Member, Audit, Compensation and Nominating<br />
and Governance Committees<br />
(5) Chairman, Audit Committee; Member,<br />
Compensation and Nominating and<br />
Governance Committees<br />
(6) Chairman, Nominating and Governance<br />
Committee; Member, Audit and Compensation<br />
Committees<br />
107
STockholder Information<br />
Corporate Headquarters<br />
1111 Bagby, Sky Lobby 2<br />
Houston, Texas 77002<br />
P.O. Box 4362<br />
Houston, Texas 77210-4362<br />
(713) 651-7000<br />
Toll Free: (877) 363-<strong>EOG</strong>R<br />
www.eogresources.com<br />
Common Stock Exchange Listing<br />
New York Stock Exchange<br />
Ticker Symbol: <strong>EOG</strong><br />
Common Stock Outstanding at December 31, <strong>2009</strong>: 252,508,652 shares<br />
Transfer Agent<br />
Computershare Trust Company, N.A.<br />
P.O. Box 43078<br />
Providence, Rhode Island 02940-3078<br />
Toll Free: (877) 282-1168<br />
Outside U.S.: (781) 575-2000<br />
www.computershare.com<br />
Hearing Impaired: TDD (800) 952-9245<br />
2010 <strong>Annual</strong> Meeting of Stockholders<br />
<strong>EOG</strong>’s 2010 <strong>Annual</strong> Meeting of Stockholders will be held at 3 p.m., Houston time, at the Doubletree Hotel, 400 Dallas Street,<br />
Houston, Texas 77002, on Wednesday, April 28, 2010. Information with respect to the annual meeting is contained in the proxy<br />
statement sent with this <strong>Annual</strong> <strong>Report</strong> to holders of record of <strong>EOG</strong> Common Stock. This <strong>Annual</strong> <strong>Report</strong> is not to be considered a part<br />
of <strong>EOG</strong>’s proxy soliciting material for the annual meeting.<br />
Certifications<br />
In <strong>2009</strong>, <strong>EOG</strong>’s Chief Executive Officer (CEO) provided to the New York Stock Exchange (NYSE) the annual CEO certification<br />
regarding <strong>EOG</strong>’s compliance with the NYSE’s corporate governance listing standards. In addition, <strong>EOG</strong>’s CEO (principal executive<br />
officer) and <strong>EOG</strong>’s principal financial officer filed with the United States Securities and Exchange Commission (SEC) all certifications<br />
required in <strong>EOG</strong>’s SEC reports for fiscal year <strong>2009</strong>.<br />
Additional Information<br />
Additional copies of this <strong>Annual</strong> <strong>Report</strong> (as well as copies of any of the exhibits to the Form 10-K included herein) are<br />
available upon request by calling (877) 363-<strong>EOG</strong>R; by writing <strong>EOG</strong>’s Corporate Secretary at <strong>EOG</strong> <strong>Resources</strong>, <strong>Inc</strong>., 1111 Bagby,<br />
Sky Lobby 2, Houston, Texas 77002; or by visiting the <strong>EOG</strong> website at www.eogresources.com. Quarterly and annual earnings press<br />
release information for <strong>EOG</strong> and <strong>EOG</strong>’s SEC filings also can be accessed through <strong>EOG</strong>’s website.<br />
Financial analysts and investors who need additional information should visit the <strong>EOG</strong> website at www.eogresources.com or<br />
contact <strong>EOG</strong>’s Investor Relations department at (713) 651-7000.<br />
108
Our Employees Harold Abernathy Ismael Abila Raymie Abney Renesha Abraham Erlinda Abrego Linda Acosta Kimberly Adams Sharon Adams Michael Adrion Tonya Adrion Amer Afifi Candelario Aguilar Amit Ahuja<br />
Tanvi Ahuja Roberto Alaniz Jennifer Alba Melissa Albert Myrna Albright Mahdee Aleem Cesar Aleman Janice Alexander Patrick Alexander Joseph Alexander Sheena Ali Gabriella Aliberti Raymond Allbee Kenneth Allemand<br />
Kenneth Allen Susan Allen Andrew Allison Ariana Alvarez Douglas Amburn Martin Amorrortu Junior Andall Amanda Anderson Cathy Anderson Donna Anderson Jeremy Anderson Karen Anderson William Anderson<br />
Chris Anderson Joseph Anderson Francisca Andreassen Nathan Andrews Catherine Aniello Jim Anschutz Barbara Anselm Osman Apaydin Sandra Apodaca Andres Arambula Blaine Ardelian Mario Arevalo Rene Argueta<br />
Erick Armentrout Ralph Armentrout Donald Armstrong Cody Arnold Lance Arnold Paul Arnott Leslie Ashby Gerald Ashcraft Dana Assen Carlotta Audain-Campbell Marie Auger Richard Austin Terry Avery Mario Avila<br />
Sammie Bagley Amanda Bailey Diane Bailey John Bailey Michael Bailey Michael Bailey Steven Bailey Kathryn Bailey Leona Bailey Amanda Baker Kevin Baker Lanny Baker Trent Baker Bryan Baldwin Maire Baldwin<br />
Lorraine Baline Jerry Ball John Ball William Ball Blaine Balmer Valeria Banks Bijay Banthia Brian Baptiste Kristian Baptiste Randy Barber Linda Barberousse Guy Bardwell Tarra Barker Judy Barlow Brett Barnes Cheryl Barnes<br />
James Barnes Kelley Barnett Leslie Barney Daniel Barone Rosalinda Barragan Andrew Barrera Emilio Barrera Hector Barrera Anthony Barrett Jennifer Barron Amanda Bartlett Jerrett Bartlett Kelli Barton Leah Barton<br />
Sandra Barton Michelle Bates Dale Bawol Crystal Baxter Richard Bayes Jessica Beaman Ana Beasley Megan Beatty Donna Beauchamp Michelle Beauchamp Jennifer Beavers Gary Beck Geff Beck John Becker Navneet Behl<br />
Kelly Belanger Barbara Belcher Heath Bell Michael Bell Heather Bell Corallini Olynda Bello Viktor Belski Adriana Benavides Vicky Benavides Tammy Benishek Kristy Bennett Steven Bennett Amanda Bennett Tana Bennett<br />
Gust Benninger Roy Benteau Andrew Bentley Melvin Bentley John Bergquist Martha Bernardini Kerry Bernas Timothy Berry Caroline Bertuzzi Berwin Best Brad Betsworth Sandeep Bhakhri Benjamin Biery Jerry Biggs<br />
Albert Billman James Binegar Blaine Bischoff Sidney Bjorlie Camille Black Mindy Black Randolph Blackburn Ben Blackwelder Brad Blackwood Carolyn Bladek Sibyl Blankenship Phebe Blaylock Dana Blevins Teresa Block<br />
Ronnie Blue Gary Blundell Stanley Blundell Jonathan Bocox Kenneth Boedeker Susan Boedeker David Boerm David Boisjolie Paul Boland Wendy Bone Alisa Booth Joshua Boren Vera Boren Susan Borgan Kyle Borrello<br />
Stewart Bosch James Bouillion Deidra Bourland Steven Bowker Ashley Bowman Jamie Bowman John Boyd Lorne Brack Mary Bradford Al Bradley Diane Bradley Tom Bradley Bryan Brandon Laurie Brandon Cheryl Brashear<br />
Ronald Braswell Natalie Brayton Larry Brazile Karyn Breeckner Mike Brietzke Susan Bright David Brinkerhoff Brad Briscoe Georgia Briscoe Terry Bristol Gary Britt Matthew Britt Rachel Britt Sonia Brittain Mary Brooke<br />
Michael Brooks Timothy Broom Burt Broussard Amber Brown Brandon Brown Jeff Brown Roger Brown Winfred Brown Jennifer Brown Robert Brown John Bruch David Brunette Linda Bruster James Bucci Fayetta Burch<br />
Kerry Burdett Darryl Burger Geoff Burkart Rick Burke Stephen Burke Wesley Burke Eric Burkholder John Burnette Shaun Burris Amanda Burt Laurie Burt Paul Burt Shelley Burt Richard Burton Sandra Burton Brandy Butler<br />
Lee Butler Scott Buttross Gwen Buye Ron Buye Brant Buzbee Janice Byam Barry Byars Dustin Bynum Deborah Byrd Kenneth Byrd William Byrd Christina Byrom Kim Cadena Ronald Cafagna Brad Cage Robert Cahill<br />
Min Cai Patricia Cain David Cain Jared Calder Christopher Caldwell Victoria Calhoun Ingrid Callender Howard Cameron Carleen Campbell Catherine Campbell David Campbell Stephen Campbell Daniel Canales<br />
Charlotte Candler Louis Cann Stephanie Cano Joseph Cantu Julie Cao Emmett Capt Michael Caputi Joseph Caputo John Cardin Santos Cardona Courtney Carlton Skipper Carnes Ronald Carney Cary Carrabine<br />
Darin Carrasco Noemi Carrillo Leland Carroll Robert Carroll Gary Carson Kristin Carson Carmeletha Carter Kenneth Carter Larry Carter Susan Carulli Curtis Carver David Carver Cathy Castaneda Nicholas Castaneda<br />
Jesus Castillo Rebecca Castro-Lowe Nina Catalucci Dennis Cates Sharon Caudill Jonathan Cave Mike Cervantes David Chadwick Richard Chaffe Paula Chaffin Shelly Chan Lindsay Chandler John Chapman William Chapman<br />
Narvin Charles Kathy Ann Charles-Sylvester Carrie Charlton Travis Charnetzki Andres Chavez Laura Chavez Thomas Chen Dong Chen Linda Chenoweth Julie Cherry Ross Cherry Jacob Chew Erin Childs Helen Chin<br />
Janice Chin-wing Drayton Andrew Chodur Young Chon Tracey Chong-Ashing Erin Chorney Penny Chrisman Lorne Christal Beverly Christensen Kevin Christensen Michael Christensen Elnora Christoffersen Douglas Chrumka<br />
Kamal Chunilal Scott Church Albert Clark John Clark Sandra Clark Terrence Clarke Eugene Clower Linda Cluiss Crystal Cobb Letitia Cobb Sherron Codogan Brett Coe Donna Coe Rachel Coe Bruce Coit Ruby Cole<br />
Carolyn Coleman Clifton Coleman James Coleman Jeremy Coleman Steven Coleman Robert Coles Randel Collar Chuck Collier Daniel Collins Charles Colson Rene Concialdi Paul Connolly Erica Conroy Duane Cook<br />
Karen Cook Lisa Cook Melanie Cook Michael Cooksey Tyler Coon Laura Cooper Michael Cooper Kevin Copeland Lisa Copeland Craig Cormany Neal Cormier Mike Cornell Paul Corrales Jonnathan Coston Roy Coston<br />
Stephen Couch Tommy Coulter Yvette Counts Mary Courtney Leon Covell III David Covill Kim Cowherd Sara Cowles Mark Cox Russell Cox Tyler Cox Jack Cozart Jeff Crabbe Logan Craig Alicia Craigwell Malinda Crall<br />
Douglas Cramer Garth Cramer Bette Cranford Janice Cravens Dee Cravy Nora Crawford Misti Creach Allen Cregg Robert Crim Stacie Crosby Rosa Crotty Barry Crowder Phyllis Croy Stephen Croy Herminia Cruz Terry Csere<br />
Wade Cuch Valerie Culpepper Ferdinand Cumberbatch James Cunkelman Peter Cunningham Tracy Cunningham Anton Dach Jesse Daggett Jeff Dahl Qi Dai Vivian Dai Kenneth Dalton Wendy Dalton Fassil Daniel<br />
Timothy Daniels Marsha Danzell Leandro Daponte Judy Dargin Roger Dart Stephanie Daugherty Doumonyo Daukoru Bryan David Richard Davidson Donna Davies David Davis Douglas Davis Dustin Davis Jodie Davis<br />
Lawrence Davis Randall Davis Richard Day David Deal Rochelle deGuzman Howard Deis Jennifer Del Tatto Steven DeLand Chris Delcambre Gloria DelCampo James DelCampo Joseph DelCampo Brenda Dellinger<br />
Zhen An Deng Amanda Dennis Bobby Dennis Brian Desmond Kent Devenport Clinton Devillier Isaac DeVilliers Ronald Devoll Otto Dick Debbie Dickey Gary Dill Eric Dille Trudy Dillon Pam DiValerio John Dixon Annette Dobson<br />
Kurt Doerr Brian Dolezal Daniel Domingue Kimberly Dominguez Manuel Dominguez Kathryn Donaldson Michael Donaldson Daryl Doodnath Jeff Dort Timothy Dort Ashley Douglass Wallace Dow Richard Downey<br />
Johnny Downing Hollie Downs John Downs Rebecca Doyle Patrick Draves Timothy Driggers Candy Driscoll Barbara Drosche Hans Dube Darrah Duchscherer Rafe Dudley Denis Dufresne Cynthia Duge Lucas Duke<br />
James Dunford Kenneth Dunn George Dupre Brian Durman Robert Dysart Karen Ebbert Stacey Eddings James Edgeman Madeline Edgley Dianne Edwards Donald Edwards Patricia Edwards Tara Edwards<br />
Danielle Edwards-Dupay Kurt Eggebrecht Tug Eiden Cynthia Einkauf Enoch Elizondo Jerome Ellard Terrence Elliot Edward Elliott Keith Elliott Jennifer Elliott Ashley Ellis Jerald Ellis Robert Ellis Steven Ellis Ty Ellis<br />
Donna Ellsworth Lorena Ellsworth John Ellyson William Elmer Jerome Elmlinger Kivonda Elmore Anna England Taggart English Ronald Ensminger Karen Erwin Marc Eschenburg Douglas Esmond Amanda Espinosa<br />
Jaime Espinosa Marcus Estes Sandra Estrada Albert Evans Betty Evans Carol Evans-Danver Robert Evanson Beverly Fabian Kathleen Fabra Clyde Faggett James Falconi Roger Falk Timothy Farnham Ryan Farquhar<br />
Klinton Farrar Eileen Faulk Carol Faullon Rick Feger Richard Fehr Mike Felice Krista Felts Len Ferguson Olga Ferrell Matthew Fey Daniel Fischer James Fischer Jeanine Fisher Sharie Fisher Heather Fjeld David Fleming<br />
Jason Fleniken Amber Fletcher James Fletcher Robert Fletcher Willam Fletcher Paul Florentino Criselda Flores Michael Flowers Clifford Fobes Richard Fobes James Folcik Neil Footh Nancy Ford Kirk Foreman Larry Formo<br />
Lee Forrest Karen Forrester Edwin Forsman Cindy Forsyth Susan Forsyth Mark Fortuna Therese Foster Ilona Fournier Larry Fournier John Fowler Daniel Fox Brandon Fox Lonnie Fox Nancy Fox Charles Francis Jesse Francis<br />
Charles Franck Lydia Franco Christine Frank Deborah Franklin Danny Frederick Ashley Freeman Brian Freeman Reginald Freestone Brandon Fretheim Judy Frey William Fricker Gerald Froidl David Frye Laura Fuentes<br />
Jason Fulkerson Benjamin <strong>Full</strong>er Timothy Fusselman Heather Gable Timothy Gable Jared Gabro Sharleen Gale Jeremy Galeski Chris Gallant Jesus Gallegos Barbara Ganong Stephen Garber Debra Garcia Jeremias Garcia<br />
Nancy Garcia Vic Garcia Cody Gardiner Kaylene Gardner Michael Gardner Trevor Gardner Jennifer Garner Dwayne Garnett Matthew Garrison Robert Garrison Mark Garza Patricia Garza Lindsey Gates Mickenzie Gates<br />
Richard Gauthier Debra Gay Marshall Gazette Maria Geerligs Jamie Gehringer Gregory Geis Jared Geis Virginia Gent Zola George Jim Gerlinger Karen Gibson Mark Gibson Owen Gibson Jeff Gigstad Kenney Gilbreath<br />
Emily Gillis Yvonne Gilmore Marilyn Giroir Donny Glanton Elmo Glover Michael Goad Anelia Gogova Tracy Goich-Peterson Jeff Goldberg Jessica Goldsmith Scott Goldsmith Gregg Gomez Derek Gonet Melinda Gonor<br />
Evan Gonzalez Jose Gonzalez Juanita Gonzalez Mary Goode Ollie Goodwin Freddie Gordon Stephen Gordon Casey Gordy Linda Goroniuk Mark Gorski Lisa Gosine-Alleyne Richard Goulet Sam Governale Amy Graham<br />
Danny Graham Donald Grant Dortha Gray James Gray Katherine Gray Michael Gray Mitchell Gray Pamela Gray Betty Green Bryan Green Jayne Green Karen Greengrass Norma Greenlee Rebecca Greenwood James Gregory<br />
Leslie Griffin Stanley Grimes Carrie Grin Mary Grisaffi Lisa Groen Wayne Groo Nicholas Groves Judy Guebara Joseph Guerrero Evelyn Guess Carla Guillaume-Escalante John Guillot Michelle Gummelt Kevin Gunder<br />
Randy Gustin Shaun Guthrie Laura Guzman Dalan Haase Natalie Haase Allen Hacking Jody Hadden William Hadley Kenneth Haggard Simret Hagos Tammy Hajovsky Alex Hale Kent Hale Leta Hale Callaway Hall Durk Hall<br />
Kelly Hall Matthew Hall Vivi Ann Hall Robert Halverson Ronny Halvorson Aarne Hamalainen Kenna Hambor Chris Hames Debra Hamilton Lee-Anna Hamilton Sabrina Hamilton Phillip Hampton Debbra Hamre Jamie Hanafy<br />
Kirk Hanberg Donna Haney Cynthia Hanselman Leo Hanselman Susan Hanselman Andrew Hanson Kevin Hanzel Ricky Hardaway Bart Hardman Tim Hargrove Sean Harlan Jeffery Harmon Robert Harp Dorothy Harper<br />
Rachel Harrell Mitchell Harriman Etta Harris Jamie Harris Kristina Harris Sherry Harris Dianne Harris Jacob Harrison Pamela Harrison Steven Harrison William Harrison IV Burton Hartley Lance Hartwell Stephen Haskell<br />
Warren Haskell John Haskins Mark Hately James Hatfield Tammy Hatfield Ricky Hathaway Michele Hatz Gina Hauck Debbie Haugen Jeanne Hawkes Erin Hawkins Gordon Haycraft Brian Hayes William Haynes Britt Hazelbush<br />
Yong He Brent Hecht Michael Heil Lloyd Helms Sherron Helton Jennifer Henderson Bryan Hendricks Cody Hendricks Lois Hendricks Dustin Henline Bryan Hennigan James Henning James Henry Cory Hepburn Conrad Hergert<br />
Alfredo Hernandez Eduardo Hernandez Rosalinda Hernandez Irene Herrera Billy Hester Tom Heydt Michael Heymann Becky Hicks Edward Hicks Jade Hicks Vicki Hietpas John Hill Van Hill Elise Hillman Stephen Himes<br />
Robert Hinsley Kathryn Hinson Luke Hise Linda Hoagland Thanh Hoang Cecil Hodges Randy Hodgins Chris Hoefer Trevor Hoff Darby Hoffman Deanna Hoffman James Hoffman Myron Hoffman Margaret Hogan Edward Hohos<br />
Derek Holeman Bryan Holgate Danny Holgate Jared Holgate Kasey Holland Sara Holland Nathan Hollek James Holley Jayne Hollier Wendell Holman Brant Holmes Derrik Holmes Kelli Holmes Mitchell Holmes Justin Holsworth<br />
June Holt Wayne Holt Shay Holte Rhonda Holtgreive Erich Holzer Blake Hopkins Ashraful Hoque Garland Horak Jerry Horn Stacy Horn Kimberly Horrocks Helen Hosein-Mulloon Gary Don House Marion Houser III<br />
David Houston Rick Hovland Glenn Howard Stephen Howell Karly Howerton Andrew Hoyle Donna Hradil LiYing Hsu Jack Huang Sean Huang Robert Hubbert Michael Huber Frank Hudec John Hudec Brandy Hudson<br />
Randall Hulme Deanne Hulquist Robert Humphreys Wan-Hsiang Hung Patricia Hunt Lisa Hunter Michael Huntington Douglas Hurlbut Timothy Hutchins Mazher Ibrahim Marie Ice Lee Icenhower Diana Igleheart Silvia Iglesias<br />
Jack Imboden Raymond Ingle Greg Ingram Kathleen Insley Michael Isaacs Allan Itz Elizabeth Ivers Diana Jablonski Amber Jackson Herschel Jackson Karl Jackson Kenneth Jackson L.J. Jackson Melinda Jackson<br />
Robert Jackson Ronald Jackson Greg Jackson Gregory Jacobsen Robert Jakeway William Jakeway George James Ann Janssen Darryl Janssen Tracey Jarmin Renee Jarratt Lonnie Jeannerett Donna Jenkins Ronny Jenkins<br />
Donna Jensen Tessa Jigmeddorj M. Teresa Jimenez Ling Jin Bruce Johnson Byron Johnson Charles Johnson Corby Johnson Cynthia Johnson David Johnson Deborah Johnson Derek Johnson Donna Johnson Jacob Johnson<br />
Janet Johnson Sonya Johnson Barrie Johnson David Johnston Patricia Johnston Jason Johnstone John Joiner Casey Jones Gregg Jones Linda Jones Patricia Jones Sherry Jones Emile Jones Tiffany Jones Jon Jorgenson<br />
James Joyce LaTonya Judon Sheri Jurecek Henry Kane Ronald Kane Teresa Kaplan Terrence Karka Olaf Karlsen Keith Karow Janene Kauffman Herb Kautzsch Dale Keeley Steven Keenan Thomas Keetley Lex Keim<br />
Kenneth Kelley Theodore Kelly Howard Kemp John Kennah Wilbur Kennedy Tammy Kennedy-Andrews James Kerbow Paula Kettle Madiha Khan Sharif Khan Amanda Khan Shazeeda Khan-Seemungal Madiha Khurshid<br />
Robert Kidney Allison Kidwell Omar Kilday George Killmer Billy Kimbro Nancy Kimbro Ashley Kinder Henry Kindschi Richard King Rick King Kendall Kingsland Melinda Kinkel Jodi Kipp Christopher Kirgan Carol Kirksey<br />
Timothy Kirksey Tracy Kisell Colton Kissling Denise Klatt Derek Klein Mildred Kleinschmidt Julie Klepac Ellen Klimenko Erik Kling David Knier Clinton Knight Gerald Knight Lisa Knight Terry Knighton Ronald Knippa<br />
Christian Knittel Donald Koenig Anthony Koester Dawn Kokaram Gina Kolb Thomas Kolich Saul Korrodi Joseph Kovash Ashton Kozeal Joseph Kozeal Matthew Kozeal Wayne Kozub Nancy Krahn Lynn Krailo Albert Kucharski<br />
Tanawan Kulachanpises Jeffery Kummer Charles Kunze Jeri Kuster Cyril Lackey Nancy Lackey Sarah Lacy Ernest LaFlure Jason LaGrega Gordon Lain Cindy Lambert George Lambert Natalie Lamont Philip Lamsens Katie<br />
Ann Lancaster John Landreth Jeffery Landrum Randy Landrum Thomas Landrum Joseph Landry Lee Lane John Lang Paige Langford Kent Langhofer Sean Langhout Christopher Lanning Richard Lanning Reese Lantrip<br />
Mona Largent Janice Laughery Joan Laury Peggy Lavine Jill Lawhon Daniel Lawrence Allen Lawrence Jeff Lawrence Cynthia Lawson Herman Lawson Lugard Layne David Layton Michael LeBaron William Leflar Shelley Leggitt<br />
Tommy Lehman Loren Leiker Philip Leimer Jeffrey Leitzell Charles Lemon Tien Leon Kevin Leonce Brent Lesy Herman Leung Randolph Lewellen Brad Lewis Clara Lewis Dan Lewis Kandedreal Lewis Katherine Lewis<br />
Gareth Lewis Megan Lewis Neil Lewis Genelia Lezama Helen Li Robert Li Lori Lieb Allen Light Gloria Light James Ligon Sherry Lilly Helen Lim Jie Lin Bradley Lindsey Timothy Linscott Eric Lippincott Carolyn Liptrap<br />
Roberto Lira Scott Listiak Henry Liu Lizzy Liu James Lively Martin Livingston Elaine Lloyd Jennifer Lo John Lock Rachel Lock Brian Locke Noemi Lockhart Wendy Lockie Milford Lockwood Debbie Logan Conrad Lohoefer II<br />
Chelsea Long David Long Robert Long Shola Longe Lindell Looger Annel Lopez Brian Lopez Ernest Lopez Juan Lopez Michelle Lopez Jerome Lopez Jonathan Loreco Cary Loughman Robert Love Carolyn Lowrey<br />
Sonny Lozano Rowena Lozares James Lucas Allen Luckow Jeanene Lueckemeyer Rachel Lundy Paul Lunsford Nanette Lupcho Eric Lyche Clarissia Lynn Jocelyn Lyrock Christopher Mabe Stewart MacCallum Carrie MacDonald<br />
Teryl Mackintosh Mary Maestas Imelda Magbag Douglas Magee John Magee Darryl Magnusson Devanand Maharaj Sarah Majors Tara Malayandi Charles Mallary Marla Mallett-Davis Shawn Malsam Lori Mangus<br />
Davina Manohar Preston Mansor Donald Manton Catherine Manzanares Tony Maranto Kenneth Marbach Marielle Marchalle Anthony Marino Colleen Marples Kevin Marshall Michelle Marshall Christine Martin Heather Martin<br />
Rebecca Martin Rodney Martin Susan Martin Thelma Martin Thomas Martin Jimmy Martinez Jose Martinez Kelly Mason Mark Mathias Beverly Matthews Eric Matus Mervin Matus Brian Mauldin David May Jeffrey May<br />
Joshua May Michelle Mayo Susannah Mayo Eugene Maze Robert McAuley Naomi McBeath Ronald McBee George McBride Robert McBryde Ricky McCaslin Sophia McCatharn Kenn McComb Lee McCormick Thomas McCray<br />
Daniel McCright Nonnie McDermott John McDonald Jay McIntyre Kimery McKaskle Blake McKenna Michael McKenzie Peter McKeon Douglass McKibben Kenneth McKinley Lindsay McKinney Brian McKinstry<br />
Madeline McKneely Jason McLaren William McLeod Beverly McMahan Julie McMickell Lauren McMurrey John McNally Tolliver McNeill Katrina McQuoid Rick Mead Brooks Meadows David Meadows David Mearns<br />
John Mears Gregory Meisner John Melby David Men Monica Mendoza Gail Meyer Tina Meyer Anthony Meyer Pearl Meyer Eloise Meza Jane Mi Greer Mick Kenneth Middlemiss Rudy Mikulec Rick Miles Shante Miles<br />
Jill Miller Matthew Miller Patricia Miller Sara Miller Toni Miller Robert Milne Erica Milton Jenny Min Shannon Misura Antonia Mitchell Karen Mitchell Pamela Mitchem Christopher Moffat Saaliha Mohammed Shazmin Mohammed<br />
Ganesh Mohanrao Lisa Molinar Steven Molitor Anthony Monariti Carlos Mondragon Byron Monk Jeffrey Monk Rachael Monroe Selwyn Monsegue Delores Montoya Judith Montoya Max Monty Carol Monty Laura Moon<br />
Leah Moon Mark Moore Aramis Morales Brooke Morales Melvin Morgan William Morgan Douglas Morgareidge Andrew Morris Cheryl Morris William Morris Andre Morris Thomas Morrison Richard Morton Roger Motley<br />
Michael Moton Ashley Mott Pat Moya Terrence Moye Douglas Mueller James Mullen Timothy Mullen Arthur Mullenax Raymond Mullins Alonzo Munoz Linda Munoz Robert Munoz Steve Munsell Madhavi Muralidhar<br />
Brian Murphy Courtney Murphy Jeremy Murphy Thomas Murphy William Murphy William Murphy William Murphy Vincent Murray Ramey Musgrave Christopher Myers Ralph Myers Torrey Myers Rodelio Nacomel Harry Nanan<br />
Yolanda Naranjo Amy Nash Shareen Nash Daniel Nasser Camille Nath Juanita Nava Debra Navratil Owen Neale Laura Needles Brian Neemar John Neffendorf Carolyn Neill Jimmy Nelson Douglas Ness Shona Ness<br />
Adrian Neumann Amanda Neville Mike Newell Hanh Nguyen Tuyen Nguyen Judy Nichols Kory Nickell Lisa Nickens Kristopher Nielsen Randy Nielsen Thomas Nielsen Richard Nies Orrison Niles Xiaomei Ning Sherly Nissing<br />
Sunni Nix Amy Noack Scott Nordstrom Joel Noronha Tracey Norris Christopher Northington Bobbie Norton Lori Nugent Timothy Nugent Janie Null Terry Nunn Martha Nutter Frank Nye Larry Oberg Perry Obert Kolton Obritsch<br />
Ronald Oden Lori Odom John O’Donnell Amos Oelking III Jim Oelschig Anders Ogren Julie Ogren John O’Hair Michele Olivier Daniel Olson Rand Olson Terrilyn Olson Kandice O’Malley Peter O’Mara Darla O’Neill David O’Neill<br />
Jeremy Ormsby Jerry Orndorff Jay Orr Alexander Orr Juan Ortegon Shirley Ortiz Cary Osiek Richard Ott Ray Owsley Cletus Packineau Gregory Palko Debra Palmer John Palmer Ronald Palmer Mike Palmquist Penny Pan<br />
Sirish Panta Mark Papa Alicia Parent Ki Park Christopher Parker Jinay Parker Kevin Parker Ancil Parks Curtis Parsons Larry Partain Tricia Pastrana Amy Patterson Barbara Paul William Pauly Aubrey Pavlis Brenda Payne<br />
Bryan Payne Debrah Payne Oscar Payne Annette Pearsall Philip Pearson Richard Pedder David Pederson Bret Pehacek Sally Pement Paul Pendleton Gary Peng Kevin Penner Irene Pepe Sterling Pereira Eunice Perez<br />
Kim Perez Stacy Perez Sandra Perko Narine Persad Vanessa Pete Donald Peters Oscar Peters Joel Peterson Kyle Peterson Michael Petree Timothy Petta James Pettibone Joel Pettit Angela Pettus Dorothy Pflughaupt<br />
Stephanie Pham Tai Pham Kellie Phea Gary Phillips Georgia Phillips Kenneth Phillips Nestor Phillips Laura Piasecki Allan Pickel Sammy Pickering Chester Pieprzica Scott Pilling Silvestre Pineda Catalin Pintea Waymon Pitchford<br />
Karen Pitman Donald Pitts Gary Pitts Frederick Plaeger Gregory Plesche Brian Policky Fawn Pollizotto Darcy Poncsak Judy Pond Eugene Poole Batina Poorbaugh Christopher Porter Marc Porter Tyrel Porter Heath Posey<br />
Jennifer Potter Steven Potts Phani Potturu Gary Poulain Walker Powe Earnest Powell Allun Powell Virginia Powers Roy Powledge Justin Pratt Steven Pratt Donald Presenkowski Mark Prestridge Debbie Price Susan Price<br />
Christina Prigmore Ralph Proksell Stephen Proksell Janet Pruitt Cynthia Pulliam Peter Pumilia James Pusley Shelley Quiring Jonathan Rabe Shawn Racca Marjorie Rael Shashank Raizada Jay Ramineni Luz Ramirez<br />
Rodolfo Ramirez Ann Ramlochan Andrew Ramsay Melissa Ramsay George Ramsey Navindra Ramsingh Tyeisha Randle Hector Rangel Eric Rasmussen Julie Rasmussen Rance Rasmussen Michael Raymond Marlon Real<br />
David Rebenstorf Jimmy Redfearn Gilberda Reed Preston Reed Cheryl Reese Trent Reese Anna Reeves David Reeves Kathleen Reeves Joe Reitz Russell Reitz Travis Rettig Julia Rey Miquela Reyes Pat Reyes Ruth Reyes<br />
Gregory Reynolds Jarrod Reynolds Katherine Reynolds Daniel Rhodes Fred Rhodes Richard Rhodes Darrell Rice John RiChard Meredith Richardson Mark Richeson Todd Ridgway Janice Riedel Henry Rieniets Clarence Ries<br />
Anthony Rios Kimberly Risner Karen Ritenour Marisa Rivera Asmat Rizvi Roy Roach Wilbur Roane Raymond Roark John Robalin Glen Robbins Robbie Robbins Clifford Roberts Janna Roberts Steven Robertson<br />
Lisa Robichaux-Jones Rita Robicheaux Bettie Robinson Carl Robinson Eric Robinson Lynita Robinson Samuel Robinson Michelle Robles Kaye Rockel Elitha Rocke-Maharaj Jeanne Rodgers John Rodgers Scott Rodgers<br />
Stacia Rodgers Debra Rodieck Benito Rodriguez Martin Rodriguez Nora Rodriguez Victor Rodriguez Dana Roesler Sheila Rogers Marnie Rogers Lorne Rollheiser Linda Romano Larry Romero Enrique Rosas Oscar Rosas<br />
Michael Rosato Gregory Rose Isabelle Rosen Cindi Rosenau George Ross Vicki Ross Arlene Ross Sarah Rotermann Jillian Rouse Bridget Row Stephen Ruiz Douglas Runkel Pamela Rush Michelle Russell<br />
Jeanette Rutherford Rodney Rutherford Deborah Ryan Amy Rybacki Paul Sacco Joseph Sadler Teresa Sadlowski Deanna Saizon David Saldivar Ellen Saldivar Ivan Salick Gina Salinas Linda Samford David Sammons<br />
Timothy Samson Inocente Sanchez Melissa Sandbeck Bobby Sanders Doyle Sanders Danny Sandifer Alan Sanford Elva Santillan Marikay Saranthus Benjamin Sargent Edgar Sarmiento Rodrigo Saucedo Roderick Sauter<br />
Preston Schade James Schaefer Amber Schaller Rick Schatz Wendi Scheier Shayla Schell Shane Schick Gary Schill Darla Schmaltz Jerry Schmaltz Brian Schmidt Jon Schmidt Joel Schmit Maria Schneider Gerald Schneider<br />
Shane Schneider Keith Schnurer Jennifer Schott Helen Schroller Leann Schroller Paul Schuler Alfreda Schulz Charles Schwab Mike Schween Chad Schweitzer Kim Schwoerke Dolores Scotka Andrew Scott Andrew Scott<br />
Timothy Scott Darrel Scroggins Doug Scroggins Jay Scudder Marion Sczykutowicz Curtis Searle Sarah Searle Urban Seay Brian Sehn Mel Sehn Lauren Seidman Lance Sellers Elizabeth Semmes Markie Senn Hector Serna<br />
Bodee Sessions Christopher Settle Diana Sewdass-Dabiedeen Larry Seymour Gregory Shaffer William Shaffer Douglass Sharp Alison Sharratt Matthew Sharrock Donald Shaw Daniel Shea Tameka Shears John Sheehan<br />
Leah Shelby Donald Shelden Delmer Shelton Joel Shelton Sailatha Shenoy Sidney Shepperd Richard Sherley Colleen Sherry Kreg Shewell Ying Shi Dennis Shipp Tracy Shipp Serina Shook Dale Short Michael Shultz Daryl Siebens<br />
Maria Sifuentes Austin Silcox Steven Simmons Charles Simons Douglass Simpson Jennifer Simpson Sheila Singer Shivanand Singh Ria Singh-Date Sallie Singleton Timothy Singley Trent Skelton Leslie Slade Rachel Slate<br />
Robert Slavens Brannon Slusher Jeff Smetanka Cindy Smith David Smith Delmer Smith Emilie Smith Gary Smith Hallie Smith Heather Smith Justine Smith Marvin Smith Matthew Smith Robert Smith Robin Smith Robin Smith<br />
Shawn Smith Stephen Smith Steven Smith Thomas Smith William Smith Heather Smith Gerek Smuin Kyle Smuin Cheryle Snow Randy Snow Janie Snyder Rashina Sohan Katherine Sohns Taylor Sohr Javier Solis Larry Solomon<br />
Martha Solomon Katrina Sonny Danny Southern Billie Sowle Roberto Soza Kirk Sparling Debra Spears Anslem Spears William Speer Jeff Spencer Christine Spencer Melissa Spiller John Spradley Stephanie Spriggins Abiola Spring<br />
Terrie Springman Harrington Square Kristina St. Romain Kristina Stacey Manuel Staffero Jack Staley Korey Stammen Randall Stanger Jason Stanley Patricia Stanley Deborah Stanton Bridgett Staples Michael Stapleton Sherene Starr<br />
Morgan Steele Lisa Steele-Pujadas Patti Steely Walter Stefanik Brenda Stephens Gary Stephens Sheri Stephens Clifford Stephenson Robert Stepp Martha Sterner Carrie Stevens Colleen Stevens Phillip Stevens Maria Stevenson<br />
Eric Stewart Linda Stewart Tambera Stickney Kenneth Stillman Jerry Stinson Duane Stockert Jeffrey Stofa Logan Stokes Terry Stone Denise Story Garth Stotts Rex Stout Cindy Stowell Joshua Stralow Todd Strand Jeffrey Strausser<br />
Billy Strickland Vicky Strom John Studt Melissa Sturm Jason Sugg Suvarna Sule Matthew Sullivan April Summersill Haiting Sun Tommy Sutton Brian Swanson David Swauger Tyrell Swearingen Robert Swetnam Richard Swimm<br />
Sundai Swinney Sharon Sword James Szenasy Valarie Taber Scarlett Tang Brian Tapp Dennis Taylor Edward Taylor Jeane Taylor Jennie Taylor John Taylor Kenneth Taylor Meguire Taylor Ty Taylor Althy Teague Ralph Telford<br />
Brenda Tennant James Terando Corey Terrance Dedrick Terveen Tyson Thacker Cody Thiel Geoffrey Thiessen Eileen Thoede Angela Thomas Gary Thomas Jeremiah Thomas Joseph Thomas Kimberly Thomas Melva Thomas<br />
Rita Thomas William Thomas Alvin Thompson Brett Thompson Brian Thompson Diana Thompson Donna Thompson Duane Thompson James Thompson John Thompson Robert Thompson William Thompson Gloria Thompson<br />
Greg Thornton Christina Thring Randall Thurmond Dewayne Tidwell James Tilley Jimmy Timbre Lane Titus Gina Tobey Tiffany Tocco Brent Tocher Ola Tompkins Vickie Toomes Nora Torres Patrick Tower Keith Trasko Sandy Traughber<br />
Steven Travis David Trice Jonell Trodlier John Troschinetz Joseph Troupe Sandy Truong Steven Tse Linda Tucker Vail Tucker Dan Tuer Jim Turbiville Larry Turbiville Cameron Turnbull Derrick Turner Linda Turner Nicole Turner<br />
Sonja Turner Wesley Turney Lawrence Tuttle Husein Tyebkhan Martin Ueltschey Tull Umphres Dustin Upton Andrea Urciuoli Vance Utri Kimberly Vachal Pamela Vail Lydia Valdez Brian Valencia Steven Valero Cary Van Degna<br />
Rebecca Van Hooser Cynthia Van Ranken Kevin Vanbeselaere Stephen Vance Paul Vargas Michael Vargo Martha Varice Christopher Varisco Steven Vaughn Terry Vaughn Evelyn Vauthier Jennifer Vega Emiliano Vela Angela Velazquez<br />
Lindsey Venedam Stanunathan Venkatachalam George Vieira Maria Vilches Jose Villalobos Jose Villalobos Timothy Vogler Andrew Volk Prody Vong Bruce Voshall Robert Vote George Vouronikas Sandeep Wagle Dallas Wagner<br />
Frederic Wagner Jessica Wagner Jon Wagner Judith Wagner Ladonna Wagner Dennis Wagstaff Roger Wainwright Jessica Waldon Doug Walilko Casey Walk Alicia Walker Donald Walker Gary Walker Jeffery Walker Wanda Walls<br />
Joseph Walthall Deborah Walther Cynthia Walton Kip Walton Martin Wang Xinchuan Wang Allan Wanner Ralph Warby William Wardlaw Jacqueline Warner Freddie Warren Sandra Warren Deryck Warren Andrew Washburn Alan Watkins<br />
Danielle Watson John Watson Karon Watson Gary Wears Heidi Webb Cody Weddle Robert Weeks Kenneth Weiland Tyson Weinberger Chad Weisenburger Sharon Weisser Dustin Welch John Welch Michael Welch Ron Welch Janet Welch<br />
David Welker Betsy Wells Katherine Wells Nathan Wells Robert Welsh Tonya Wemm Steven Wentworth Kari Wenz Timothy Wernicke Joel West Robert West Erica Westphalen Carla Whaley James Whaley George Wheat Roland Whitaker<br />
Leesa White Michael White Stephen White Taryn White Donald Whitmer Richard Whittingham John Whittington Barry Wiederholt Shane Wiest Robbie Wiggins Jeremy Wiig Donald Wilhelm Robert Wilkerson Michael Wilkes Blake Wilkins<br />
Dustin Wilkins Nancy Wilkins Robert Wilkins Sharon Wilkinson Dan Wilkirson Dale Willenbring Ronald Willett Colt Williams Janine Williams Steven Williams Charlie Williams Joey Williams David Williamson Carlie Wilson James Wilson<br />
James Wilson Robert Wilson Walter Wilson Caroline Wilson Frank Wilson Roger Wilson Jeffrey Wilt Adele Wiltshire Nina Wiltz Corey Windham Randal Winfrey Daren Wing William Winkelman Matthew Winnier Sharron Winter<br />
George Witman Kelly Wittmayer Mary Womack Andrew Wong Leonard Wood Barbara Wood Eldon Woodard Robert Woodard David Woods Pat Woods Billy Wooldridge Heath Work Clinton Worman Lloyd Woychuk Junjie Wu<br />
Robert Wylie Theresa Wysocki Hong Xiao Ezra Yacob John Yang Raymond Yang Setra Yappi Amanda Yates Michael Ybarra Barbara Yin Joseph Yohe Chelsey Young Craig Young Kathryn Young Angie Young Dianne Younger Gail Yowell<br />
Eric Yu Jennifer Yu Judy Yu Qian Yu April Zak Andrea Zambo Mark Zan Sarah Zankey Mark Zaun Jeffrey Zawila Victor Zebak Thomas Zeltmann Craig Zempel Nemo Zhang Tommy Zhang Tracy Zhou Tiejun Zhu Daozhou Zhu Aneta Zuczek
1111 Bagby, Sky Lobby 2<br />
Houston, Texas 77002<br />
P.O. Box 4362<br />
Houston, Texas 77210–4362<br />
(713) 651-7000<br />
www.eogresources.com