Download PDF - EOG Resources, Inc.
Download PDF - EOG Resources, Inc.
Download PDF - EOG Resources, Inc.

You also want an ePaper? Increase the reach of your titles
YUMPU automatically turns print PDFs into web optimized ePapers that Google loves.
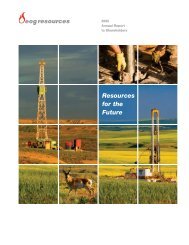
2004<br />
Annual Report to Shareholders<br />
Performance You Can Count On
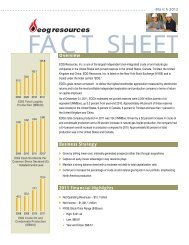
FINANCIAL AND OPERATING HIGHLIGHTS<br />
(In millions, unless otherwise indicated) 2004 2003 2002<br />
Net Operating Revenues. . . . . . . . . . . . . . . . . . . . . . . . . . . . . . . . . . . . . . . . . . . . . $ 2,271 $ 1,745 $ 1,095<br />
<strong>Inc</strong>ome Before Interest Expense and <strong>Inc</strong>ome Taxes . . . . . . . . . . . . . . . . . . . . . . . $ 989 $ 713 $ 179<br />
Net <strong>Inc</strong>ome Available to Common . . . . . . . . . . . . . . . . . . . . . . . . . . . . . . . . . . . . . $ 614 $ 419 $ 76<br />
Total Exploration and Development Expenditures . . . . . . . . . . . . . . . . . . . . . . . . . $ 1,510 $ 1,333 $ 836<br />
Wellhead Statistics<br />
Natural Gas Volumes (MMcfd) . . . . . . . . . . . . . . . . . . . . . . . . . . . . . . . . . . . . . . 1,036 955 924<br />
Natural Gas Price ($/Mcf). . . . . . . . . . . . . . . . . . . . . . . . . . . . . . . . . . . . . . . . . . $ 4.86 $ 4.40 $ 2.60<br />
Crude Oil and Condensate Volumes (MBbld) . . . . . . . . . . . . . . . . . . . . . . . . . . 27.4 23.2 23.3<br />
Crude Oil and Condensate Price ($/Bbl) . . . . . . . . . . . . . . . . . . . . . . . . . . . . . . $ 40.22 $ 29.92 $ 24.56<br />
Natural Gas Liquids Volumes (MBbld) . . . . . . . . . . . . . . . . . . . . . . . . . . . . . . . . 5.6 3.8 3.7<br />
Natural Gas Liquids Price ($/Bbl). . . . . . . . . . . . . . . . . . . . . . . . . . . . . . . . . . . . $ 27.13 $ 21.13 $ 14.05<br />
The Company<br />
<strong>EOG</strong> <strong>Resources</strong>, <strong>Inc</strong>. is one of<br />
the largest independent (nonintegrated)<br />
oil and natural gas<br />
companies in the United States<br />
with substantial proved reserves<br />
in the United States, Canada,<br />
offshore Trinidad and, to a lesser<br />
extent, the United Kingdom North<br />
Sea. <strong>EOG</strong> <strong>Resources</strong>, <strong>Inc</strong>. is<br />
listed on the New York Stock<br />
Exchange and is traded under<br />
the ticker symbol “<strong>EOG</strong>.”<br />
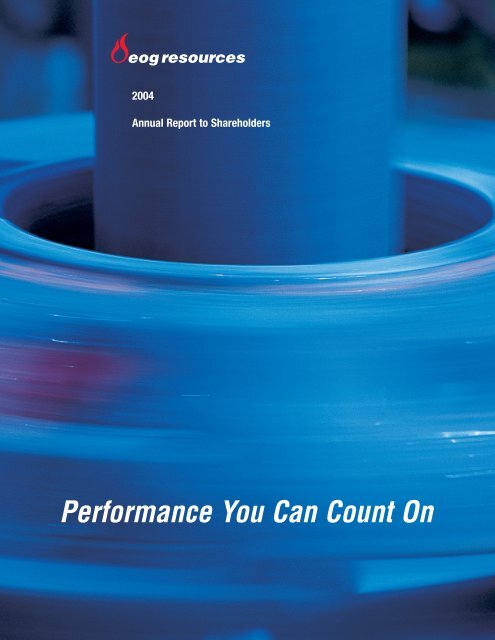
On The Cover<br />
A spinning drillbit reflects <strong>EOG</strong>’s<br />
high level of drilling activity and<br />
its continued focus on organic<br />
growth, a long-term strategy that<br />
positioned the company to<br />
achieve outstanding performance<br />
in 2004.<br />
Highlights<br />
• For 2004, <strong>EOG</strong> reported net income quarter of 2004 and the first quarter of<br />
available to common of $614 million, 2005. These are <strong>EOG</strong>’s first producing<br />
compared to $419 million for 2003. assets in that region.<br />
• At December 31, 2004, total company • In Trinidad, total 2004 production<br />
reserves were approximately 5.6 Tcfe, increased 25 percent, compared to<br />
an increase of 430 Bcfe, or 8 percent 2003. <strong>EOG</strong> began natural gas sales to<br />
higher than 2003. From drilling alone, NGC for the N2000 ammonia plant in<br />
<strong>EOG</strong> added 850 Bcfe of reserves<br />
mid-2004. In February 2005, <strong>EOG</strong><br />
in 2004.<br />
announced a 10-year extension and<br />
amendments to the pricing terms of<br />
• During 2004, total company production<br />
the SECC natural gas sales contract<br />
increased 10.4 percent on a daily<br />
with NGC and signed a contract to<br />
basis, compared to 2003. <strong>EOG</strong> is<br />
supply natural gas to NGC for an<br />
targeting 13.5 percent organic<br />
LNG plant with start-up planned for<br />
production growth in 2005, which<br />
mid-2006.<br />
includes an 11 percent increase in<br />
natural gas production from the United • A two-for-one stock split in the form of<br />
States and Canada.<br />
a stock dividend, announced in<br />
February 2005, was effective March 1,<br />
• At year-end 2004, <strong>EOG</strong> had<br />
2005. In addition, the cash dividend on<br />
approximately 400,000 acres under<br />
the common stock was increased by<br />
lease in the Texas Barnett Shale play<br />
33 percent, following a 20 percent<br />
with net production reaching 30<br />
increase in 2004. Beginning with the<br />
MMcfed during December.<br />
dividend payable on April 29, 2005, the<br />
• In the United Kingdom North Sea,<br />
post-split quarterly cash dividend on<br />
<strong>EOG</strong> commenced production from two the common stock will be $.04 per<br />
Southern Gas Basin wells in the third share, the fifth increase in six years.<br />
Information regarding forward-looking statements is on page 21 of this annual report to<br />
shareholders.<br />
For a glossary of terms see page 56.
L E T T E R T O S H A R E H O L D E R S<br />
Persistence Pays Superior<br />
Shareholder Returns<br />
was another banner year for<br />
2004<strong>EOG</strong> <strong>Resources</strong> with<br />
double-digit production growth and<br />
shareholder returns that well outpaced<br />
most peer companies. Especially<br />
noteworthy is our stock price performance<br />
viewed over the last five years. Clearly,<br />
our long-term strategy is working.<br />
When we became an independent<br />
company in 1999, we announced our<br />
intention to concentrate on the<br />
fundamentals of the exploration and<br />
production business. Our priorities included:<br />
• Focusing on per share results and<br />
working diligently to maintain our<br />
reputation as a rate of return driven<br />
company that creates superior<br />
shareholder value,<br />
• Being financially conservative and<br />
managing our company with high<br />
ethical standards,<br />
• Growing the company through the<br />
drillbit with an aggressive drilling<br />
program concentrating largely on the<br />
development of natural gas, along<br />
with select oil targets,<br />
• Seeking higher return, tactical<br />
acquisition opportunities in areas<br />
where <strong>EOG</strong> is established, rather than<br />
pursuing big-ticket mergers and<br />
acquisitions,<br />
• Ranking repeatedly as a low-cost<br />
industry operator,<br />
• Continuing to explore and exploit our<br />
existing properties located in almost<br />
every major producing basin in the<br />
United States and Canada with a<br />
consistent approach,<br />
• Adding new, big-target domestic<br />
plays to our existing program,<br />
• Developing our offshore Trinidad<br />
properties, while at the same time<br />
seeking another new international<br />
venue that fits our strict selection<br />
criteria,<br />
• Placing our dynamic employees in<br />
close proximity to the plays they<br />
explore and operate, and<br />
• Attracting and retaining top<br />
technical talent, while developing<br />
and honing their skills, as we work<br />
toward being the exploration and<br />
production industry’s ‘employer<br />
of choice.’<br />
Since we articulated this<br />
straightforward, flexible yet deliberate<br />
strategy, we have followed through<br />
with persistence and the result is<br />
strong performance over a chain of<br />
successful years.<br />
Mark G. Papa<br />
Chairman and Chief Executive Officer<br />
Edmund P. Segner, III<br />
President and Chief of Staff<br />
2004 ANNUAL REPORT TO SHAREHOLDERS 1
L E T T E R T O S H A R E H O L D E R S<br />
Enhancing Shareholder Value<br />
In keeping with <strong>EOG</strong>’s ongoing<br />
dedication to enhancing shareholder<br />
returns, the board of directors recently<br />
approved a two-for-one stock split in the<br />
form of a stock dividend effective March<br />
1, 2005. Following a 20 percent increase<br />
in early 2004, the board voted to again<br />
increase the common stock cash dividend<br />
33 percent in 2005 to an indicated annual<br />
rate of $0.16 per post-split share. This<br />
represents the fifth increase in six years.<br />
<strong>EOG</strong> reported record net income<br />
available to common of $614 million for<br />
2004, compared to $419 million for 2003.<br />
For 2004, <strong>EOG</strong>’s return on equity (ROE) (1)<br />
was 25 percent and return on capital<br />
employed (ROCE) (1) was 18 percent. Our<br />
return to shareholders (1) was 55 percent<br />
for the 12-month period.<br />
In addition to our growth in net<br />
income and strong returns, <strong>EOG</strong>’s 2004<br />
cash flow essentially funded our capital<br />
program. We ended the year with a 27<br />
percent debt-to-total capitalization ratio (1) ,<br />
down from 33 percent at year-end 2003.<br />
<strong>EOG</strong> also redeemed $50 million in<br />
preferred stock, further strengthening the<br />
balance sheet.<br />
From an operations perspective, 2004<br />
was a breakout year. Total company<br />
production increased 10.4 percent, as<br />
compared to 2003. We are targeting<br />
outstanding total company production<br />
growth of 13.5 percent in 2005 and 8<br />
percent in 2006.<br />
At year-end 2004, total company net<br />
proved reserves were approximately 5.6<br />
Tcfe, an increase of 430 Bcfe, or 8 percent<br />
higher than 2003. For the 17th<br />
consecutive year, internal reserve<br />
estimates were within 5 percent of<br />
external reserve estimates prepared by<br />
the independent reserve engineering firm,<br />
DeGolyer and MacNaughton, that<br />
evaluated 77 percent of <strong>EOG</strong>’s proved<br />
reserves on a Bcfe basis in 2004.<br />
The impressive performance <strong>EOG</strong><br />
achieved in 2004 was derived from our<br />
strong, established exploration and<br />
production activities. With a preference<br />
for organic growth, <strong>EOG</strong>’s operations<br />
continue to expand and flourish. Once<br />
again, in 2004, <strong>EOG</strong> ranked as one of<br />
the five most active drillers in the<br />
United States.<br />
During 2004, we announced that we<br />
had identified a big target play located in<br />
the Fort Worth Basin of Texas. Potentially<br />
significant in scope, the Barnett Shale<br />
play is expected to generate a very high<br />
reinvestment rate of return, year after<br />
year. We have prospects for a multi-year<br />
drilling inventory for this notable<br />
discovery, which will be additive to our<br />
United States operations.<br />
Establishing a firm foothold in the<br />
United Kingdom North Sea last year,<br />
<strong>EOG</strong> commenced production in the<br />
third quarter with current net production<br />
of approximately 35 MMcfed. In 2005,<br />
we have plans to expand our drilling<br />
efforts there.<br />
In Trinidad, <strong>EOG</strong> commenced natural<br />
gas sales to NGC for the N2000 ammonia<br />
plant in mid-2004. Also, we contracted to<br />
supply natural gas to NGC for both the<br />
M5000 methanol plant, which is<br />
scheduled to come on-line in July, and for<br />
an LNG plant beginning in mid-2006.<br />
With significant opportunities<br />
throughout our operations, <strong>EOG</strong>’s expected<br />
capital budget for 2005 is approximately<br />
$1.6 billion, excluding potential acquisitions,<br />
versus $1.5 billion spent in 2004.<br />
<strong>EOG</strong> YEAR-END RESERVES<br />
(Bcfe)<br />
4,602<br />
4,229<br />
5,216<br />
5,647<br />
01 02 03 04<br />
United Kingdom<br />
Trinidad<br />
United States and<br />
Canada<br />
<strong>EOG</strong> DAILY PRODUCTION<br />
(MMcfed)<br />
1,100 1,117<br />
1,086<br />
1,233<br />
01 02 03 04<br />
2 <strong>EOG</strong> RESOURCES, INC.
The Dynamics of Performance<br />
Barnett Shale Play<br />
While <strong>EOG</strong>’s Texas Barnett Shale play is creating excitement because of<br />
its potential scope and ability to generate high reinvestment rates of<br />
return for years to come, the company’s worldwide operations have a<br />
very extensive drilling inventory.<br />
2004 ANNUAL REPORT TO SHAREHOLDERS 3
The Technology of Performance<br />
Roleta Trend<br />
South Texas explorationists, Andy Scott (seated) and Dan Flores (standing), fuel<br />
4 <strong>EOG</strong> RESOURCES, INC.<br />
<strong>EOG</strong>’s penchant for ‘growth through the drillbit’ by generating exciting new<br />
drilling opportunities. After increasing total company production on a daily basis<br />
by 10.4 percent in 2004, <strong>EOG</strong> is targeting a 13.5 percent increase for 2005.
L E T T E R T O S H A R E H O L D E R S<br />
COMPARATIVE<br />
FIVE-YEAR RETURNS<br />
TO SHAREHOLDERS (1)<br />
(2000 - 2004)<br />
315%<br />
145%<br />
<strong>EOG</strong> Peers* S&P 500<br />
*AMEX Natural Gas Index<br />
-11%<br />
<strong>EOG</strong> NET INCOME<br />
AVAILABLE TO COMMON<br />
(Millions)<br />
$388<br />
$76<br />
$419<br />
$614<br />
01 02 03 04<br />
Exemplary Shareholder Returns<br />
While we are pleased about<br />
our 2004 performance,<br />
<strong>EOG</strong>’s five-year return to<br />
shareholders (1) is truly more meaningful<br />
because it reflects company<br />
performance since we became<br />
independent. Between 2000 and 2004,<br />
<strong>EOG</strong>’s return to shareholders was 315<br />
percent. This compares favorably to a<br />
loss for both the S&P 500 and the Dow<br />
Jones Industrial Average during this<br />
same period. The average return to<br />
shareholders for our peer group during<br />
the period was 145 percent.<br />
Clearly, <strong>EOG</strong>’s out-performance of the<br />
S&P 500 and the Dow Jones Industrial<br />
Average is linked to rising natural gas and<br />
crude oil prices over the five-year period.<br />
However, the company’s outstanding<br />
performance relative to its peer group<br />
cannot be attributed only to rising<br />
hydrocarbon prices because all<br />
exploration and production companies<br />
benefited from higher prices.<br />
It’s our belief that what has set <strong>EOG</strong><br />
apart is the consistent focus on returns,<br />
measured by ROE and ROCE. Over the<br />
five-year period, 2000-2004, <strong>EOG</strong><br />
averaged 23 percent ROE (1) and 15<br />
percent ROCE (1) — significantly higher<br />
than our peer group average. Although<br />
exploration and production companies<br />
typically generate high levels of cash<br />
flow, companies that consistently<br />
reinvest that cash flow at high rates of<br />
return will have higher ROE and ROCE<br />
ratios over time. To reinforce our focus<br />
on achieving high returns throughout our<br />
organization, <strong>EOG</strong>’s bonus plan is<br />
primarily allocated based on<br />
reinvestment rates of return.<br />
North American Natural Gas<br />
Story Unfolds<br />
<strong>EOG</strong> continues to view the North<br />
American natural gas market as tight,<br />
driven by declining domestic supply<br />
and increasing demand to produce<br />
electricity. Initial year decline rates in the<br />
United States have reached 50 percent with<br />
overall decline rates at 30 percent. Just to<br />
keep production flat, every year the United<br />
States natural gas industry must replace 30<br />
percent of the previous year’s total<br />
production. Even at full rig utilization, this<br />
has become extremely difficult. Thus,<br />
domestic production continues to decline.<br />
On the other hand, the demand for<br />
electricity has increased in 27 of the last 30<br />
years. For many years to come, the<br />
increased demand for electricity will be met<br />
by natural gas-fired plants because few<br />
alternate sources — coal, nuclear or<br />
hydroelectric plants — are being<br />
constructed. Renewable energy sources,<br />
such as wind turbines, supply only a very<br />
small portion of the country’s energy needs.<br />
Our Commitment to the World<br />
Around Us<br />
Our employees share the responsibility<br />
for <strong>EOG</strong>’s commitment to excellence<br />
in health, safety and the<br />
environment. We have voluntarily adopted<br />
the member ethics of the Domestic<br />
Petroleum Council devoted to protecting<br />
land, air and water and have an<br />
outstanding operations safety record.<br />
We continually seek ways to enhance<br />
the safety of our operations such as<br />
implementing a program to pinpoint the<br />
exact routes of our underground natural<br />
gas flow lines using global positioning<br />
2004 ANNUAL REPORT TO SHAREHOLDERS 5
L E T T E R T O S H A R E H O L D E R S<br />
satellite technology. Also, <strong>EOG</strong> annually<br />
recognizes noteworthy accomplishments<br />
of our employees with regard to<br />
environmental, health and safety<br />
practices. Last year this included an<br />
Oklahoma City team, which created an<br />
innovative spill-free system on a<br />
waterflood project that is increasing oil<br />
recovery from a mature reservoir.<br />
<strong>EOG</strong> employees regularly provide<br />
leadership on the front lines of the<br />
communities in which they live and work.<br />
For example, for the fifth consecutive year,<br />
Houston employees donated gifts during<br />
the holiday season for children in crisis at<br />
Casa de Esperanza. <strong>EOG</strong> is a corporate<br />
sponsor of the Cactus & Crude MS 150<br />
Bike Tour in Midland, and our employees<br />
are very involved in the March of Dimes<br />
WalkAmerica fundraising event in Corpus<br />
Christi. Across our operations, numerous<br />
other instances demonstrate our<br />
employees’ respect and care for their<br />
neighbors and communities.<br />
Looking Ahead<br />
With the election of W. D. (Bill)<br />
Stevens and H. Leighton<br />
Steward to the <strong>EOG</strong> Board of<br />
Directors last year, <strong>EOG</strong> added two more<br />
experts from the exploration and<br />
production industry to oversee its<br />
activities. Bill Stevens, who has had a<br />
long career in the energy industry, most<br />
recently was president and chief<br />
operating officer of Mitchell Energy and<br />
Development Corporation. Another<br />
industry leader for decades, Leighton<br />
Steward served as vice chairman of<br />
Burlington <strong>Resources</strong> until his retirement.<br />
Based on the strength of <strong>EOG</strong>’s<br />
performance to date, we believe we have<br />
the employees, the assets and the game<br />
plan to steadily post superior shareholder<br />
returns for another five-year period and<br />
beyond. To reach our goal, we’ll continue<br />
to focus on our long-term strategy that<br />
emphasizes financial returns, a strong<br />
balance sheet and organic production<br />
growth with a high reinvestment rate of<br />
return. We will rely on the proven<br />
performance of our operations in the<br />
United States, Canada and Trinidad,<br />
augmented by the new Texas Barnett<br />
Shale and North Sea discoveries, as we<br />
add other new plays to our portfolio. In all<br />
aspects of our business, we will strive for<br />
consistency because that is the<br />
foundation that underlies <strong>EOG</strong>.<br />
Mark G. Papa<br />
Chairman and Chief Executive Officer<br />
Edmund P. Segner, III<br />
President and Chief of Staff<br />
February 24, 2005<br />
(1)<br />
Refer to reconciliation schedule on page 55.<br />
<strong>EOG</strong> TOTAL EXPLORATION<br />
& DEVELOPMENT<br />
EXPENDITURES<br />
(Millions)<br />
$1,163<br />
$836<br />
$1,333<br />
$1,510<br />
01 02 03 04<br />
Trinidad/United Kingdom/<br />
Other International<br />
United States and Canada<br />
<strong>EOG</strong> YEAR-END<br />
DEBT-TO-TOTAL<br />
CAPITALIZATION RATIO (1)<br />
34%<br />
41%<br />
33%<br />
27%<br />
01 02 03 04<br />
6 <strong>EOG</strong> RESOURCES, INC.
The Consistency of Performance<br />
Canada Repeatedly ranking as a low-cost operator, <strong>EOG</strong> places its talented<br />
professionals close to their respective areas of activity and responsibility.<br />
This strategy has proven successful across the company.<br />
7 <strong>EOG</strong> RESOURCES, INC.
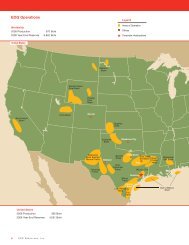
<strong>EOG</strong> OPERATIONS<br />
WORLDWIDE<br />
2004 Production 458 Bcfe<br />
2004 Reserves 5,647 Bcfe<br />
LEGEND<br />
Areas of Operation<br />
Offices<br />
★ Corporate Headquarters<br />
UNITED STATES<br />
Williston<br />
Basin<br />
Powder<br />
River Basin<br />
Greater Green<br />
River Basin<br />
San Joaquin<br />
Basin<br />
Uinta Basin<br />
Denver<br />
Mid-Continent<br />
Oklahoma City<br />
Morrow/<br />
Atoka Trend<br />
Devonian<br />
Trend<br />
Midland<br />
Barnett<br />
Shale<br />
Penn<br />
Carbonate<br />
Trend<br />
Wilcox<br />
Trend<br />
Fort Worth<br />
Tyler<br />
Houston<br />
East Texas<br />
Salt Basin<br />
Wilcox - Frio<br />
Deep<br />
Cotton<br />
Valley<br />
Mississippi<br />
Salt Basin<br />
South Louisiana<br />
Tertiary<br />
Corpus<br />
Christi<br />
Lobo/Roleta<br />
Trend<br />
Frio<br />
Trend<br />
Gulf of Mexico<br />
Shelf<br />
UNITED STATES<br />
2004 Production 294 Bcfe<br />
2004 Reserves 2,837 Bcfe<br />
8 <strong>EOG</strong> RESOURCES, INC.
CANADA<br />
2004 Production 85 Bcfe<br />
2004 Reserves 1,345 Bcfe<br />
CANADA<br />
Central<br />
Mackenzie<br />
Valley<br />
Trenton/<br />
Black River<br />
Enlarged Area Below<br />
Devonian<br />
Pittsburgh<br />
Wapiti<br />
Twining/<br />
Drumheller<br />
Foothills<br />
Calgary<br />
Shallow<br />
Gas Trend<br />
Waskada<br />
TRINIDAD<br />
AND TOBAGO<br />
UNITED KINGDOM<br />
Central<br />
North<br />
Sea<br />
Port of Spain<br />
U(a)<br />
U(b)<br />
Southern<br />
Gas Basin<br />
SECC<br />
London<br />
Lower<br />
Reverse L<br />
TRINIDAD AND TOBAGO<br />
2004 Production 76 Bcfe<br />
2004 Reserves 1,407 Bcfe<br />
UNITED KINGDOM<br />
2004 Production 3 Bcfe<br />
2004 Reserves 58 Bcfe<br />
2004 ANNUAL REPORT TO SHAREHOLDERS 9
FINANCIAL REVIEW<br />
Management’s Discussion and Analysis of Financial Condition<br />
and Results of Operations 11<br />
Management’s Responsibility for Financial Reporting 22<br />
Report of Independent Registered Public Accounting Firm 23<br />
Consolidated Statements of <strong>Inc</strong>ome and Comprehensive <strong>Inc</strong>ome<br />
for the years ended December 31, 2004, 2003 and 2002 24<br />
Consolidated Balance Sheets, December 31, 2004 and 2003 25<br />
Consolidated Statements of Shareholders’ Equity<br />
for the years ended December 31, 2004, 2003 and 2002 26<br />
Consolidated Statements of Cash Flows<br />
for the years ended December 31, 2004, 2003 and 2002 27<br />
Notes to Consolidated Financial Statements 28<br />
Supplemental Information to Consolidated Financial Statements 45<br />
Selected Financial Data 53<br />
Quarterly Stock Data and Related Shareholder Matters 54<br />
10 <strong>EOG</strong> RESOURCES, INC.
MANAGEMENT’S DISCUSSION AND ANALYSIS OF FINANCIAL CONDITION AND RESULTS OF OPERATIONS<br />
OVERVIEW<br />
<strong>EOG</strong> <strong>Resources</strong>, <strong>Inc</strong>. (<strong>EOG</strong>) is one of the largest independent<br />
(non-integrated) oil and natural gas companies in<br />
the United States with substantial proved reserves in the<br />
United States, Canada, offshore Trinidad and, to a lesser<br />
extent, the United Kingdom North Sea. <strong>EOG</strong> operates<br />
under a consistent business and operational strategy<br />
which focuses predominantly on achieving a strong reinvestment<br />
rate of return, drilling internally generated<br />
prospects, delivering long-term production growth and<br />
maintaining a strong balance sheet, with a below average<br />
debt-to-total capitalization ratio.<br />
<strong>EOG</strong> had another year of record operating earnings in<br />
2004. Net income available to common for 2004 of $614<br />
million was up 47% over 2003 earnings of $419 million,<br />
attributable primarily to higher commodity prices and<br />
increased production. At December 31, 2004, <strong>EOG</strong>’s total<br />
reserves were 5.6 Tcfe, an increase of 430 Bcfe, or 8%<br />
higher than 2003.<br />
Operations<br />
Several important developments have occurred since<br />
January 1, 2004.<br />
United States and Canada. During 2004, <strong>EOG</strong> opened<br />
a new office in Fort Worth, Texas to expand its drilling success<br />
in the Barnett Shale play of the Fort Worth Basin.<br />
<strong>EOG</strong> made significant gas discoveries in the non-core portion<br />
of the trend located south and west of the City of Fort<br />
Worth. <strong>EOG</strong> plans to focus on increasing production and<br />
further defining the play’s ultimate size during 2005.<br />
<strong>EOG</strong>’s effort to identify plays with larger reserve potential<br />
has proven a successful supplement to its base development<br />
and exploitation program in the United States and<br />
Canada. <strong>EOG</strong> plans to continue to drill smaller wells in<br />
large acreage plays, which in the aggregate will contribute<br />
substantially to <strong>EOG</strong>’s crude oil and natural gas production.<br />
<strong>EOG</strong> has several larger potential plays under way in<br />
Wyoming, Utah, Texas, Oklahoma and western Canada.<br />
International. In mid-2004, <strong>EOG</strong> began natural gas<br />
sales to NGC under a fifteen-year take-or-pay contract.<br />
This gas is being resold by NGC to an anhydrous ammonia<br />
plant located in Point Lisas, Trinidad. The plant is<br />
owned by N2000. At December 31, 2004, <strong>EOG</strong>’s subsidiary,<br />
<strong>EOG</strong> <strong>Resources</strong> NITRO2000 Ltd., owned an<br />
approximate 23% equity interest in N2000. Under the contract,<br />
<strong>EOG</strong> supplies approximately 60 MMcfd gross of natural<br />
gas to NGC.<br />
Although <strong>EOG</strong> continues to focus on United States<br />
and Canada natural gas, <strong>EOG</strong> sees an increasing linkage<br />
between United States and Canada natural gas demand<br />
and Trinidadian natural gas supply. For example, LNG<br />
imports from existing and planned facilities in Trinidad<br />
are serious contenders to meet increasing United States<br />
demand. In addition, ammonia, methanol and chemical<br />
production has been relocating from the United States<br />
and Canada to Trinidad, driven by attractive natural gas<br />
feedstock prices in the island nation. <strong>EOG</strong> anticipates<br />
that its existing position with the supply contracts to the<br />
two ammonia plants and the new methanol plant, will<br />
continue to give its portfolio an even broader exposure to<br />
United States and Canada natural gas fundamentals.<br />
In 2004, <strong>EOG</strong> continued its progress in the Southern<br />
Gas Basin of the United Kingdom North Sea. A development<br />
well was drilled in the Valkyrie field and commenced<br />
production in August 2004. In addition, the production<br />
facilities were installed in the Arthur field, which was discovered<br />
in 2003, and production commenced in January<br />
2005. <strong>EOG</strong> continues to review additional opportunities in<br />
this area and expects to participate in several exploration<br />
wells in 2005.<br />
Capital Structure<br />
As noted, one of management’s key strategies is to<br />
keep a strong balance sheet with a consistently below<br />
average debt-to-total capitalization ratio. At December 31,<br />
2004, <strong>EOG</strong>’s debt-to-total capitalization ratio was 27%,<br />
down from 33% at year-end 2003. By primarily utilizing<br />
cash provided from its operating activities and proceeds<br />
from stock options exercised in 2004, <strong>EOG</strong> funded its $1.5<br />
billion exploration and development expenditures, paid<br />
down $31 million of debt, redeemed all 500 outstanding<br />
shares of Series D Preferred Stock for $50 million and<br />
increased the dividend paid to common shareholders by<br />
20%. In addition, in 2005, <strong>EOG</strong>’s Board of Directors<br />
increased the quarterly cash dividend on common stock<br />
by 33%. As management currently assesses price forecast<br />
and demand trends for 2005, <strong>EOG</strong> believes that operations<br />
and capital expenditure activity can essentially be<br />
funded by cash from operations.<br />
For 2005, <strong>EOG</strong>’s estimated exploration and development<br />
expenditure budget is approximately $1.6 billion,<br />
excluding acquisitions. United States and Canada natural<br />
gas continues to be a key component of this effort. When<br />
it fits <strong>EOG</strong>’s strategy, <strong>EOG</strong> will make acquisitions that bolster<br />
existing drilling programs or offer <strong>EOG</strong> incremental<br />
exploration and/or production opportunities. Management<br />
continues to believe <strong>EOG</strong> has one of the strongest<br />
prospect inventories in <strong>EOG</strong>’s history.<br />
2004 ANNUAL REPORT TO SHAREHOLDERS 11
RESULTS OF OPERATIONS<br />
The following review of operations for each of the<br />
three years in the period ended December 31, 2004<br />
should be read in conjunction with the consolidated financial<br />
statements of <strong>EOG</strong> and notes thereto.<br />
Net Operating Revenues<br />
During 2004, net operating revenues increased $527<br />
million to $2,271 million. Total wellhead revenues, which<br />
are revenues generated from sales of natural gas, crude<br />
oil, condensate and natural gas liquids from producing<br />
wells, increased 27% to $2,301 million, as compared to<br />
$1,818 million in 2003. Natural Gas Revenues consists of<br />
natural gas wellhead revenues and revenues from marketing<br />
activities associated with the sales and purchases of<br />
natural gas. Revenues from natural gas marketing activities<br />
were $2 million for each of 2004 and 2003. Crude oil,<br />
condensate and natural gas liquids revenues represent<br />
solely wellhead revenues for these products. Wellhead<br />
volume and price statistics for the years ended December<br />
31, were as follows:<br />
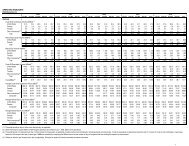
Natural Gas Volumes<br />
(MMcf per day)<br />
2004 2003 2002<br />
United States . . . . . . . . . . . . . . 631 638 635<br />
Canada . . . . . . . . . . . . . . . . . . . 212 165 154<br />
Trinidad. . . . . . . . . . . . . . . . . . . 186 152 135<br />
United Kingdom . . . . . . . . . . . . 7 - -<br />
Total. . . . . . . . . . . . . . . . . . . . 1,036 955 924<br />
Average Natural Gas<br />
Prices ($/Mcf)<br />
United States . . . . . . . . . . . . . . $ 5.72 $ 5.06 $ 2.89<br />
Canada . . . . . . . . . . . . . . . . . . . 5.22 4.66 2.67<br />
Trinidad. . . . . . . . . . . . . . . . . . . 1.51 1.35 1.20<br />
United Kingdom . . . . . . . . . . . . 5.14 - -<br />
Composite . . . . . . . . . . . . . . 4.86 4.40 2.60<br />
Crude Oil and Condensate<br />
Volumes (MBbl per day)<br />
United States . . . . . . . . . . . . . . 21.1 18.5 18.8<br />
Canada . . . . . . . . . . . . . . . . . . . 2.7 2.3 2.1<br />
Trinidad. . . . . . . . . . . . . . . . . . . 3.6 2.4 2.4<br />
Total. . . . . . . . . . . . . . . . . . . . 27.4 23.2 23.3<br />
Average Crude Oil and<br />
Condensate Prices ($/Bbl)<br />
United States . . . . . . . . . . . . . . $ 40.73 $ 30.24 $24.79<br />
Canada . . . . . . . . . . . . . . . . . . . 37.68 28.54 23.62<br />
Trinidad. . . . . . . . . . . . . . . . . . . 39.12 28.88 23.58<br />
Composite . . . . . . . . . . . . . . 40.22 29.92 24.56<br />
Natural Gas Liquids<br />
Volumes (MBbl per day)<br />
United States . . . . . . . . . . . . . . 4.8 3.2 2.9<br />
Canada . . . . . . . . . . . . . . . . . . . 0.8 0.6 0.8<br />
Total. . . . . . . . . . . . . . . . . . . . 5.6 3.8 3.7<br />
2004 2003 2002<br />
Average Natural Gas<br />
Liquids Prices ($/Bbl)<br />
United States . . . . . . . . . . . . . . $ 27.79 $ 21.53 $14.76<br />
Canada . . . . . . . . . . . . . . . . . . . 23.23 19.13 11.17<br />
Composite . . . . . . . . . . . . . . 27.13 21.13 14.05<br />
Natural Gas Equivalent<br />
Volumes (MMcfe per day)<br />
United States . . . . . . . . . . . . . . 786 768 765<br />
Canada . . . . . . . . . . . . . . . . . . . 233 183 171<br />
Trinidad. . . . . . . . . . . . . . . . . . . 207 166 150<br />
United Kingdom . . . . . . . . . . . . 7 - -<br />
Total. . . . . . . . . . . . . . . . . . . . 1,233 1,117 1,086<br />
Total Bcfe Deliveries. . . . . . . . . . 451.5 407.8 396.3<br />
2004 compared to 2003. Wellhead natural gas revenues<br />
for 2004 increased $307 million, or 20%, to $1,842<br />
million from $1,535 million for 2003 due to increases in natural<br />
gas deliveries ($134 million) and the composite average<br />
wellhead natural gas price ($173 million). The composite<br />
average wellhead natural gas price increased 10% to<br />
$4.86 per Mcf for 2004 from $4.40 per Mcf in 2003.<br />
Natural gas deliveries increased 81 MMcf per day, or<br />
8%, to 1,036 MMcf per day for 2004 from 955 MMcf per<br />
day in 2003, due to a 47 MMcf per day, or 28%, increase<br />
in Canada; a 34 MMcf per day, or 22%, increase in<br />
Trinidad; and a 7 MMcf per day increase in the United<br />
Kingdom due to commencement of production in August<br />
2004, partially offset by a 7 MMcf per day, or 1% decline<br />
in the United States. The increased deliveries in Canada<br />
(47 MMcf per day) were attributable to property acquisitions<br />
completed in the fourth quarter of 2003 and additional<br />
production related to post acquisition drilling. The<br />
increase in Trinidad was attributable to the increased production<br />
from the U(a) block (22 MMcf per day), which<br />
began supplying natural gas in mid-2004 to the N2000<br />
ammonia plant and commencement of production from<br />
the Parula wells on the SECC block in February 2004 (12<br />
MMcf per day).<br />
Wellhead crude oil and condensate revenues<br />
increased $149 million, or 59%, to $403 million from $254<br />
million, as compared to 2003, due to increases in both the<br />
composite average wellhead crude oil and condensate<br />
price ($103 million) and the wellhead crude oil and condensate<br />
deliveries ($46 million). The composite average<br />
wellhead crude oil and condensate price for 2004 was<br />
$40.22 per barrel, compared to $29.92 per barrel for 2003.<br />
Wellhead crude oil and condensate deliveries<br />
increased 4.2 MBbl per day, or 18%, to 27.4 MBbl per day<br />
from 23.2 MBbl per day for 2003. The increase was mainly<br />
due to production from new wells in the United States<br />
(2.6 MBbl per day) and higher production in Trinidad from<br />
the Parula wells (0.8 MBbl per day) and from the U(a) block<br />
as a result of new production (0.4 MBbl per day).<br />
12 <strong>EOG</strong> RESOURCES, INC.
Natural gas liquids revenues were $26 million higher<br />
than a year ago primarily due to increases in deliveries ($14<br />
million) and the composite average price ($12 million).<br />
During 2004, <strong>EOG</strong> recognized losses on mark-to-market<br />
commodity derivative contracts of $33 million, which<br />
included realized losses of $82 million and collar premium<br />
payments of $1 million. During 2003, <strong>EOG</strong> recognized<br />
losses on mark-to-market commodity derivative contracts<br />
of $80 million, which included realized losses of $45 million<br />
and collar premium payments of $3 million.<br />
2003 compared to 2002. Wellhead natural gas revenues<br />
for 2003 increased $657 million, or 75%, due to<br />
increases in the composite average wellhead natural gas<br />
price and natural gas deliveries. The composite average<br />
wellhead price for natural gas increased 69% to $4.40 per<br />
Mcf for 2003 from $2.60 per Mcf in 2002.<br />
Natural gas deliveries increased to 955 MMcf per day<br />
for 2003 from 924 MMcf per day for the comparable period<br />
in 2002. The overall increase in natural gas deliveries<br />
was primarily due to an increase in Canada of 7% to 165<br />
MMcf per day and an increase in Trinidad of 13% to 152<br />
MMcf per day in 2003. The 7%, or 11 MMcf per day,<br />
increase in Canada was primarily attributable to a major<br />
property acquisition in the fourth quarter. The 13%, or 17<br />
MMcf per day, increase in Trinidad was attributable to a<br />
full year of sales to the CNCL ammonia plant versus only<br />
six months of sales in 2002.<br />
Natural gas marketing activities increased natural gas<br />
revenues by $2 million and $37 million for 2003 and 2002,<br />
respectively.<br />
Wellhead crude oil and condensate revenues<br />
increased $45 million, or 22%, due to increases in the<br />
composite average wellhead crude oil and condensate<br />
price. The composite average wellhead crude oil and condensate<br />
price for 2003 was $29.92 per barrel, compared<br />
to $24.56 per barrel for 2002.<br />
Natural gas liquids revenues were $11 million higher<br />
than a year ago primarily due to a 50% increase in the<br />
composite average price and a 3% increase in deliveries.<br />
During 2003, <strong>EOG</strong> recognized losses on mark-to-market<br />
commodity derivative contracts of $80 million, which<br />
included realized losses of $45 million and collar premium<br />
payments of $3 million. During 2002, <strong>EOG</strong> recognized<br />
losses on mark-to-market commodity derivative contracts<br />
of $49 million, which included realized losses of $21 million<br />
and a $2 million collar premium payment.<br />
Operating and Other Expenses<br />
2004 compared to 2003. During 2004, operating<br />
expenses of $1,292 million were $245 million higher than<br />
the $1,047 million incurred in 2003. The following table<br />
presents the costs per Mcfe for the years ended<br />
December 31:<br />
2004 2003<br />
Lease and Well,<br />
including Transportation . . . . . . . . . $ 0.60 $ 0.52<br />
DD&A. . . . . . . . . . . . . . . . . . . . . . . . . 1.12 1.08<br />
G&A. . . . . . . . . . . . . . . . . . . . . . . . . . 0.25 0.25<br />
Taxes Other than <strong>Inc</strong>ome . . . . . . . . . 0.30 0.21<br />
Interest Expense, Net . . . . . . . . . . . . 0.14 0.14<br />
Total Per-Unit Costs . . . . . . . . . . $ 2.41 $ 2.20<br />
The higher per-unit rates of lease and well, DD&A and<br />
taxes other than income for 2004 compared to 2003 were<br />
due primarily to the reasons set forth below.<br />
Lease and well expenses of $271 million were $58<br />
million higher than 2003 due primarily to a general<br />
increase in service costs related to increased operating<br />
activities, including an increase in the number of wells, in<br />
the United States ($18 million), Canada ($16 million), and<br />
Trinidad ($1 million); increased transportation related costs<br />
in the United States ($14 million), Canada ($2 million) and<br />
the United Kingdom ($2 million); and changes in the<br />
Canadian exchange rate ($5 million).<br />
Depreciation, depletion and amortization (DD&A)<br />
expenses of $504 million increased $63 million from 2003<br />
due primarily to increased production in Canada ($18 million),<br />
the United States ($10 million), and Trinidad ($4 million);<br />
the commencement of production in the United<br />
Kingdom ($2 million); increased DD&A rates in the United<br />
States due to a gradual proportional increase in production<br />
from higher cost properties ($13 million); increased<br />
DD&A rates in Canada mainly from developing acquired<br />
proved reserves ($8 million); and changes in the Canadian<br />
exchange rate ($7 million).<br />
General and administrative (G&A) expenses of $115<br />
million were $15 million higher than 2003 due primarily to<br />
expanded operations.<br />
Taxes other than income of $134 million were $48 million<br />
higher than 2003 due primarily to a decrease in credits<br />
taken against severance taxes resulting from the qualification<br />
of additional wells for a Texas high cost gas severance<br />
tax exemption ($19 million); an increase as a result<br />
of higher wellhead revenues in the United States ($13 million),<br />
Trinidad ($2 million) and Canada ($1 million); higher<br />
property taxes as a result of higher property valuation in<br />
the United States ($6 million); the results of a production<br />
tax audit lawsuit in the first quarter of 2004 ($5 million);<br />
and an increase in the number of wells and facilities in<br />
Canada ($2 million).<br />
2004 ANNUAL REPORT TO SHAREHOLDERS 13
Exploration costs of $94 million were $18 million higher<br />
than 2003 due primarily to increased geological and<br />
geophysical expenditures in the United States ($6 million),<br />
Canada ($3 million), the United Kingdom ($3 million) and<br />
Trinidad ($1 million); and increased exploration administrative<br />
expenses across <strong>EOG</strong> ($4 million).<br />
Impairments of $82 million were $8 million lower than<br />
2003 due primarily to lower amortization of unproved<br />
leases in the United States ($10 million), partially offset by<br />
higher amortization of unproved leases in Canada ($2 million).<br />
Total impairments under Statement of Financial<br />
Accounting Standards (SFAS) No. 144 - “Accounting for<br />
the Impairment or Disposal of Long-Lived Assets” were<br />
$25 million in each of 2004 and 2003.<br />
Net interest expense of $63 million was $4 million<br />
higher than 2003 due primarily to a slightly higher average<br />
debt balance.<br />
Other <strong>Inc</strong>ome (Expense), Net for 2004 included<br />
income from equity investments of $11 million, gains on<br />
sales of reserves and related assets of $6 million and foreign<br />
currency transaction losses of $7 million as a result of<br />
applying the changes in the Canadian exchange rate to<br />
certain intercompany short-term loans that eliminate in<br />
consolidation.<br />
<strong>Inc</strong>ome tax provision increased $85 million to $301<br />
million compared to 2003, primarily resulting from higher<br />
income before income taxes ($95 million) and an increase<br />
in state income taxes ($2 million), offset by lower deferred<br />
income taxes associated with the Alberta, Canada corporate<br />
tax rate ($5 million) and lower effective foreign income<br />
tax rates ($2 million). As a result of these changes, the net<br />
effective tax rate for 2004 remained unchanged from the<br />
2003 rate of 33%.<br />
In November 2003, Canada enacted legislation reducing<br />
the Canadian federal income tax rate for companies in<br />
the resource sector from 28% to 27% for 2003, with further<br />
reductions to 21% phased in over the next four years.<br />
This legislation also made changes to the tax treatment of<br />
crown royalties and the resource allowance. Beginning in<br />
2003, Canadian taxpayers are allowed to deduct 10% of<br />
actual provincial and other crown royalties. This percentage<br />
increases each year through 2007, at which time<br />
100% of crown royalties will be deductible. The resource<br />
allowance, a statutory deduction calculated as 25% of<br />
adjusted resource profits, will be phased out through<br />
2007, when the deduction will be completely eliminated.<br />
2003 compared to 2002. During 2003, operating<br />
expenses of $1,047 million were $133 million higher than<br />
the $914 million incurred in 2002. The following table presents<br />
the costs per Mcfe for the years ended December 31:<br />
2003 2002<br />
Lease and Well,<br />
including Transportation . . . . . . . . . $ 0.52 $ 0.45<br />
DD&A . . . . . . . . . . . . . . . . . . . . . . . . . 1.08 1.00<br />
G&A . . . . . . . . . . . . . . . . . . . . . . . . . . 0.25 0.22<br />
Taxes Other than <strong>Inc</strong>ome . . . . . . . . . 0.21 0.18<br />
Interest Expense, Net . . . . . . . . . . . . 0.14 0.15<br />
Total Per-Unit Costs . . . . . . . . . . $2.20 $ 2.00<br />
The higher per-unit rates of lease and well, DD&A,<br />
G&A and taxes other than income for 2003, compared to<br />
2002 were due primarily to the reasons set forth below.<br />
Lease and well expenses of $213 million were $33<br />
million higher than 2002 due primarily to a general<br />
increase in service costs related to increased operating<br />
activities, including an increase in the number of wells, in<br />
the United States ($15 million) and Canada ($4 million);<br />
increased lease and well administrative expenses in the<br />
United States ($7 million); and changes in the Canadian<br />
exchange rate ($6 million).<br />
DD&A expenses of $442 million increased $44 million<br />
from the prior year due primarily to more relative production<br />
from higher cost properties in the United States ($20<br />
million) and Canada ($5 million); increased production in<br />
Canada ($3 million) and Trinidad ($2 million); and changes<br />
in the Canadian exchange rate ($8 million). Also, included<br />
in DD&A expenses for 2003 was $5 million of accretion<br />
expense related to SFAS No. 143 - “Accounting for Asset<br />
Retirement Obligations.”<br />
G&A expenses of $100 million were $11 million higher<br />
than the period a year ago due primarily to expanded operations<br />
($9 million) and increased insurance expense ($5 million),<br />
partially offset by decreased legal costs ($3 million).<br />
Taxes other than income of $86 million were $14 million<br />
higher than the prior year period primarily due to an<br />
increase of approximately $35 million as a result of<br />
increased wellhead revenues as previously discussed,<br />
partially offset by $24 million of severance tax credits from<br />
the qualification of wells for a Texas high cost gas severance<br />
tax exemption.<br />
Exploration costs of $76 million were $16 million higher<br />
than a year ago due primarily to an increase in techni-<br />
14 <strong>EOG</strong> RESOURCES, INC.
cal staff costs across <strong>EOG</strong> ($7 million) and increased geological<br />
and geophysical expenditures in the United States<br />
($5 million) and Trinidad ($3 million).<br />
Impairments increased $21 million to $89 million compared<br />
to a year ago due to higher amortization of<br />
unproved leases in the United States ($25 million). Total<br />
impairments under SFAS No. 144 - “Accounting for the<br />
Impairment or Disposal of Long-Lived Assets” for 2003<br />
and 2002 were $25 million and $30 million, respectively.<br />
Other <strong>Inc</strong>ome (Expense), Net for 2003 included foreign<br />
currency transaction gains of $9 million as a result<br />
of applying the changes in the Canadian exchange rate<br />
to certain intercompany short-term loans that eliminate<br />
in consolidation and income from equity investments of<br />
$4 million.<br />
<strong>Inc</strong>ome tax provision increased $184 million to $217<br />
million for 2003 as compared to 2002 primarily resulting<br />
from higher income before income taxes for federal ($187<br />
million) and state ($4 million), expiration of the tight gas<br />
sands federal income tax credit as of December 31, 2002<br />
($4 million), and higher effective foreign income tax rates<br />
($4 million), primarily offset by net tax benefit associated<br />
with the Canadian tax law change ($14 million).<br />
CAPITAL RESOURCES AND LIQUIDITY<br />
Cash Flow<br />
The primary sources of cash for <strong>EOG</strong> during the threeyear<br />
period ended December 31, 2004 included funds<br />
generated from operations, funds from new borrowings<br />
and proceeds from sales of treasury stock attributable to<br />
employee stock option exercises and the employee stock<br />
purchase plan. Primary cash outflows included funds used<br />
in operations, exploration and development expenditures,<br />
oil and gas property acquisitions, repayment of debt,<br />
redemption of preferred stock, common stock repurchases<br />
and dividends.<br />
2004 compared to 2003. Net operating cash inflows of<br />
$1,444 million in 2004 increased $195 million, as compared<br />
to 2003 primarily reflecting an increase in wellhead<br />
revenues of $482 million, partially offset by an increase in<br />
cash operating expenses of $139 million, an increase in<br />
current tax expense of $72 million, unfavorable changes in<br />
working capital and other liabilities of $48 million and an<br />
increase in realized losses from mark-to-market commodity<br />
derivative contracts of $38 million.<br />
Net investing cash outflows of $1,397 million in 2004<br />
increased by $189 million, as compared to 2003 due primarily<br />
to increased additions to oil and gas properties of $171<br />
million and unfavorable changes in working capital related<br />
to investing activities of $12 million. Changes in<br />
Components of Working Capital Associated with Investing<br />
Activities included changes in accounts payable associated<br />
with the accrual of exploration and development expenditures<br />
and changes in inventories which represent material<br />
and equipment used in drilling and related activities.<br />
Cash used by financing activities was $43 million in<br />
2004 versus $57 million in 2003. Cash provided by financing<br />
activities for 2004 included long-term debt borrowing<br />
of $150 million and proceeds from sales of treasury stock<br />
attributable to employee stock option exercises and the<br />
employee stock purchase plan of $76 million. Cash used<br />
by financing activities for 2004 included repayments of<br />
long-term debt borrowings of $175 million, redemption of<br />
all 500 outstanding shares of Series D Preferred Stock of<br />
$50 million and cash dividend payments of $38 million.<br />
2003 compared to 2002. Net operating cash inflows of<br />
$1,249 million in 2003 increased $638 million, as compared<br />
to 2002 primarily reflecting an increase wellhead commodity<br />
revenues of $713 million and favorable changes in working<br />
capital and other liabilities of $117 million, partially offset<br />
by an increase in cash operating expenses of $75 million,<br />
an increase in current tax expense of $75 million and<br />
an increase in realized losses from mark-to-market commodity<br />
derivative contracts of $24 million.<br />
Net investing cash outflows of $1,207 million in 2003<br />
increased by $391 million as compared to 2002 due primarily<br />
to increased additions to oil and gas properties of<br />
$485 million, which includes $366 million related to two<br />
Canadian asset purchases, partially offset by favorable<br />
changes in working capital related to investing activities of<br />
$82 million. Changes in Components of Working Capital<br />
Associated with Investing Activities included changes in<br />
accounts payable associated with the accrual of exploration<br />
and development expenditures and changes in<br />
inventories which represent material and equipment used<br />
in drilling and related activities.<br />
Cash used by financing activities was $57 million in<br />
2003 versus cash provided of $211 million in 2002.<br />
Financing activities for 2003 included repayment of the<br />
outstanding balances of commercial paper borrowings<br />
and the uncommitted line of credit of $22 million and $14<br />
million, respectively, repurchases of <strong>EOG</strong>’s common stock<br />
of $21 million, cash dividend payments of $31 million and<br />
proceeds of $35 million from sales of treasury stock attributable<br />
to employee stock option exercises and the<br />
employee stock purchase plan.<br />
2004 ANNUAL REPORT TO SHAREHOLDERS 15
Exploration and Development Expenditures<br />
The table below sets out components of exploration and development expenditures for the years ended December<br />
31, 2004, 2003 and 2002, along with the total budgeted for 2005, excluding acquisitions (in millions):<br />
Actual Budgeted 2005<br />
Expenditure Category 2004 2003 2002 (excluding acquisitions)<br />
Capital<br />
Drilling and Facilities . . . . . . . . . . . . . . . . . . . . . . . . . . . . . . . . . . . . . $ 1,120 $ 731 $ 595<br />
Leasehold Acquisitions . . . . . . . . . . . . . . . . . . . . . . . . . . . . . . . . . . . 143 59 39<br />
Producing Property Acquisitions . . . . . . . . . . . . . . . . . . . . . . . . . . . 52 405 71<br />
Capitalized Interest . . . . . . . . . . . . . . . . . . . . . . . . . . . . . . . . . . . . . 10 9 9<br />
Subtotal . . . . . . . . . . . . . . . . . . . . . . . . . . . . . . . . . . . . . . . . . . . . 1,325 1,204 714<br />
Exploration Costs . . . . . . . . . . . . . . . . . . . . . . . . . . . . . . . . . . . . . . . . . . 94 76 60<br />
Dry Hole Costs . . . . . . . . . . . . . . . . . . . . . . . . . . . . . . . . . . . . . . . . . . . . 92 41 47<br />
Exploration and Development Expenditures. . . . . . . . . . . . . . . . 1,511 1,321 821 Approximately $1,600<br />
Asset Retirement Costs (1) . . . . . . . . . . . . . . . . . . . . . . . . . . . . . . . . . . . . 16 12 -<br />
Deferred <strong>Inc</strong>ome Tax on Acquired Properties . . . . . . . . . . . . . . . . . . . . (17) - 15<br />
Total (2) . . . . . . . . . . . . . . . . . . . . . . . . . . . . . . . . . . . . . . . . . . . . . $ 1,510 $1,333 $ 836<br />
(1) The Asset Retirement Costs are netted with $1 million net gains recognized upon settlement of asset retirement obligations for each of 2004 and 2003.<br />
Asset Retirement Costs for 2003 does not include the cumulative effect of adoption of SFAS No. 143 - “Accounting for Asset Retirement Obligations” on<br />
January 1, 2003.<br />
(2) Pro forma total expenditures for 2002 are not presented since the pro forma application of SFAS No. 143 to the prior periods would not result in pro forma<br />
total expenditures materially different from the actual amounts reported.<br />
Exploration and development expenditures of $1.5<br />
billion for 2004 were $190 million higher than the prior year<br />
due primarily to increased drilling expenditures ($439 million)<br />
resulting from higher exploration and development<br />
activities in Canada and Trinidad and higher cost structures<br />
in the United States and Canada; increased lease<br />
acquisitions in the United States ($84 million), primarily in<br />
the non-core Barnett Shale area and, to a lesser extent, in<br />
South Texas; and changes in the Canadian exchange rate<br />
($20 million); partially offset by decreased property acquisitions<br />
($353 million). The higher cost structure was primarily<br />
due to increases in materials and services across the<br />
industry. The 2004 exploration and development expenditures<br />
of $1.5 billion includes $1,009 million in development,<br />
$440 million in exploration, $52 million in property<br />
acquisitions and $10 million in capitalized interest. The<br />
2003 exploration and development expenditures of $1,321<br />
million included $651 million in development, $256 million<br />
in exploration, $405 million in property acquisitions and $9<br />
million in capitalized interest.<br />
The level of exploration and development expenditures,<br />
including acquisitions, will vary in future periods<br />
depending on energy market conditions and other related<br />
economic factors. <strong>EOG</strong> has significant flexibility with<br />
respect to financing alternatives and the ability to adjust<br />
its exploration and development expenditure budget as<br />
circumstances warrant. There are no material continuing<br />
commitments associated with current expenditure plans.<br />
Derivative Transactions<br />
During 2004, <strong>EOG</strong> recognized losses on mark-to-market<br />
commodity derivative contracts of $33 million, which<br />
included realized losses of $82 million and collar premium<br />
payments of $1 million. During 2003, <strong>EOG</strong> recognized<br />
losses on mark-to-market commodity derivative contracts<br />
of $80 million, which included realized losses of $45 million<br />
and collar premium payments of $3 million. (See Note<br />
11 to the Consolidated Financial Statements.)<br />
16 <strong>EOG</strong> RESOURCES, INC.
Presented below is a summary of <strong>EOG</strong>’s 2005 natural gas financial collar contracts at February 25, 2005. As indicated,<br />
<strong>EOG</strong> does not have any financial collar or swap contracts that cover periods beyond March 2005. Moreover, <strong>EOG</strong> has<br />
not entered into any additional natural gas financial collar contracts or natural gas or crude oil financial price swap contracts<br />
since December 31, 2004. <strong>EOG</strong> accounts for these collar and swap contracts using mark-to-market accounting.<br />
Natural Gas Financial Collar Contracts<br />
Floor Price<br />
Ceiling Price<br />
Floor Weighted Ceiling Weighted Settlement<br />
Volume Range Average Range Average Price<br />
2005 (MMBtud) ($/MMBtu) ($/MMBtu) ($/MMBtu) ($/MMBtu) ($/MMBtu)<br />
Jan (1) 75,000 $7.65 - 8.00 $7.77 $8.90 - 9.50 $9.10 $6.35<br />
Feb (2) 75,000 7.65 - 8.00 7.77 9.19 - 9.50 9.32 6.36<br />
Mar (2) 75,000 7.65 - 8.00 7.77 9.19 - 9.50 9.32 6.24<br />
(1) Notional volumes of 25,000 MMBtud of the January 2005 collar contracts were purchased at a premium of $0.10 per MMBtu.<br />
(2) The collar contracts for February 2005 and March 2005 were purchased at a premium of $0.10 per MMBtu.<br />
Financing<br />
<strong>EOG</strong>’s long-term debt-to-total capitalization ratio was<br />
27% as of December 31, 2004, compared to 33% as of<br />
December 31, 2003.<br />
During 2004, total long-term debt decreased $31 million<br />
to $1,078 million (see Note 2 to the Consolidated<br />
Financial Statements). The estimated fair value of <strong>EOG</strong>’s<br />
long-term debt at December 31, 2004 and 2003 was<br />
$1,146 million and $1,175 million, respectively, based upon<br />
quoted market prices and, where such prices were not<br />
available, upon interest rates currently available to <strong>EOG</strong> at<br />
year-end. <strong>EOG</strong>’s debt is primarily at fixed interest rates. At<br />
December 31, 2004, a 1% decline in interest rates would<br />
result in a $59 million increase in the estimated fair value of<br />
the fixed rate obligations (see Note 11 to the Consolidated<br />
Financial Statements).<br />
During 2004, <strong>EOG</strong> utilized commercial paper, and<br />
during 2003, <strong>EOG</strong> utilized commercial paper and committed<br />
bank loans, in addition to operating cash flows, to<br />
fund its operations. These loans are more fully described<br />
in Note 2 to the Consolidated Financial Statements. While<br />
<strong>EOG</strong> maintains a $600 million commercial paper program,<br />
the maximum outstanding at any time during 2004 was<br />
$321 million, and the amount outstanding at year-end<br />
was $92 million. <strong>EOG</strong> considers this excess availability,<br />
which is contractually backed by the $600 million<br />
Revolving Credit Agreement with domestic and foreign<br />
lenders described in Note 2, combined with the $688 million<br />
of availability under its shelf registration described<br />
below, to be ample to meet its ongoing operating needs.<br />
Based on resources available at December 31, 2004,<br />
during 2005, <strong>EOG</strong> plans to replace the Senior Unsecured<br />
Term Loan Facility due 2005 with long-term debt. In 2004,<br />
the short-term commercial paper loan balance was<br />
reduced ($6 million) and the $100 million, 6.50% Notes<br />
were paid off by long-term debt refinancing.<br />
Contractual Obligations<br />
The following table summarizes <strong>EOG</strong>’s contractual obligations at December 31, 2004 (in thousands):<br />
2011 &<br />
Contractual Obligations (1) Total 2005 2006 - 2008 2009 - 2010 Beyond<br />
Long-Term Debt (2) . . . . . . . . . . . . . . . . . . . . . . . . . . . . . . . . $ 1,077,622 $ 166,800 $ 400,822 $ - $ 510,000<br />
Non-cancelable Operating Leases . . . . . . . . . . . . . . . . . . 45,784 13,497 20,934 5,594 5,759<br />
Drilling Rig Commitments . . . . . . . . . . . . . . . . . . . . . . . . . 2,214 1,142 1,072 - -<br />
Pipeline Transportation Service<br />
Commitments (3) . . . . . . . . . . . . . . . . . . . . . . . . . . . . . . . . 128,983 21,697 49,518 19,139 38,629<br />
Seismic Purchase Obligations . . . . . . . . . . . . . . . . . . . . . . 7,904 7,904 - - -<br />
Other Purchase Obligations. . . . . . . . . . . . . . . . . . . . . . . . 2,918 1,628 1,290 - -<br />
Total Contractual Obligations. . . . . . . . . . . . . . . . . . . $ 1,265,425 $ 212,668 $ 473,636 $ 24,733 $ 554,388<br />
(1) This table does not include the liability for dismantlement, abandonment and restoration costs of oil and gas properties. Effective with adoption of SFAS<br />
No. 143, “Accounting for Asset Retirement Obligations” on January 1, 2003, <strong>EOG</strong> recorded a separate liability for the fair value of this asset retirement obligation.<br />
See Note 13 to the Consolidated Financial Statements. In addition, this table does not include <strong>EOG</strong>’s pension or postretirement benefit obligations.<br />
See Note 6 to the Consolidated Financial Statements.<br />
(2) Commercial paper and the Senior Unsecured Term Loan Facility due 2005 are classified as long-term debt on the Consolidated Balance Sheets based on<br />
<strong>EOG</strong>’s intent and ability to ultimately replace such amounts with other long-term debt. See Note 2 to the Consolidated Financial Statements.<br />
(3) Amounts shown are based on current pipeline transportation rates and the Canadian foreign currency exchange rate at December 31, 2004. Management<br />
does not believe that any future changes in these rates before the expiration dates of these commitments will have a material adverse effect on the financial<br />
condition or results of operations of <strong>EOG</strong>.<br />
2004 ANNUAL REPORT TO SHAREHOLDERS 17
Shelf Registration<br />
As of February 25, 2005, the amount available under<br />
various filed registration statements with the Securities<br />
and Exchange Commission for the offer and sale from time<br />
to time of <strong>EOG</strong> debt securities, preferred stock and/or<br />
common stock totaled $688 million.<br />
Off-Balance Sheet Arrangements<br />
<strong>EOG</strong> does not participate in financial transactions that<br />
generate relationships with unconsolidated entities or<br />
financial partnerships. Such entities, often referred to as<br />
variable interest entities (VIE) or special purpose entities<br />
(SPE), are generally established for the purpose of facilitating<br />
off-balance sheet arrangements or other contractually<br />
narrow or limited purposes. <strong>EOG</strong> was not involved in<br />
any unconsolidated VIE or SPE financial transactions during<br />
any of the reporting periods in this document and has<br />
no intention to participate in such transactions in the foreseeable<br />
future.<br />
Foreign Currency Exchange Rate Risk<br />
During 2004, <strong>EOG</strong> was exposed to foreign currency<br />
exchange rate risk inherent in its operations in foreign<br />
countries, including Canada, Trinidad and the United<br />
Kingdom. The foreign currency most significant to <strong>EOG</strong>’s<br />
operations during 2004 was the Canadian Dollar. While the<br />
continued strengthening of the Canadian Dollar in 2004<br />
impacted both the revenues and expenses recorded on<br />
the income statements of <strong>EOG</strong>’s Canadian subsidiaries,<br />
its impacts on the items were not to the same extent.<br />
Since the Canadian natural gas prices are largely correlated<br />
to United States prices, the changes in the Canadian<br />
currency exchange rate have less of an impact on the<br />
Canadian revenues than the Canadian expenses. <strong>EOG</strong><br />
continues to monitor the foreign currency exchange rates<br />
of countries in which it is currently conducting business<br />
and may implement measures to protect against the foreign<br />
currency exchange rate risk.<br />
Effective March 9, 2004, <strong>EOG</strong> entered into a foreign<br />
currency swap transaction with multiple banks to eliminate<br />
any exchange rate impacts that may result from the notes<br />
offered by one of the Canadian subsidiaries on the same<br />
date (see Note 2 to the Consolidated Financial<br />
Statements). <strong>EOG</strong> accounts for the foreign currency swap<br />
transaction using the hedge accounting method, pursuant<br />
to the provisions of SFAS No. 133 - “Accounting for<br />
Derivative Instruments and Hedging Activities,” as amended<br />
by SFAS Nos. 137, 138 and 149. Under those provisions,<br />
as of December 31, 2004, <strong>EOG</strong> recorded the fair<br />
value of the swap of $23.1 million in Other Liabilities in the<br />
Liabilities section of the Consolidated Balance Sheets.<br />
Changes in the fair value of the foreign currency swap<br />
resulted in no net impact to the Consolidated Statements<br />
of <strong>Inc</strong>ome. The after-tax net impact from the foreign currency<br />
swap transaction resulted in a negative change of<br />
$3.8 million for the year ended December 31, 2004. This<br />
amount is included in Accumulated Other Comprehensive<br />
<strong>Inc</strong>ome in the Shareholders’ Equity section of the<br />
Consolidated Balance Sheets.<br />
Outlook<br />
Natural gas prices historically have been volatile, and<br />
this volatility is expected to continue. Uncertainty continues<br />
to exist as to the direction of future United States and<br />
Canada natural gas and crude oil price trends, and there<br />
remains a rather wide divergence in the opinions held by<br />
some in the industry. In <strong>EOG</strong>’s opinion, overall natural gas<br />
production in the United States is declining. In addition,<br />
the increasing recognition of natural gas as a more environmentally<br />
friendly source of energy is likely to result in<br />
increases in demand. Being primarily a natural gas producer,<br />
<strong>EOG</strong> is more significantly impacted by changes in<br />
natural gas prices than by changes in crude oil and condensate<br />
prices. Longer term natural gas prices will be<br />
determined by the supply and demand for natural gas as<br />
well as the prices of competing fuels, such as oil and coal.<br />
Assuming a totally unhedged position for 2005, based<br />
on <strong>EOG</strong>’s tax position and the portion of <strong>EOG</strong>’s anticipated<br />
natural gas volumes for 2005 for which prices have not been<br />
determined under long-term marketing contracts, <strong>EOG</strong>’s<br />
price sensitivity for each $0.10 per Mcf change in average<br />
wellhead natural gas price is approximately $21 million for<br />
net income and operating cash flow. <strong>EOG</strong> is not impacted as<br />
significantly by changing crude oil price. <strong>EOG</strong>’s price sensitivity<br />
for each $1.00 per barrel change in average wellhead<br />
crude oil prices is approximately $6.5 million for net income<br />
and operating cash flow. For information regarding <strong>EOG</strong>’s<br />
natural gas hedge position as of December 31, 2004, see<br />
Note 11 to the Consolidated Financial Statements.<br />
Marketing companies have played an important role<br />
in the United States and Canada natural gas market.<br />
These companies aggregate natural gas supplies through<br />
purchases from producers like <strong>EOG</strong> and then resell the<br />
gas to end users, local distribution companies or other<br />
buyers. In recent years, several of the largest natural gas<br />
marketing companies have filed for bankruptcy or are having<br />
financial difficulty, and others are exiting this business.<br />
<strong>EOG</strong> does not believe that this will have a material effect<br />
on its ability to market its natural gas production. <strong>EOG</strong><br />
continues to assess and monitor the credit worthiness of<br />
partners to whom it sells its production and where appropriate,<br />
to seek new markets.<br />
18 <strong>EOG</strong> RESOURCES, INC.
<strong>EOG</strong> plans to continue to focus a substantial portion<br />
of its exploration and development expenditures in its<br />
major producing areas in the United States and Canada.<br />
However, in order to diversify its overall asset portfolio<br />
and as a result of its overall success realized in Trinidad<br />
and the United Kingdom North Sea, <strong>EOG</strong> anticipates<br />
expending a portion of its available funds in the further<br />
development of opportunities outside the United States<br />
and Canada. In addition, <strong>EOG</strong> expects to conduct<br />
exploratory activity in other areas outside of the United<br />
States and Canada and will continue to evaluate the<br />
potential for involvement in other exploitation type opportunities.<br />
Budgeted 2005 exploration and development<br />
expenditures, excluding acquisitions, are approximately<br />
$1.6 billion and are structured to maintain the flexibility<br />
necessary under <strong>EOG</strong>’s strategy of funding the United<br />
States and Canada exploration, exploitation, development<br />
and acquisition activities primarily from available<br />
internally generated cash flow.<br />
The level of exploration and development expenditures<br />
may vary in 2005 and will vary in future periods<br />
depending on energy market conditions and other related<br />
economic factors. Based upon existing economic and<br />
market conditions, <strong>EOG</strong> believes net operating cash flow<br />
and available financing alternatives in 2005 will be sufficient<br />
to fund its net investing cash requirements for the<br />
year. However, <strong>EOG</strong> has significant flexibility with respect<br />
to its financing alternatives and adjustment of its exploration,<br />
exploitation, development and acquisition expenditure<br />
plans if circumstances warrant. While <strong>EOG</strong> has certain<br />
continuing commitments associated with expenditure<br />
plans related to operations in the United States, Canada,<br />
Trinidad and the United Kingdom, such commitments are<br />
not expected to be material when considered in relation to<br />
the total financial capacity of <strong>EOG</strong>.<br />
Environmental Regulations<br />
Various federal, state and local laws and regulations<br />
covering the discharge of materials into the environment,<br />
or otherwise relating to protection of the environment,<br />
affect <strong>EOG</strong>’s operations and costs as a result of their<br />
effect on natural gas and crude oil exploration, development<br />
and production operations and could cause <strong>EOG</strong> to<br />
incur remediation or other corrective action costs in connection<br />
with a release of regulated substances, including<br />
crude oil, into the environment. In addition, <strong>EOG</strong> has<br />
acquired certain oil and gas properties from third parties<br />
whose actions with respect to the management and disposal<br />
or release of hydrocarbons or other wastes were not<br />
under <strong>EOG</strong>’s control. Under environmental laws and regulations,<br />
<strong>EOG</strong> could be required to remove or remediate<br />
wastes disposed of or released by prior owners or operators.<br />
In addition, <strong>EOG</strong> could be responsible under environmental<br />
laws and regulations for oil and gas properties in<br />
which <strong>EOG</strong> owns an interest but is not the operator.<br />
Compliance with such laws and regulations increases<br />
<strong>EOG</strong>’s overall cost of business, but has not had a material<br />
adverse effect on <strong>EOG</strong>’s operations or financial condition.<br />
It is not anticipated, based on current laws and regulations,<br />
that <strong>EOG</strong> will be required in the near future to<br />
expend amounts that are material in relation to its total<br />
exploration and development expenditure program in<br />
order to comply with environmental laws and regulations<br />
but, inasmuch as such laws and regulations are frequently<br />
changed, <strong>EOG</strong> is unable to predict the ultimate cost of<br />
compliance. <strong>EOG</strong> also could incur costs related to the<br />
clean up of sites to which it sent regulated substances for<br />
disposal or to which it sent equipment for cleaning, and for<br />
damages to natural resources or other claims related to<br />
releases of regulated substances at such sites.<br />
SUMMARY OF CRITICAL ACCOUNTING POLICIES<br />
<strong>EOG</strong> prepares its financial statements and the accompanying<br />
notes in conformity with accounting principles<br />
generally accepted in the United States of America, which<br />
requires management to make estimates and assumptions<br />
about future events that affect the reported amounts in the<br />
financial statements and the accompanying notes. <strong>EOG</strong><br />
identifies certain accounting policies as critical based on,<br />
among other things, their impact on the portrayal of <strong>EOG</strong>’s<br />
financial condition, results of operations or liquidity, and<br />
the degree of difficulty, subjectivity and complexity in their<br />
deployment. Critical accounting policies cover accounting<br />
matters that are inherently uncertain because the future<br />
resolution of such matters is unknown. Management routinely<br />
discusses the development, selection and disclosure<br />
of each of the critical accounting policies. Following<br />
is a discussion of <strong>EOG</strong>’s most critical accounting policies:<br />
Proved Oil and Gas Reserves<br />
<strong>EOG</strong>’s engineers estimate proved oil and gas<br />
reserves, which directly impact financial accounting estimates,<br />
including depreciation, depletion and amortization.<br />
Proved reserves represent estimated quantities of natural<br />
gas, crude oil, condensate, and natural gas liquids that<br />
geological and engineering data demonstrate, with reasonable<br />
certainty, to be recoverable in future years from<br />
known reservoirs under economic and operating conditions<br />
existing at the time the estimates were made. The<br />
process of estimating quantities of proved oil and gas<br />
reserves is very complex, requiring significant subjective<br />
decisions in the evaluation of all available geological, engi-<br />
2004 ANNUAL REPORT TO SHAREHOLDERS 19
neering and economic data for each reservoir. The data for<br />
a given reservoir may also change substantially over time<br />
as a result of numerous factors including, but not limited<br />
to, additional development activity, evolving production<br />
history and continual reassessment of the viability of production<br />
under varying economic conditions. Consequently,<br />
material revisions (upward or downward) to existing<br />
reserve estimates may occur from time to time.<br />
Impairments<br />
Oil and gas lease acquisition costs are capitalized<br />
when incurred. Unproved properties with individually significant<br />
acquisition costs are assessed quarterly on a<br />
property-by-property basis, and any impairment in value is<br />
recognized. Unproved properties with acquisition costs<br />
that are not individually significant are aggregated, and the<br />
portion of such costs estimated to be nonproductive,<br />
based on historical experience, is amortized over the<br />
average holding period. If the unproved properties are<br />
determined to be productive, the appropriate related costs<br />
are transferred to proved oil and gas properties. Lease<br />
rentals are expensed as incurred.<br />
Oil and gas exploration costs, other than the costs of<br />
drilling exploratory wells, are charged to expense as<br />
incurred. The costs of drilling exploratory wells are capitalized<br />
pending determination of whether they have discovered<br />
proved commercial reserves. Exploratory drilling<br />
costs are capitalized when drilling is complete if it is<br />
determined that there is economic producibility supported<br />
by either actual production, a conclusive formation<br />
test or by certain technical data if the discovery is located<br />
offshore in the Gulf of Mexico. If proved commercial<br />
reserves are not discovered, such drilling costs are<br />
expensed. In some circumstances, it may be uncertain<br />
whether proved commercial reserves have been found<br />
due to the requirement of a significant capital investment.<br />
Such exploratory drilling costs may continue to be capitalized<br />
if the reserve quantity is sufficient to justify development<br />
when the investment is made and additional<br />
exploratory wells are either in progress or firmly planned.<br />
All other exploratory wells that do not meet these criteria<br />
are expensed after one year. As of December 31, 2004<br />
and 2003, <strong>EOG</strong> had exploratory drilling costs of $4.3 million<br />
and $4.5 million, respectively, related to an outside<br />
operated, deepwater offshore Gulf of Mexico discovery<br />
that has been deferred for more than one year and will<br />
require significant future capital expenditures before production<br />
can commence. These costs meet the accounting<br />
requirements outlined above for continued capitalization.<br />
As of December 31, 2004 and 2003, there were no<br />
material exploratory drilling costs capitalized for more<br />
than one year for projects that did not require a major<br />
capital investment. Costs to develop proved reserves,<br />
including the costs of all development wells and related<br />
equipment used in the production of natural gas and<br />
crude oil, are capitalized.<br />
When circumstances indicate that an asset may be<br />
impaired, <strong>EOG</strong> compares expected undiscounted future<br />
cash flows at a producing field level to the unamortized<br />
capitalized cost of the asset. If the future undiscounted<br />
cash flows, based on <strong>EOG</strong>’s estimate of future crude oil<br />
and natural gas prices, operating costs, anticipated production<br />
from proved reserves and other relevant data, are<br />
lower than the unamortized capitalized cost, the capitalized<br />
cost is reduced to fair value. Fair value is calculated<br />
by discounting the future cash flows at an appropriate<br />
risk-adjusted discount rate.<br />
Depreciation, Depletion and Amortization for Oil<br />
and Gas Properties<br />
The quantities of estimated proved oil and gas<br />
reserves are a significant component of our calculation of<br />
depletion expense and revisions in such estimates may<br />
alter the rate of future expense. Holding all other factors<br />
constant, if reserves were revised upward or downward,<br />
earnings would increase or decrease respectively.<br />
Depreciation, depletion and amortization of the cost<br />
of proved oil and gas properties is calculated using the<br />
unit-of-production method. The reserve base used to calculate<br />
depletion, depreciation or amortization is the sum<br />
of proved developed reserves and proved undeveloped<br />
reserves for leasehold acquisition costs and the cost to<br />
acquire proved properties. The reserve base includes only<br />
proved developed reserves for lease and well equipment<br />
costs, which include development costs and successful<br />
exploration drilling costs. Estimated future dismantlement,<br />
restoration and abandonment costs, net of salvage<br />
values, are taken into account. Certain other assets are<br />
depreciated on a straight-line basis.<br />
Assets are grouped in accordance with paragraph 30<br />
of SFAS No. 19. The basis for grouping is a reasonable<br />
aggregation of properties with a common geological<br />
structural feature or stratigraphic condition, such as a<br />
reservoir or field.<br />
Amortization rates are updated quarterly to reflect: 1)<br />
the addition of capital costs, 2) reserve revisions (upwards<br />
or downwards) and additions, 3) property acquisitions<br />
and/or property dispositions, and 4) impairments.<br />
20 <strong>EOG</strong> RESOURCES, INC.
Stock Options<br />
<strong>EOG</strong> accounts for stock options under the provisions<br />
and related interpretations of Accounting Principles Board<br />
(APB) Opinion No. 25 - “Accounting for Stock Issued to<br />
Employees.” No compensation expense is recognized for<br />
such options. As allowed by SFAS No. 123 - “Accounting<br />
for Stock-Based Compensation” issued in 1995, <strong>EOG</strong> has<br />
continued to apply APB Opinion No. 25 for purposes of<br />
determining net income and to present the pro forma disclosures<br />
required by SFAS No. 123.<br />
In December 2002, the Financial Accounting<br />
Standards Board (FASB) issued SFAS No. 148 –<br />
“Accounting for Stock-Based Compensation – Transition<br />
and Disclosure – an amendment of FASB Statement No.<br />
123.” In December 2004, the FASB issued SFAS No.<br />
123(R), “Share-Based Payment,” which supersedes SFAS<br />
No. 148. SFAS No. 123(R), establishes standards for transactions<br />
in which an entity exchanges its equity instruments<br />
for goods or services. This standard requires a public<br />
entity to measure the cost of employee services<br />
received in exchange for an award of equity instruments<br />
based on the grant-date fair value of the award. This eliminates<br />
the exception to account for such awards using the<br />
intrinsic method previously allowable under APB Opinion<br />
No. 25. SFAS No. 123(R) will be effective for interim or<br />
annual reporting periods beginning on or after June 15,<br />
2005. <strong>EOG</strong> currently expects to adopt SFAS No. 123(R)<br />
effective July 1, 2005 using the modified prospective<br />
method. <strong>EOG</strong> expects that the adoption of SFAS No.<br />
123(R) would reduce second half 2005 net earnings by a<br />
pre-tax amount of approximately $10 million, which<br />
includes approximately $0.5 million for the Employee<br />
Stock Purchase Plan. SFAS No. 123(R) also requires a<br />
public entity to present its cash flows provided by tax benefits<br />
from stock options exercised in the Financing Cash<br />
Flows section of the Statement of Cash Flows. Had SFAS<br />
No. 123(R) been in effect, <strong>EOG</strong>’s Net Cash Provided by<br />
Operating Activities would have been reduced and its Net<br />
Cash Provided by Financing Activities would have been<br />
increased on its Consolidated Statements of Cash Flows<br />
by $29 million, $12 million and $5 million for 2004, 2003<br />
and 2002, respectively.<br />
INFORMATION REGARDING FORWARD-<br />
LOOKING STATEMENTS<br />
This 2004 Annual Report to Shareholders includes<br />
forward-looking statements within the meaning of Section<br />
27A of the Securities Act of 1933 and Section 21E of the<br />
Securities Exchange Act of 1934. All statements other<br />
than statements of historical facts, including, among others,<br />
statements regarding <strong>EOG</strong>’s future financial position,<br />
business strategy, budgets, reserve information, projected<br />
levels of production, projected costs and plans and objectives<br />
of management for future operations, are forwardlooking<br />
statements. <strong>EOG</strong> typically uses words such as<br />
“expect,” “anticipate,” “estimate,” “strategy,” “intend,”<br />
“plan,” “target” and “believe” or the negative of those<br />
terms or other variations of them or by comparable terminology<br />
to identify its forward-looking statements. In particular,<br />
statements, express or implied, concerning future<br />
operating results, the ability to replace or increase<br />
reserves or to increase production, or the ability to generate<br />
income or cash flows are forward-looking statements.<br />
Forward-looking statements are not guarantees of performance.<br />
Although <strong>EOG</strong> believes its expectations reflected<br />
in forward-looking statements are based on reasonable<br />
assumptions, no assurance can be given that these<br />
expectations will be achieved. Important factors that<br />
could cause actual results to differ materially from the<br />
expectations reflected in the forward-looking statements<br />
include, among others: the timing and extent of changes<br />
in commodity prices for crude oil, natural gas and related<br />
products, foreign currency exchange rates and interest<br />
rates; the timing and impact of liquefied natural gas<br />
imports and changes in demand or prices for ammonia or<br />
methanol; the extent and effect of any hedging activities<br />
engaged in by <strong>EOG</strong>; the extent of <strong>EOG</strong>’s success in discovering,<br />
developing, marketing and producing reserves<br />
and in acquiring oil and gas properties; the accuracy of<br />
reserve estimates, which by their nature involve the exercise<br />
of professional judgment and may therefore be imprecise;<br />
the availability and cost of drilling rigs, experienced<br />
drilling crews and tubular steel; the availability of pipeline<br />
transportation capacity; the extent to which <strong>EOG</strong> can<br />
replicate on its other Barnett Shale acreage the results of<br />
its most recent Barnett Shale wells; the results of wells yet<br />
to be drilled that are necessary to test whether substantial<br />
Barnett Shale acreage positions outside of Johnson and<br />
Parker Counties, Texas, contain suitable drilling<br />
prospects; whether <strong>EOG</strong> is successful in its efforts to<br />
more densely develop its acreage in the Barnett Shale and<br />
other production areas; political developments around the<br />
world; acts of war and terrorism and responses to these<br />
acts; and financial market conditions. In light of these<br />
risks, uncertainties and assumptions, the events anticipated<br />
by <strong>EOG</strong>’s forward-looking statements might not occur.<br />
<strong>EOG</strong> undertakes no obligations to update or revise its forward-looking<br />
statements, whether as a result of new information,<br />
future events or otherwise.<br />
2004 ANNUAL REPORT TO SHAREHOLDERS 21
MANAGEMENT’S RESPONSIBILITY FOR FINANCIAL REPORTING<br />
The following consolidated financial statements of<br />
<strong>EOG</strong> <strong>Resources</strong>, <strong>Inc</strong>. and its subsidiaries (<strong>EOG</strong>) were prepared<br />
by management, which is responsible for their<br />
integrity, objectivity and fair presentation. The statements<br />
have been prepared in conformity with generally accepted<br />
accounting principles and, accordingly, include some<br />
amounts that are based on the best estimates and judgments<br />
of management.<br />
<strong>EOG</strong>’s management is also responsible for establishing<br />
and maintaining effective internal control over financial<br />
reporting. The system of internal control of <strong>EOG</strong> is designed<br />
to provide reasonable assurance regarding the reliability of<br />
financial reporting and the preparation of financial statements<br />
for external purposes in accordance with generally<br />
accepted accounting principles. This system consists of:<br />
1) entity level controls, including written policies and guidelines<br />
relating to the ethical conduct of business affairs,<br />
2) general computer controls and 3) process controls over<br />
initiating, authorizing, recording, processing and reporting<br />
transactions. Even an effective internal control system, no<br />
matter how well designed, has inherent limitations, including<br />
the possibility of human error and circumvention or overriding<br />
of controls and therefore can provide only reasonable<br />
assurance with respect to reliable financial reporting.<br />
Furthermore, the effectiveness of an internal control system<br />
in future periods can change with conditions.<br />
The adequacy of financial controls of <strong>EOG</strong> and the<br />
accounting principles employed in financial reporting by<br />
<strong>EOG</strong> are under the general oversight of the Audit Committee<br />
of the Board of Directors. No member of this committee is<br />
an officer or employee of <strong>EOG</strong>. The independent public<br />
accountants and internal auditors have full, free, separate<br />
and direct access to the Audit Committee and meet with the<br />
committee from time to time to discuss accounting, auditing<br />
and financial reporting matters.<br />
<strong>EOG</strong>’s management assessed the effectiveness of<br />
<strong>EOG</strong>’s internal control over financial reporting as of<br />
December 31, 2004. In making this assessment, we used<br />
the criteria set forth by the Committee of Sponsoring<br />
Organizations of the Treadway Commission (COSO) in<br />
Internal Control – Integrated Framework. These criteria<br />
cover the control environment, risk assessment process,<br />
control activities, information and communication systems,<br />
and monitoring activities. Based on this assessment, management<br />
believes that, as of December 31, 2004, <strong>EOG</strong>’s<br />
internal control over financial reporting is effective based on<br />
those criteria.<br />
Deloitte & Touche LLP, independent public accountants,<br />
was engaged to audit the consolidated financial statements<br />
and management’s assessment of the effectiveness<br />
of <strong>EOG</strong>’s internal control over financial reporting, and to<br />
issue a report thereon. In the conduct of the audit, Deloitte<br />
& Touche LLP was given unrestricted access to all financial<br />
records and related data including minutes of all meetings<br />
of shareholders, the Board of Directors and committees of<br />
the Board. Management believes that all representations<br />
made to Deloitte & Touche LLP during the audit were valid<br />
and appropriate. Their audit was made in accordance with<br />
standards of the Public Company Accounting Oversight<br />
Board (United States) and included a review of the system<br />
of internal controls to the extent considered necessary to<br />
determine the audit procedures required to support their<br />
opinion on the consolidated financial statements, management’s<br />
assessment of <strong>EOG</strong>’s internal control over financial<br />
reporting and the effectiveness of <strong>EOG</strong>’s internal control<br />
over financial reporting. Their report appears on page 23.<br />
MARK G. PAPA<br />
Chairman of the Board and Chief Executive Officer<br />
EDMUND P. SEGNER, III<br />
President and Chief of Staff<br />
TIMOTHY K. DRIGGERS<br />
Vice President and Chief Accounting Officer<br />
Houston, Texas<br />
February 24, 2005<br />
22 <strong>EOG</strong> RESOURCES, INC.
REPORT OF INDEPENDENT REGISTERED PUBLIC ACCOUNTING FIRM<br />
To the Board of Directors and Stockholders of<br />
<strong>EOG</strong> <strong>Resources</strong>, <strong>Inc</strong>.<br />
Houston, Texas<br />
We have audited the accompanying consolidated balance<br />
sheets of <strong>EOG</strong> <strong>Resources</strong>, <strong>Inc</strong>. and subsidiaries (the<br />
“Company”) as of December 31, 2004 and 2003, and the related<br />
consolidated statements of income and comprehensive<br />
income, shareholders’ equity, and cash flows for each of the<br />
three years in the period ended December 31, 2004. We also<br />
have audited management’s assessment, included in the<br />
accompanying Management’s Responsibility for Financial<br />
Reporting, that the Company maintained effective internal<br />
control over financial reporting as of December 31, 2004,<br />
based on criteria established in Internal Control—Integrated<br />
Framework issued by the Committee of Sponsoring<br />
Organizations of the Treadway Commission. The Company’s<br />
management is responsible for these financial statements, for<br />
maintaining effective internal control over financial reporting,<br />
and for its assessment of the effectiveness of internal control<br />
over financial reporting. Our responsibility is to express an<br />
opinion on these financial statements, an opinion on management’s<br />
assessment, and an opinion on the effectiveness of the<br />
Company’s internal control over financial reporting based on<br />
our audits.<br />
We conducted our audits in accordance with the standards<br />
of the Public Company Accounting Oversight Board<br />
(United States). Those standards require that we plan and<br />
perform the audit to obtain reasonable assurance about<br />
whether the financial statements are free of material misstatement<br />
and whether effective internal control over financial<br />
reporting was maintained in all material respects. Our audit of<br />
financial statements included examining, on a test basis, evidence<br />
supporting the amounts and disclosures in the financial<br />
statements, assessing the accounting principles used<br />
and significant estimates made by management, and evaluating<br />
the overall financial statement presentation. Our audit of<br />
internal control over financial reporting included obtaining an<br />
understanding of internal control over financial reporting,<br />
evaluating management’s assessment, testing and evaluating<br />
the design and operating effectiveness of internal control,<br />
and performing such other procedures as we considered<br />
necessary in the circumstances. We believe that our audits<br />
provide a reasonable basis for our opinions.<br />
A company’s internal control over financial reporting is a<br />
process designed by, or under the supervision of, the company’s<br />
principal executive and principal financial officers, or<br />
persons performing similar functions, and effected by the<br />
company’s board of directors, management, and other personnel<br />
to provide reasonable assurance regarding the reliability<br />
of financial reporting and the preparation of financial<br />
statements for external purposes in accordance with<br />
accounting principles generally accepted in the United States<br />
of America. A company’s internal control over financial<br />
reporting includes those policies and procedures that (1) pertain<br />
to the maintenance of records that, in reasonable detail,<br />
accurately and fairly reflect the transactions and dispositions<br />
of the assets of the company; (2) provide reasonable assurance<br />
that transactions are recorded as necessary to permit<br />
preparation of financial statements in accordance with<br />
accounting principles generally accepted in the United States<br />
of America and that receipts and expenditures of the company<br />
are being made only in accordance with authorizations of<br />
management and directors of the company; and (3) provide<br />
reasonable assurance regarding prevention or timely detection<br />
of unauthorized acquisition, use, or disposition of the<br />
company’s assets that could have a material effect on the<br />
financial statements.<br />
Because of the inherent limitations of internal control<br />
over financial reporting, including the possibility of collusion<br />
or improper management override of controls, material misstatements<br />
due to error or fraud may not be prevented or<br />
detected on a timely basis. Also, projections of any evaluation<br />
of the effectiveness of the internal control over financial<br />
reporting to future periods are subject to the risk that the controls<br />
may become inadequate because of changes in conditions,<br />
or that the degree of compliance with the policies or<br />
procedures may deteriorate.<br />
In our opinion, the consolidated financial statements<br />
referred to above present fairly, in all material respects, the<br />
financial position of the Company as of December 31, 2004<br />
and 2003, and the results of its operations and its cash flows<br />
for each of the three years in the period ended December 31,<br />
2004, in conformity with accounting principles generally<br />
accepted in the United States of America. Also, in our opinion,<br />
management’s assessment that the Company maintained<br />
effective internal control over financial reporting as of<br />
December 31, 2004, is fairly stated, in all material respects,<br />
based on the criteria established in Internal Control—<br />
Integrated Framework issued by the Committee of<br />
Sponsoring Organizations of the Treadway Commission.<br />
Furthermore, in our opinion, the Company maintained, in all<br />
material respects, effective internal control over financial<br />
reporting as of December 31, 2004, based on the criteria<br />
established in Internal Control—Integrated Framework issued<br />
by the Committee of Sponsoring Organizations of the<br />
Treadway Commission.<br />
DELOITTE & TOUCHE LLP<br />
Houston, Texas<br />
February 24, 2005<br />
2004 ANNUAL REPORT TO SHAREHOLDERS 23
CONSOLIDATED STATEMENTS OF INCOME AND COMPREHENSIVE INCOME<br />
Year Ended December 31<br />
(In Thousands, Except Per Share Amounts) 2004 2003 2002<br />
Net Operating Revenues<br />
Natural Gas . . . . . . . . . . . . . . . . . . . . . . . . . . . . . . . . . . . . . . . . . . . . . . . . . . . . $ 1,843,895 $1,537,352 $ 915,129<br />
Crude Oil, Condensate and Natural Gas Liquids . . . . . . . . . . . . . . . . . . . . . . . 458,446 283,042 227,309<br />
Losses on Mark-to-Market Commodity Derivative Contracts. . . . . . . . . . . . . . (33,449) (80,414) (48,508)<br />
Other, Net. . . . . . . . . . . . . . . . . . . . . . . . . . . . . . . . . . . . . . . . . . . . . . . . . . . . . . 2,333 4,695 752<br />
Total . . . . . . . . . . . . . . . . . . . . . . . . . . . . . . . . . . . . . . . . . . . . . . . . . . . . . . . . 2,271,225 1,744,675 1,094,682<br />
Operating Expenses<br />
Lease and Well, including Transportation . . . . . . . . . . . . . . . . . . . . . . . . . . . . . 271,086 212,601 179,429<br />
Exploration Costs. . . . . . . . . . . . . . . . . . . . . . . . . . . . . . . . . . . . . . . . . . . . . . . . 93,941 76,358 60,228<br />
Dry Hole Costs. . . . . . . . . . . . . . . . . . . . . . . . . . . . . . . . . . . . . . . . . . . . . . . . . . 92,142 41,156 46,749<br />
Impairments . . . . . . . . . . . . . . . . . . . . . . . . . . . . . . . . . . . . . . . . . . . . . . . . . . . . 81,530 89,133 68,430<br />
Depreciation, Depletion and Amortization . . . . . . . . . . . . . . . . . . . . . . . . . . . . . 504,403 441,843 398,036<br />
General and Administrative . . . . . . . . . . . . . . . . . . . . . . . . . . . . . . . . . . . . . . . . 115,013 100,403 88,952<br />
Taxes Other Than <strong>Inc</strong>ome . . . . . . . . . . . . . . . . . . . . . . . . . . . . . . . . . . . . . . . . . 133,915 85,867 71,881<br />
Total . . . . . . . . . . . . . . . . . . . . . . . . . . . . . . . . . . . . . . . . . . . . . . . . . . . . . . . . 1,292,030 1,047,361 913,705<br />
Operating <strong>Inc</strong>ome . . . . . . . . . . . . . . . . . . . . . . . . . . . . . . . . . . . . . . . . . . . . . . . . . . 979,195 697,314 180,977<br />
Other <strong>Inc</strong>ome (Expense), Net. . . . . . . . . . . . . . . . . . . . . . . . . . . . . . . . . . . . . . . . . 9,945 15,273 (1,651)<br />
<strong>Inc</strong>ome Before Interest Expense and <strong>Inc</strong>ome Taxes. . . . . . . . . . . . . . . . . . . . . . 989,140 712,587 179,326<br />
Interest Expense<br />
<strong>Inc</strong>urred . . . . . . . . . . . . . . . . . . . . . . . . . . . . . . . . . . . . . . . . . . . . . . . . . . . . . . . 72,759 67,252 68,641<br />
Capitalized . . . . . . . . . . . . . . . . . . . . . . . . . . . . . . . . . . . . . . . . . . . . . . . . . . . . . (9,631) (8,541) (8,987)<br />
Net Interest Expense . . . . . . . . . . . . . . . . . . . . . . . . . . . . . . . . . . . . . . . . . . . 63,128 58,711 59,654<br />
<strong>Inc</strong>ome Before <strong>Inc</strong>ome Taxes . . . . . . . . . . . . . . . . . . . . . . . . . . . . . . . . . . . . . . . . 926,012 653,876 119,672<br />
<strong>Inc</strong>ome Tax Provision . . . . . . . . . . . . . . . . . . . . . . . . . . . . . . . . . . . . . . . . . . . . . . . 301,157 216,600 32,499<br />
Net <strong>Inc</strong>ome Before Cumulative Effect of Change<br />
in Accounting Principle . . . . . . . . . . . . . . . . . . . . . . . . . . . . . . . . . . . . . . . . . . . . 624,855 437,276 87,173<br />
Cumulative Effect of Change in Accounting<br />
Principle, Net of <strong>Inc</strong>ome Tax . . . . . . . . . . . . . . . . . . . . . . . . . . . . . . . . . . . . . . . . - (7,131) -<br />
Net <strong>Inc</strong>ome. . . . . . . . . . . . . . . . . . . . . . . . . . . . . . . . . . . . . . . . . . . . . . . . . . . . . . . . 624,855 430,145 87,173<br />
Preferred Stock Dividends . . . . . . . . . . . . . . . . . . . . . . . . . . . . . . . . . . . . . . . . . . . 10,892 11,032 11,032<br />
Net <strong>Inc</strong>ome Available to Common. . . . . . . . . . . . . . . . . . . . . . . . . . . . . . . . . . . . . $ 613,963 $ 419,113 $ 76,141<br />
Net <strong>Inc</strong>ome Per Share Available to Common<br />
Basic<br />
Net <strong>Inc</strong>ome Available to Common Before<br />
Cumulative Effect of Change in Accounting Principle. . . . . . . . . . . . . . . . . $ 5.25 $ 3.72 $ 0.66<br />
Cumulative Effect of Change in Accounting<br />
Principle, Net of <strong>Inc</strong>ome Tax . . . . . . . . . . . . . . . . . . . . . . . . . . . . . . . . . . . . - (0.06) -<br />
Net <strong>Inc</strong>ome Available to Common . . . . . . . . . . . . . . . . . . . . . . . . . . . . . . . . . $ 5.25 $ 3.66 $ 0.66<br />
Diluted<br />
Net <strong>Inc</strong>ome Available to Common Before Cumulative Effect<br />
of Change in Accounting Principle . . . . . . . . . . . . . . . . . . . . . . . . . . . . . . . $ 5.15 $ 3.66 $ 0.65<br />
Cumulative Effect of Change in Accounting<br />
Principle, Net of <strong>Inc</strong>ome Tax . . . . . . . . . . . . . . . . . . . . . . . . . . . . . . . . . . . . - (0.06) -<br />
Net <strong>Inc</strong>ome Available to Common . . . . . . . . . . . . . . . . . . . . . . . . . . . . . . . . . $ 5.15 $ 3.60 $ 0.65<br />
Average Number of Common Shares<br />
Basic . . . . . . . . . . . . . . . . . . . . . . . . . . . . . . . . . . . . . . . . . . . . . . . . . . . . . . . . . 116,876 114,597 115,335<br />
Diluted . . . . . . . . . . . . . . . . . . . . . . . . . . . . . . . . . . . . . . . . . . . . . . . . . . . . . . . . 119,188 116,519 117,245<br />
Comprehensive <strong>Inc</strong>ome<br />
Net <strong>Inc</strong>ome. . . . . . . . . . . . . . . . . . . . . . . . . . . . . . . . . . . . . . . . . . . . . . . . . . . . . . . . $ 624,855 $ 430,145 $ 87,173<br />
Other Comprehensive <strong>Inc</strong>ome (Loss)<br />
Foreign Currency Translation Adjustment . . . . . . . . . . . . . . . . . . . . . . . . . . . . . 77,925 123,811 4,315<br />
Foreign Currency Swap Transaction, Net of <strong>Inc</strong>ome Tax Benefit of $1,972 . . . (3,844) - -<br />
Available-for-Sale Security Transactions . . . . . . . . . . . . . . . . . . . . . . . . . . . . . . - - 926<br />
Comprehensive <strong>Inc</strong>ome . . . . . . . . . . . . . . . . . . . . . . . . . . . . . . . . . . . . . . . . . . . . . $ 698,936 $ 553,956 $ 92,414<br />
The accompanying notes are an integral part of these consolidated financial statements.<br />
24 <strong>EOG</strong> RESOURCES, INC.
CONSOLIDATED BALANCE SHEETS<br />
At December 31<br />
(In Thousands, Except Share Data) 2004 2003<br />
ASSETS<br />
Current Assets<br />
Cash and Cash Equivalents . . . . . . . . . . . . . . . . . . . . . . . . . . . . . . . . . . . . . . . . . . . . $ 20,980 $ 4,443<br />
Accounts Receivable, Net . . . . . . . . . . . . . . . . . . . . . . . . . . . . . . . . . . . . . . . . . . . . . . 447,742 295,118<br />
Inventories . . . . . . . . . . . . . . . . . . . . . . . . . . . . . . . . . . . . . . . . . . . . . . . . . . . . . . . . . . 40,037 21,922<br />
Assets from Price Risk Management Activities. . . . . . . . . . . . . . . . . . . . . . . . . . . . . . 10,747 -<br />
<strong>Inc</strong>ome Taxes Receivable . . . . . . . . . . . . . . . . . . . . . . . . . . . . . . . . . . . . . . . . . . . . . . 3,232 7,976<br />
Deferred <strong>Inc</strong>ome Taxes . . . . . . . . . . . . . . . . . . . . . . . . . . . . . . . . . . . . . . . . . . . . . . . . 22,227 31,548<br />
Other . . . . . . . . . . . . . . . . . . . . . . . . . . . . . . . . . . . . . . . . . . . . . . . . . . . . . . . . . . . . . . 41,838 35,007<br />
Total . . . . . . . . . . . . . . . . . . . . . . . . . . . . . . . . . . . . . . . . . . . . . . . . . . . . . . . . . . . . . 586,803 396,014<br />
Oil and Gas Properties (Successful Efforts Method) . . . . . . . . . . . . . . . . . . . . . . . . . . . . 9,599,276 8,189,062<br />
Less: Accumulated Depreciation, Depletion and Amortization. . . . . . . . . . . . . . . . . . (4,497,673) (3,940,145)<br />
Net Oil and Gas Properties . . . . . . . . . . . . . . . . . . . . . . . . . . . . . . . . . . . . . . . . . . . 5,101,603 4,248,917<br />
Other Assets . . . . . . . . . . . . . . . . . . . . . . . . . . . . . . . . . . . . . . . . . . . . . . . . . . . . . . . . . . . 110,517 104,084<br />
Total Assets . . . . . . . . . . . . . . . . . . . . . . . . . . . . . . . . . . . . . . . . . . . . . . . . . . . . . . . . . . . . $ 5,798,923 $ 4,749,015<br />
LIABILITIES AND SHAREHOLDERS’ EQUITY<br />
Current Liabilities<br />
Accounts Payable . . . . . . . . . . . . . . . . . . . . . . . . . . . . . . . . . . . . . . . . . . . . . . . . . . . . $ 424,581 $ 282,379<br />
Accrued Taxes Payable . . . . . . . . . . . . . . . . . . . . . . . . . . . . . . . . . . . . . . . . . . . . . . . . 51,116 33,276<br />
Dividends Payable . . . . . . . . . . . . . . . . . . . . . . . . . . . . . . . . . . . . . . . . . . . . . . . . . . . . 7,394 6,175<br />
Liabilities from Price Risk Management Activities . . . . . . . . . . . . . . . . . . . . . . . . . . . - 37,779<br />
Deferred <strong>Inc</strong>ome Taxes . . . . . . . . . . . . . . . . . . . . . . . . . . . . . . . . . . . . . . . . . . . . . . . . 103,933 73,611<br />
Other . . . . . . . . . . . . . . . . . . . . . . . . . . . . . . . . . . . . . . . . . . . . . . . . . . . . . . . . . . . . . . 45,180 43,299<br />
Total . . . . . . . . . . . . . . . . . . . . . . . . . . . . . . . . . . . . . . . . . . . . . . . . . . . . . . . . . . . . . 632,204 476,519<br />
Long-Term Debt . . . . . . . . . . . . . . . . . . . . . . . . . . . . . . . . . . . . . . . . . . . . . . . . . . . . . . . . 1,077,622 1,108,872<br />
Other Liabilities . . . . . . . . . . . . . . . . . . . . . . . . . . . . . . . . . . . . . . . . . . . . . . . . . . . . . . . . . 241,319 171,115<br />
Deferred <strong>Inc</strong>ome Taxes . . . . . . . . . . . . . . . . . . . . . . . . . . . . . . . . . . . . . . . . . . . . . . . . . . 902,354 769,128<br />
Shareholders’ Equity<br />
Preferred Stock, $.01 Par, 10,000,000 Shares Authorized:<br />
Series B, 100,000 Shares Issued, Cumulative,<br />
$100,000,000 Liquidation Preference . . . . . . . . . . . . . . . . . . . . . . . . . . . . . . . . . . . . 98,826 98,589<br />
Series D, 500 Shares Issued, Cumulative,<br />
$50,000,000 Liquidation Preference . . . . . . . . . . . . . . . . . . . . . . . . . . . . . . . . . . . . . - 49,827<br />
Common Stock, $.01 Par, 320,000,000 Shares Authorized and<br />
124,730,000 Shares Issued . . . . . . . . . . . . . . . . . . . . . . . . . . . . . . . . . . . . . . . . . . . . . . . 201,247 201,247<br />
Additional Paid in Capital . . . . . . . . . . . . . . . . . . . . . . . . . . . . . . . . . . . . . . . . . . . . . . . . . . 21,047 1,625<br />
Unearned Compensation . . . . . . . . . . . . . . . . . . . . . . . . . . . . . . . . . . . . . . . . . . . . . . . . . . (29,861) (23,473)<br />
Accumulated Other Comprehensive <strong>Inc</strong>ome . . . . . . . . . . . . . . . . . . . . . . . . . . . . . . . . . . . 148,015 73,934<br />
Retained Earnings. . . . . . . . . . . . . . . . . . . . . . . . . . . . . . . . . . . . . . . . . . . . . . . . . . . . . . . . 2,706,845 2,121,214<br />
Common Stock Held in Treasury, 5,802,556 shares at December 31,<br />
2004 and 8,819,600 shares at December 31, 2003. . . . . . . . . . . . . . . . . . . . . . . . . . . . . (200,695) (299,582)<br />
Total Shareholders’ Equity . . . . . . . . . . . . . . . . . . . . . . . . . . . . . . . . . . . . . . . . . . . . 2,945,424 2,223,381<br />
Total Liabilities and Shareholders’ Equity . . . . . . . . . . . . . . . . . . . . . . . . . . . . . . . . . . . $ 5,798,923 $ 4,749,015<br />
The accompanying notes are an integral part of these consolidated financial statements.<br />
2004 ANNUAL REPORT TO SHAREHOLDERS 25
CONSOLIDATED STATEMENTS OF SHAREHOLDERS’ EQUITY<br />
Accumulated<br />
Common<br />
Additional Other Stock Total<br />
Preferred Common Paid In Unearned Comprehensive Retained Held In Shareholders’<br />
(In Thousands, Except Per Share Amounts) Stock Stock Capital Compensation <strong>Inc</strong>ome (Loss) Earnings Treasury Equity<br />
Balance at December 31, 2001. . . . . . $ 147,582 $ 201,247 $ - $ (14,953) $ (55,118) $1,668,708 $ (304,780) $1,642,686<br />
Net <strong>Inc</strong>ome . . . . . . . . . . . . . . . . . . . - - - - - 87,173 - 87,173<br />
Amortization of Preferred<br />
Stock Discount . . . . . . . . . . . . . . . 417 - - - - (417) - -<br />
Preferred Stock Dividends<br />
Declared . . . . . . . . . . . . . . . . . . . . - - - - - (10,615) - (10,615)<br />
Common Stock Dividends<br />
Declared, $0.16 Per Share . . . . . . - - - - - (18,499) - (18,499)<br />
Translation Adjustment . . . . . . . . . . - - - - 4,315 - - 4,315<br />
Available-for-Sale Security<br />
Transactions . . . . . . . . . . . . . . . . . - - - - 926 - - 926<br />
Treasury Stock Purchased . . . . . . . - - - - - - (63,139) (63,139)<br />
Treasury Stock Issued Under:<br />
Stock Option Plans . . . . . . . . . . . - - (9,457) - - (2,402) 28,666 16,807<br />
Employee Stock Purchase Plan . . - - (39) - - - 2,301 2,262<br />
Tax Benefits from Stock<br />
Options Exercised . . . . . . . . . . . . - - 5,167 - - - - 5,167<br />
Restricted Stock and Units . . . . . . . - - 4,329 (4,951) - - 622 -<br />
Amortization of Unearned<br />
Compensation . . . . . . . . . . . . . . . - - - 4,871 - - - 4,871<br />
Treasury Shares Issued as<br />
Compensation . . . . . . . . . . . . . . . - - - - - - 441 441<br />
Balance at December 31, 2002. . . . . . 147,999 201,247 - (15,033) (49,877) 1,723,948 (335,889) 1,672,395<br />
Net <strong>Inc</strong>ome . . . . . . . . . . . . . . . . . . . - - - - - 430,145 - 430,145<br />
Amortization of Preferred<br />
Stock Discount . . . . . . . . . . . . . . . 417 - - - - (417) - -<br />
Preferred Stock Dividends<br />
Declared . . . . . . . . . . . . . . . . . . . . - - - - - (10,615) - (10,615)<br />
Common Stock Dividends<br />
Declared, $0.19 Per Share . . . . . . - - - - - (21,847) - (21,847)<br />
Translation Adjustment . . . . . . . . . . - - - - 123,811 - - 123,811<br />
Treasury Stock Purchased . . . . . . . - - - - - - (25,208) (25,208)<br />
Treasury Stock Issued Under:<br />
Stock Option Plans . . . . . . . . . . . - - (16,522) - - - 50,292 33,770<br />
Employee Stock Purchase Plan . . - - 84 - - - 2,515 2,599<br />
Tax Benefits from Stock<br />
Options Exercised . . . . . . . . . . . . - - 11,926 - - - - 11,926<br />
Restricted Stock and Units . . . . . . . - - 6,084 (14,467) - - 8,383 -<br />
Amortization of Unearned<br />
Compensation . . . . . . . . . . . . . . . - - - 6,027 - - - 6,027<br />
Treasury Stock Issued as<br />
Compensation . . . . . . . . . . . . . . . - - 53 - - - 325 378<br />
Balance at December 31, 2003. . . . . . 148,416 201,247 1,625 (23,473) 73,934 2,121,214 (299,582) 2,223,381<br />
Net <strong>Inc</strong>ome . . . . . . . . . . . . . . . . . . . - - - - - 624,855 - 624,855<br />
Redemption of Preferred Stock,<br />
$100,000 Per Share . . . . . . . . . . . (50,000) - - - - - - (50,000)<br />
Amortization of Preferred<br />
Stock Discount . . . . . . . . . . . . . . . 410 - - - - (410) - -<br />
Preferred Stock Dividends<br />
Declared . . . . . . . . . . . . . . . . . . . . - - - - - (10,482) - (10,482)<br />
Common Stock Dividends<br />
Declared, $0.24 Per Share . . . . . . - - - - - (28,332) - (28,332)<br />
Translation Adjustment . . . . . . . . . . - - - - 77,925 - - 77,925<br />
Treasury Stock Purchased . . . . . . . - - - - - - (9,565) (9,565)<br />
Foreign Currency Swap Transaction<br />
Net of <strong>Inc</strong>ome Tax Benefit<br />
of $1,972 . . . . . . . . . . . . . . . . . . . - - - - (3,844) - - (3,844)<br />
Treasury Stock Issued Under:<br />
Stock Option Plans . . . . . . . . . . . - - (21,570) - - - 101,077 79,507<br />
Employee Stock Purchase Plan . . - - 694 - - - 2,326 3,020<br />
Tax Benefits from Stock<br />
Options Exercised . . . . . . . . . . . . - - 29,396 - - - - 29,396<br />
Restricted Stock and Units . . . . . . . - - 10,902 (15,951) - - 5,049 -<br />
Amortization of Unearned<br />
Compensation . . . . . . . . . . . . . . . - - - 9,563 - - - 9,563<br />
Balance at December 31, 2004 . . . . $ 98,826 $ 201,247 $ 21,047 $ (29,861) $ 148,015 $2,706,845 $ (200,695) $2,945,424<br />
The accompanying notes are an integral part of these consolidated financial statements.<br />
26 <strong>EOG</strong> RESOURCES, INC.
CONSOLIDATED STATEMENTS OF CASH FLOWS<br />
Year Ended December 31<br />
(In Thousands) 2004 2003 2002<br />
Cash Flows From Operating Activities<br />
Reconciliation of Net <strong>Inc</strong>ome to Net Cash Provided by Operating Activities:<br />
Net <strong>Inc</strong>ome . . . . . . . . . . . . . . . . . . . . . . . . . . . . . . . . . . . . . . . . . . . . . . . $ 624,855 $ 430,145 $ 87,173<br />
Items Not Requiring Cash<br />
Depreciation, Depletion and Amortization . . . . . . . . . . . . . . . . . . . . . 504,403 441,843 398,036<br />
Impairments . . . . . . . . . . . . . . . . . . . . . . . . . . . . . . . . . . . . . . . . . . . . 81,530 89,133 68,430<br />
Deferred <strong>Inc</strong>ome Taxes . . . . . . . . . . . . . . . . . . . . . . . . . . . . . . . . . . . . 204,231 191,726 82,179<br />
Cumulative Effect of Change in Accounting<br />
Principle, Net of <strong>Inc</strong>ome Tax. . . . . . . . . . . . . . . . . . . . . . . . . . . . . . . - 7,131 -<br />
Other, Net . . . . . . . . . . . . . . . . . . . . . . . . . . . . . . . . . . . . . . . . . . . . . . 4,580 1,033 17,333<br />
Dry Hole Costs . . . . . . . . . . . . . . . . . . . . . . . . . . . . . . . . . . . . . . . . . . . . 92,142 41,156 46,749<br />
Mark-to-Market Commodity Derivative Contracts<br />
Total Losses . . . . . . . . . . . . . . . . . . . . . . . . . . . . . . . . . . . . . . . . . . . . 33,449 80,414 48,508<br />
Realized Losses . . . . . . . . . . . . . . . . . . . . . . . . . . . . . . . . . . . . . . . . . (82,644) (44,870) (21,136)<br />
Collar Premium . . . . . . . . . . . . . . . . . . . . . . . . . . . . . . . . . . . . . . . . . . (520) (3,003) (1,825)<br />
Tax Benefits from Stock Options Exercised . . . . . . . . . . . . . . . . . . . . . . 29,396 11,926 5,168<br />
Other, Net . . . . . . . . . . . . . . . . . . . . . . . . . . . . . . . . . . . . . . . . . . . . . . . . 537 2,141 (1,978)<br />
Changes in Components of Working Capital and Other Liabilities<br />
Accounts Receivable. . . . . . . . . . . . . . . . . . . . . . . . . . . . . . . . . . . . . . (151,799) (27,945) (59,957)<br />
Inventories. . . . . . . . . . . . . . . . . . . . . . . . . . . . . . . . . . . . . . . . . . . . . . (17,898) (2,840) (57)<br />
Accounts Payable . . . . . . . . . . . . . . . . . . . . . . . . . . . . . . . . . . . . . . . . 136,716 74,645 (21,468)<br />
Accrued Taxes Payable. . . . . . . . . . . . . . . . . . . . . . . . . . . . . . . . . . . . 18,197 12,056 (85,208)<br />
Other Liabilities . . . . . . . . . . . . . . . . . . . . . . . . . . . . . . . . . . . . . . . . . . (1,764) (3,257) 7,816<br />
Other, Net . . . . . . . . . . . . . . . . . . . . . . . . . . . . . . . . . . . . . . . . . . . . . . (2,683) (15,314) (1,199)<br />
Changes in Components of Working Capital<br />
Associated with Investing and Financing Activities . . . . . . . . . . . . . . (28,381) (36,944) 43,093<br />
Net Cash Provided by Operating Activities . . . . . . . . . . . . . . . . . . . . . . . . 1,444,347 1,249,176 611,657<br />
Investing Cash Flows<br />
Additions to Oil and Gas Properties . . . . . . . . . . . . . . . . . . . . . . . . . . . . (1,416,684) (1,245,539) (760,876)<br />
Proceeds from Sales of Assets . . . . . . . . . . . . . . . . . . . . . . . . . . . . . . . 13,459 13,553 7,514<br />
Changes in Components of Working Capital<br />
Associated with Investing Activities . . . . . . . . . . . . . . . . . . . . . . . . . . 26,788 38,491 (43,557)<br />
Other, Net . . . . . . . . . . . . . . . . . . . . . . . . . . . . . . . . . . . . . . . . . . . . . . . . (20,471) (13,946) (19,213)<br />
Net Cash Used in Investing Activities . . . . . . . . . . . . . . . . . . . . . . . . . . . . (1,396,908) (1,207,441) (816,132)<br />
Financing Cash Flows<br />
Net Commercial Paper and Line of Credit Borrowings (Repayments) . . (6,250) (36,260) 39,163<br />
Long-Term Debt Borrowings. . . . . . . . . . . . . . . . . . . . . . . . . . . . . . . . . . 150,000 - 250,000<br />
Long-Term Debt Repayments. . . . . . . . . . . . . . . . . . . . . . . . . . . . . . . . . (175,000) - -<br />
Dividends Paid . . . . . . . . . . . . . . . . . . . . . . . . . . . . . . . . . . . . . . . . . . . . (37,595) (31,294) (29,152)<br />
Redemption of Preferred Stock . . . . . . . . . . . . . . . . . . . . . . . . . . . . . . . (50,000) - -<br />
Treasury Stock Purchased . . . . . . . . . . . . . . . . . . . . . . . . . . . . . . . . . . . - (21,295) (63,038)<br />
Proceeds from Stock Options Exercised . . . . . . . . . . . . . . . . . . . . . . . . 75,510 35,138 17,339<br />
Other, Net . . . . . . . . . . . . . . . . . . . . . . . . . . . . . . . . . . . . . . . . . . . . . . . . 97 (3,485) (3,008)<br />
Net Cash Provided by (Used in) Financing Activities . . . . . . . . . . . . . . . . (43,238) (57,196) 211,304<br />
Effect of Exchange Rate Changes on Cash . . . . . . . . . . . . . . . . . . . . . . . 12,336 10,056 507<br />
<strong>Inc</strong>rease (Decrease) in Cash and Cash Equivalents . . . . . . . . . . . . . . . . . 16,537 (5,405) 7,336<br />
Cash and Cash Equivalents at Beginning of Year . . . . . . . . . . . . . . . . . . 4,443 9,848 2,512<br />
Cash and Cash Equivalents at End of Year . . . . . . . . . . . . . . . . . . . . . . . . $ 20,980 $ 4,443 $ 9,848<br />
The accompanying notes are an integral part of these consolidated financial statements.<br />
2004 ANNUAL REPORT TO SHAREHOLDERS 27
NOTES TO CONSOLIDATED FINANCIAL STATEMENTS<br />
1. SUMMARY OF SIGNIFICANT ACCOUNTING<br />
POLICIES<br />
Principles of Consolidation. The consolidated financial<br />
statements of <strong>EOG</strong> <strong>Resources</strong>, <strong>Inc</strong>. (<strong>EOG</strong>) include the<br />
accounts of all domestic and foreign subsidiaries.<br />
Investments in unconsolidated affiliates, in which <strong>EOG</strong> is<br />
able to exercise significant influence, are accounted for<br />
using the equity method. All material intercompany<br />
accounts and transactions have been eliminated.<br />
The preparation of financial statements in conformity<br />
with accounting principles generally accepted in the<br />
United States of America requires management to make<br />
estimates and assumptions that affect the reported<br />
amounts of assets and liabilities and disclosure of contingent<br />
assets and liabilities at the date of the financial statements<br />
and the reported amounts of revenue and expenses<br />
during the reporting period. Actual results could differ<br />
from those estimates.<br />
Certain reclassifications have been made to prior<br />
period financial statements to conform with the current<br />
presentation.<br />
Financial Instruments. <strong>EOG</strong>’s financial instruments<br />
consist of cash and cash equivalents, marketable securities,<br />
commodity derivative contracts, accounts receivable,<br />
accounts payable and long-term debt. The carrying values<br />
of cash and cash equivalents, marketable securities, commodity<br />
derivative contracts, accounts receivable and<br />
accounts payable approximate fair value (see Note 2 for<br />
fair value of long-term debt).<br />
Cash and Cash Equivalents. <strong>EOG</strong> records as cash<br />
equivalents all highly liquid short-term investments with<br />
original maturities of three months or less.<br />
Oil and Gas Operations. <strong>EOG</strong> accounts for its natural<br />
gas and crude oil exploration and production activities<br />
under the successful efforts method of accounting.<br />
Oil and gas lease acquisition costs are capitalized<br />
when incurred. Unproved properties with individually significant<br />
acquisition costs are assessed quarterly on a<br />
property-by-property basis, and any impairment in value is<br />
recognized. Unproved properties with acquisition costs<br />
that are not individually significant are aggregated, and the<br />
portion of such costs estimated to be nonproductive,<br />
based on historical experience, is amortized over the<br />
average holding period. If the unproved properties are<br />
determined to be productive, the appropriate related costs<br />
are transferred to proved oil and gas properties. Lease<br />
rentals are expensed as incurred.<br />
Oil and gas exploration costs, other than the costs of<br />
drilling exploratory wells, are charged to expense as<br />
incurred. The costs of drilling exploratory wells are capitalized<br />
pending determination of whether they have discovered<br />
proved commercial reserves. Exploratory drilling<br />
costs are capitalized when drilling is complete if it is determined<br />
that there is economic producibility supported by<br />
either actual production, a conclusive formation test or by<br />
certain technical data if the discovery is located offshore<br />
in the Gulf of Mexico. If proved commercial reserves are<br />
not discovered, such drilling costs are expensed. In some<br />
circumstances, it may be uncertain whether proved commercial<br />
reserves have been found due to the requirement<br />
of a significant capital investment. Such exploratory<br />
drilling costs may continue to be capitalized if the reserve<br />
quantity is sufficient to justify development when the<br />
investment is made and additional exploratory wells are<br />
either in progress or firmly planned. All other exploratory<br />
wells that do not meet these criteria are expensed after<br />
one year. As of December 31, 2004 and 2003, <strong>EOG</strong> had<br />
exploratory drilling costs of $4.3 million and $4.5 million,<br />
respectively, related to an outside operated, deepwater<br />
offshore Gulf of Mexico discovery that has been deferred<br />
for more than one year and will require significant future<br />
capital expenditures before production can commence.<br />
These costs meet the accounting requirements outlined<br />
above for continued capitalization. As of December 31,<br />
2004 and 2003, there were no material exploratory drilling<br />
costs capitalized for more than one year for projects that<br />
did not require a major capital investment. Costs to develop<br />
proved reserves, including the costs of all development<br />
wells and related equipment used in the production of natural<br />
gas and crude oil, are capitalized.<br />
Depreciation, depletion and amortization of the cost<br />
of proved oil and gas properties is calculated using the<br />
unit-of-production method. The reserve base used to calculate<br />
depletion, depreciation or amortization is the sum<br />
of proved developed reserves and proved undeveloped<br />
reserves for leasehold acquisition costs and the cost to<br />
acquire proved properties. The reserve base includes only<br />
proved developed reserves for lease and well equipment<br />
costs, which include development costs and successful<br />
exploration drilling costs. Estimated future dismantlement,<br />
restoration and abandonment costs, net of salvage values,<br />
are taken into account. Certain other assets are depreciated<br />
on a straight-line basis.<br />
Assets are grouped in accordance with paragraph 30<br />
of Statement of Financial Accounting Standards (SFAS)<br />
No. 19. The basis for grouping is a reasonable aggregation<br />
of properties with a common geological structural feature<br />
or stratigraphic condition, such as a reservoir or field.<br />
28 <strong>EOG</strong> RESOURCES, INC.
Amortization rates are updated quarterly to reflect: 1)<br />
the addition of capital costs, 2) reserve revisions (upwards<br />
or downwards) and additions, 3) property acquisitions<br />
and/or property dispositions, and 4) impairments.<br />
<strong>EOG</strong> accounts for impairments under the provisions<br />
of SFAS No. 144 - “Accounting for the Impairment or<br />
Disposal of Long-Lived Assets.” When circumstances<br />
indicate that an asset may be impaired, <strong>EOG</strong> compares<br />
expected undiscounted future cash flows at a producing<br />
field level to the unamortized capitalized cost of the asset.<br />
If the future undiscounted cash flows, based on <strong>EOG</strong>’s<br />
estimate of future crude oil and natural gas prices, operating<br />
costs, anticipated production from proved reserves<br />
and other relevant data, are lower than the unamortized<br />
capitalized cost, the capitalized cost is reduced to fair<br />
value. Fair value is calculated by discounting the future<br />
cash flows at an appropriate risk-adjusted discount rate.<br />
Inventories, consisting primarily of tubular goods and<br />
well equipment held for use in the exploration for and<br />
development and production of natural gas and crude oil<br />
reserves, are carried at cost with adjustments made from<br />
time to time to recognize any reductions in value.<br />
Arrangements for natural gas, crude oil, condensate<br />
and natural gas liquids sales are evidenced by signed contracts<br />
with determinable market prices and are recorded<br />
when production is delivered. A significant majority of the<br />
purchasers of these products have investment grade credit<br />
ratings and material credit losses have been rare.<br />
Revenues are recorded on the entitlement method based<br />
on <strong>EOG</strong>’s percentage ownership of current production.<br />
Each working interest owner in a well generally has the<br />
right to a specific percentage of production, although<br />
actual production sold on that owner’s behalf may differ<br />
from that owner’s ownership percentage. Under entitlement<br />
accounting, a receivable is recorded when underproduction<br />
occurs and a payable is recorded when overproduction<br />
occurs.<br />
Capitalized Interest Costs. Interest capitalization is<br />
required for those properties if its effect, compared with<br />
the effect of expensing interest, is material. Accordingly,<br />
certain interest costs have been capitalized as a part of<br />
the historical cost of unproved oil and gas properties. The<br />
amount capitalized is an allocation of the interest cost<br />
incurred during the reporting period. Capitalized interest is<br />
computed only during the exploration and development<br />
activities and not on proved properties. The interest rate<br />
used for capitalization purposes is based on the interest<br />
rates on <strong>EOG</strong>’s outstanding borrowings.<br />
Accounting for Price Risk Management Activities. <strong>EOG</strong><br />
accounts for its price risk management activities under the<br />
provisions of SFAS No. 133 - “Accounting for Derivative<br />
Instruments and Hedging Activities,” as amended by<br />
SFAS Nos. 137, 138 and 149. The statement establishes<br />
accounting and reporting standards requiring that every<br />
derivative instrument be recorded in the balance sheet as<br />
either an asset or liability measured at its fair value. The<br />
statement requires that changes in the derivative’s fair<br />
value be recognized currently in earnings unless specific<br />
hedge accounting criteria are met. During the three year<br />
period ending December 31, 2004, <strong>EOG</strong> elected not to<br />
designate any of its price risk management activities as<br />
accounting hedges under SFAS No. 133, and accordingly,<br />
accounted for them using the mark-to-market accounting<br />
method. Under this accounting method, the changes in<br />
the market value of outstanding financial instruments are<br />
recognized as gains or losses in the period of change. The<br />
gains or losses are recorded in Gains (Losses) on Mark-to-<br />
Market Commodity Derivative Contracts. The related cash<br />
flow impact is reflected as cash flows from operating<br />
activities (see Note 11).<br />
<strong>Inc</strong>ome Taxes. <strong>EOG</strong> accounts for income taxes under<br />
the provisions of SFAS No. 109 - “Accounting for <strong>Inc</strong>ome<br />
Taxes.” SFAS No. 109 requires the asset and liability<br />
approach for accounting for income taxes. Under this<br />
approach, deferred tax assets and liabilities are recognized<br />
based on anticipated future tax consequences<br />
attributable to differences between financial statement<br />
carrying amounts of assets and liabilities and their respective<br />
tax bases (see Note 5).<br />
Foreign Currency Translation. For subsidiaries whose<br />
functional currency is deemed to be other than the United<br />
States dollar, asset and liability accounts are translated at<br />
year-end exchange rates and revenue and expenses are<br />
translated at average exchange rates prevailing during the<br />
year. Translation adjustments are included in Accumulated<br />
Other Comprehensive <strong>Inc</strong>ome (Loss). Any gains or losses<br />
on transactions or monetary assets or liabilities in currencies<br />
other than the functional currency are included in net<br />
income in the current period.<br />
Net <strong>Inc</strong>ome Per Share. In accordance with the provisions<br />
of SFAS No. 128 - “Earnings per Share,” basic net<br />
income per share is computed on the basis of the weighted-average<br />
number of common shares outstanding during<br />
the periods. Diluted net income per share is computed<br />
based upon the weighted-average number of common<br />
shares plus the assumed issuance of common shares for<br />
all potentially dilutive securities (see Note 8 for additional<br />
information to reconcile the difference between the<br />
Average Number of Common Shares outstanding for basic<br />
and diluted net income per share).<br />
Stock Options. <strong>EOG</strong> accounts for stock options under<br />
the provisions and related interpretations of Accounting<br />
Principles Board (APB) Opinion No. 25 - “Accounting for<br />
Stock Issued to Employees.” No compensation expense is<br />
2004 ANNUAL REPORT TO SHAREHOLDERS 29
ecognized for such options. As allowed by SFAS No.<br />
123 - “Accounting for Stock-Based Compensation” issued<br />
in 1995, <strong>EOG</strong> has continued to apply APB Opinion No. 25<br />
for purposes of determining net income and to present the<br />
pro forma disclosures required by SFAS No. 123.<br />
<strong>EOG</strong>’s pro forma net income and net income per<br />
share of common stock for 2004, 2003 and 2002, had<br />
compensation costs been recorded in accordance with<br />
SFAS No. 123, are presented below (in millions, except<br />
per share data):<br />
2004 2003 2002<br />
Net <strong>Inc</strong>ome Available to<br />
Common - As Reported. . . . . . . . . $ 614.0 $ 419.1 $ 76.1<br />
Deduct: Total Stock-Based<br />
Employee Compensation Expense,<br />
Net of <strong>Inc</strong>ome Tax . . . . . . . . . . . . . (11.9) (13.9) (13.7)<br />
Net <strong>Inc</strong>ome Available to<br />
Common - Pro Forma . . . . . . . . . . $ 602.1 $ 405.2 $ 62.4<br />
Net <strong>Inc</strong>ome Per Share<br />
Available to Common<br />
Basic - As Reported . . . . . . . . . $ 5.25 $ 3.66 $ 0.66<br />
Basic - Pro Forma . . . . . . . . . . . $ 5.15 $ 3.54 $ 0.54<br />
Diluted - As Reported . . . . . . . . $ 5.15 $ 3.60 $ 0.65<br />
Diluted - Pro Forma . . . . . . . . . . $ 5.05 $ 3.48 $ 0.53<br />
For grants made prior to August 2004, the fair value of<br />
each option grant is estimated using the Black-Scholes<br />
option-pricing model with the following weighted-average<br />
assumptions used for grants in 2004, 2003 and 2002,<br />
respectively: (1) dividend yield of 0.4%, 0.4% and 0.4%,<br />
(2) expected volatility of 35%, 43% and 45%, (3) risk-free<br />
interest rate of 2.5%, 3.4% and 3.7%, and (4) expected<br />
life of 2.8 years, 5.2 years and 5.3 years.<br />
Beginning in August 2004, <strong>EOG</strong>’s stock options contain<br />
a feature that limits the potential gain that can be realized<br />
by requiring vested options to be exercised if the market<br />
price reaches 200% of the grant price for five consecutive<br />
trading days (Capped Option). The fair value of each<br />
Capped Option grant is estimated using a Monte Carlo<br />
Simulation Model assuming a dividend yield of 0.4%,<br />
expected volatility of 31%, risk-free interest rate of 4.24%<br />
and a weighted-average expected life of 4.83 years.<br />
During 2004, approximately 1,377,000 stock options were<br />
granted at a weighted-average fair value of $21.06 and<br />
were included in the above pro forma employee stock<br />
based compensation expense calculation. Approximately<br />
200,000 of the stock options were granted before August<br />
2004 with an average fair value of $16.04, based on the<br />
Black-Scholes Option-Pricing Model. Approximately<br />
1,177,000 of the stock options were granted with the<br />
Capped Option feature since August 1, 2004, with an average<br />
fair value of $21.91, based on the Monte Carlo<br />
Simulation Model. The average fair values for the stock<br />
options granted during 2003 and 2002 were $16.55 and<br />
$14.79, respectively.<br />
The effects of applying SFAS No. 123 in this pro<br />
forma disclosure should not be interpreted as being<br />
indicative of future effects. SFAS No. 123 does not apply<br />
to awards prior to 1995, and the extent and timing of additional<br />
future awards cannot be predicted.<br />
New Accounting Pronouncements. In June 2001, the<br />
Financial Accounting Standards Board (FASB) issued<br />
SFAS No. 143 - “Accounting for Asset Retirement<br />
Obligations” effective for fiscal years beginning after June<br />
15, 2002. SFAS No. 143 essentially requires entities to<br />
record the fair value of a liability for legal obligations associated<br />
with the retirement of tangible long-lived assets and<br />
the associated asset retirement costs. <strong>EOG</strong> adopted the<br />
statement on January 1, 2003. The impact of adopting the<br />
statement results in an after-tax charge of $7.1 million,<br />
which was reported in the first quarter of 2003 as cumulative<br />
effect of change in accounting principle.<br />
During the third quarter of 2003, the SEC made comments<br />
to other registrants that oil and gas mineral rights<br />
acquired should be classified as an intangible asset pursuant<br />
to SFAS No. 141 – “Business Combinations,” and<br />
SFAS No. 142 – “Goodwill and Other Intangible Assets.”<br />
On September 2, 2004, FASB Staff Position 142-2,<br />
“Application of FASB Statement No. 142, “Goodwill and<br />
Other Intangible Assets,” to Oil- and Gas-Producing<br />
Entities” was issued. The FASB staff believes that the<br />
scope exception in paragraph 8(b) of Statement 142<br />
extends to its disclosure provisions for drilling and mineral<br />
rights of oil- and gas-producing entities. Accordingly,<br />
the SEC comments made to the other registrants have no<br />
impact on <strong>EOG</strong>’s financial statements.<br />
On April 1, 2004, <strong>EOG</strong> adopted prospectively FASB<br />
Staff Position No. 106-2 – “Accounting and Disclosure<br />
Requirements related to the Medicare Prescription Drug,<br />
Improvement and Modernization Act of 2003” (FSP<br />
106-2), which provides guidance on accounting for the<br />
effects of the Medicare Prescription Drug Improvement<br />
Act of 2003 for employers that sponsor postretirement<br />
health care plans that provide prescription drug benefits.<br />
The adoption of FSP 106-2 did not have a material impact<br />
on <strong>EOG</strong>’s financial statements (see Note 6 for further<br />
information on <strong>EOG</strong>’s postretirement plan).<br />
On October 22, 2004, the American Jobs Creation Act<br />
of 2004 (the Act) was enacted. The Act provides a deduction<br />
for income from qualified domestic production activities,<br />
which will be phased in from 2005 through 2010. The<br />
Act also provides for a two-year phase out of the existing<br />
extra-territorial income exclusion (ETI) for foreign sales<br />
30 <strong>EOG</strong> RESOURCES, INC.
that was viewed to be inconsistent with international trade<br />
protocols by the European Union. <strong>EOG</strong> expects the net<br />
effect of the phase out of the ETI and the phase in of this<br />
new deduction to result in favorable adjustments to the<br />
effective tax rate for 2005 and subsequent years. Under<br />
the guidance in FASB Staff Position No. 109-1,<br />
“Application of FASB Statement No. 109, Accounting for<br />
<strong>Inc</strong>ome Taxes, to the Tax Deduction on Qualified<br />
Production Activities Provided by the American Jobs<br />
Creation Act of 2004,” the deduction will be treated as a<br />
“special deduction” as described in FASB 109. As such,<br />
the special deduction has no effect on deferred tax assets<br />
and liabilities existing at the enactment date. Rather, the<br />
impact of this deduction will be reported in the period in<br />
which the deduction is claimed on <strong>EOG</strong>’s tax return.<br />
The Act also creates a temporary incentive for United<br />
States corporations to repatriate accumulated income<br />
earned abroad by providing an 85% dividends received<br />
deduction for certain dividends from controlled foreign<br />
corporations. The deduction is subject to a number of limitations<br />
and, currently, uncertainty remains as to how to<br />
interpret some provisions in the Act. The Act limits the<br />
qualified dividends to the greater of $500 million or the<br />
amount of earnings permanently reinvested outside the<br />
United States, as reported in the 2002 financial statements,<br />
which was $550 million. In addition, a comprehensive<br />
analysis of foreign legal and tax ramifications must be<br />
completed before such dividends are declared. As such,<br />
<strong>EOG</strong> is not yet in a position to decide on whether, and to<br />
what extent, it might repatriate foreign earnings that have<br />
not yet been remitted to the United States. <strong>EOG</strong> expects<br />
to be in a position to complete the assessment by<br />
September 30, 2005.<br />
In December 2002, the FASB issued SFAS No. 148 –<br />
“Accounting for Stock-Based Compensation – Transition<br />
and Disclosure – an amendment of FASB Statement No.<br />
123.” In December 2004, the FASB issued SFAS No.<br />
123(R), “Share-Based Payment,” which supersedes SFAS<br />
No. 148. SFAS No. 123(R) establishes standards for transactions<br />
in which an entity exchanges its equity instruments<br />
for goods or services. This standard requires a public<br />
entity to measure the cost of employee services<br />
received in exchange for an award of equity instruments<br />
based on the grant-date fair value of the award. This eliminates<br />
the exception to account for such awards using the<br />
intrinsic method previously allowable under APB Opinion<br />
No. 25. SFAS No. 123(R) will be effective for interim or<br />
annual reporting periods beginning on or after June 15,<br />
2005. <strong>EOG</strong> currently expects to adopt SFAS No. 123(R)<br />
effective July 1, 2005 using the modified prospective<br />
method. <strong>EOG</strong> expects that the adoption of SFAS No.<br />
123(R) would reduce second half 2005 net earnings by a<br />
pre-tax amount of approximately $10 million, taking into<br />
consideration the estimated forfeitures and cancellations.<br />
The amount includes approximately $0.5 million for the<br />
Employee Stock Purchase Plan. SFAS No. 123(R) also<br />
requires a public entity to present its cash flows provided<br />
by tax benefits from stock options exercised in the<br />
Financing Cash Flows section of the Statement of Cash<br />
Flows. Had SFAS No. 123(R) been in effect, <strong>EOG</strong>’s Net<br />
Cash Provided by Operating Activities would have been<br />
reduced and its Net Cash Provided by Financing Activities<br />
would have been increased on its Consolidated<br />
Statements of Cash Flows by $29 million, $12 million and<br />
$5 million for 2004, 2003 and 2002, respectively (see Note<br />
6 for further information on <strong>EOG</strong>’s stock-based compensation<br />
plans).<br />
2. LONG-TERM DEBT<br />
Long-Term Debt at December 31 of the years indicated<br />
consisted of the following (in thousands):<br />
2004 2003<br />
Commercial Paper . . . . . . . . . . . . . . $ 91,800 $ 98,050<br />
Senior Unsecured Term<br />
Loan Facility due 2005 . . . . . . . . . 75,000 150,000<br />
6.50% Notes due 2004 . . . . . . . . . . - 100,000<br />
6.70% Notes due 2006 . . . . . . . . . . 126,870 126,870<br />
6.50% Notes due 2007 . . . . . . . . . . 100,000 100,000<br />
6.00% Notes due 2008 . . . . . . . . . . 173,952 173,952<br />
6.65% Notes due 2028 . . . . . . . . . . 140,000 140,000<br />
7.00% Subsidiary Debt due 2011. . . 220,000 220,000<br />
4.75% Subsidiary Debt due 2014. . . 150,000 -<br />
Total . . . . . . . . . . . . . . . . . . . . . $ 1,077,622 $ 1,108,872<br />
During 2004, <strong>EOG</strong> utilized commercial paper and during<br />
2003, <strong>EOG</strong> utilized commercial paper and short-term<br />
funding from uncommitted credit facilities, both bearing<br />
market interest rates, for various corporate financing purposes.<br />
Commercial paper and uncommitted credit borrowings<br />
are classified as long-term debt based on <strong>EOG</strong>’s<br />
intent and ability to ultimately replace such amounts with<br />
other long-term debt.<br />
On July 23, 2003, <strong>EOG</strong> entered into a new three-year<br />
Revolving Credit Agreement (Agreement) with domestic<br />
and foreign lenders which provides for $600 million in<br />
long-term committed credit, and concurrently cancelled<br />
the existing $300 million 364-day credit facility and $300<br />
million five-year credit facility scheduled to expire in July<br />
2003 and July 2004, respectively. This Agreement provides<br />
<strong>EOG</strong> the ability to replace the commercial paper,<br />
uncommitted credit borrowing and any maturity of debt.<br />
Advances under the Agreement bear interest based upon<br />
a base rate or a Eurodollar rate at the option of <strong>EOG</strong>. The<br />
Agreement also provides for the allocation, at the option<br />
2004 ANNUAL REPORT TO SHAREHOLDERS 31
of <strong>EOG</strong>, of up to $75 million of the $600 million to its<br />
Canadian subsidiary. Advances to the Canadian subsidiary,<br />
should they occur, would be guaranteed by <strong>EOG</strong><br />
and would bear interest at the option of the Canadian<br />
subsidiary based upon a Canadian prime rate or a<br />
Canadian banker’s acceptance rate. <strong>EOG</strong> also has the<br />
option to issue up to $100 million in letters of credit as<br />
part of this Agreement. No amounts were borrowed<br />
under this Agreement at December 31, 2004. The applicable<br />
base rates for this Facility, had there been any<br />
amounts borrowed under this Agreement would have<br />
been 5.25% and 4.00% at December 31, 2004 and<br />
December 31, 2003, respectively. The applicable<br />
Eurodollar rates for this Facility, had there been any<br />
amounts borrowed under this Agreement would have<br />
been 2.90% and 1.62% at December 31, 2004 and<br />
December 31, 2003, respectively.<br />
<strong>EOG</strong> maintains a three-year Senior Unsecured Term<br />
Loan Facility (Facility) with a group of banks whereby the<br />
banks lent <strong>EOG</strong> $150 million with a maturity date of October<br />
30, 2005. This Facility calls for interest to be charged at a<br />
spread over LIBOR (London InterBank Offering Rate) or the<br />
base rate at <strong>EOG</strong>’s option, and contains substantially the<br />
same covenants as those in <strong>EOG</strong>’s $600 million Long-Term<br />
Revolving Credit Agreement. On March 31, 2004, <strong>EOG</strong><br />
repaid $75 million of the $150 million loan. The remaining<br />
$75 million balance is classified as long-term debt based on<br />
<strong>EOG</strong>’s intent and ability to ultimately replace such amounts<br />
with other long-term debt. The applicable interest rates for<br />
the Facility were 3.17% and 1.88% at December 31, 2004<br />
and December 31, 2003, respectively.<br />
On March 9, 2004, under Rule 144A of the Securities<br />
Act of 1933, as amended, <strong>EOG</strong> <strong>Resources</strong> Canada <strong>Inc</strong>., a<br />
wholly owned subsidiary of <strong>EOG</strong>, issued notes with a total<br />
principal amount of US$150 million, an annual interest rate<br />
of 4.75% and a maturity date of March 15, 2014. The notes<br />
are guaranteed by <strong>EOG</strong>. In conjunction with the offering,<br />
<strong>EOG</strong> entered into a foreign currency swap transaction with<br />
multiple banks for the equivalent amount of the notes and<br />
related interest, which has in effect converted this indebtedness<br />
into CAD$201.3 million with a 5.275% interest rate.<br />
The 6.00% to 6.70% Notes due 2006 to 2028 were<br />
issued through public offerings and have effective interest<br />
rates of 6.16% to 6.81%. The Subsidiary Debt due 2011<br />
bears interest at a fixed rate of 7.00% and is guaranteed<br />
by <strong>EOG</strong>. The weighted average interest rate for the commercial<br />
paper was 1.45% for 2004.<br />
On September 15, 2004, <strong>EOG</strong> repaid in full upon<br />
maturity the $100 million, 6.50% Notes.<br />
At December 31, 2004, the aggregate annual maturities<br />
of long-term debt were $75 million for 2005, $127 million<br />
in 2006, $100 million for 2007, $174 million for 2008<br />
and zero for 2009.<br />
Both <strong>EOG</strong>’s Credit Agreement and Facility contain<br />
certain restrictive covenants, including a maximum debtto-total<br />
capitalization ratio of 65% and a minimum ratio of<br />
EBITDAX (earnings before interest, taxes, DD&A, and<br />
exploration expense) to interest expense of at least three<br />
times. Other than these covenants, <strong>EOG</strong> does not have<br />
any other financial covenants in its financing agreements.<br />
<strong>EOG</strong> continues to comply with these two covenants and<br />
does not view them as materially restrictive.<br />
Shelf Registration. As of February 25, 2005, the<br />
amount available under various filed registration statements<br />
with the SEC for the offer and sale from time to time<br />
of <strong>EOG</strong> debt securities, preferred stock and/or common<br />
stock totaled $688 million.<br />
Fair Value Of Long-Term Debt. At December 31, 2004<br />
and 2003, <strong>EOG</strong> had $1,078 million and $1,109 million,<br />
respectively, of long-term debt, which had fair values of<br />
approximately $1,146 million and $1,175 million, respectively.<br />
The fair value of long-term debt is the value <strong>EOG</strong><br />
would have to pay to retire the debt, including any premium<br />
or discount to the debt-holder for the differential<br />
between the stated interest rate and the year-end market<br />
rate. The fair value of long-term debt is based upon quoted<br />
market prices and, where such quotes were not available,<br />
upon interest rates available to <strong>EOG</strong> at year-end.<br />
3. SHAREHOLDERS’ EQUITY<br />
Common Stock. <strong>EOG</strong> purchases its common stock<br />
from time to time in the open market to be held in treasury<br />
for, among other purposes, fulfilling any obligations arising<br />
under <strong>EOG</strong>’s stock plans and any other approved transactions<br />
or activities for which such common stock shall be<br />
required. In September 2001, the Board of Directors<br />
authorized the purchase of an aggregate maximum of 10<br />
million shares of common stock of <strong>EOG</strong> which superseded<br />
all previous authorizations. At December 31, 2004,<br />
6,386,200 shares remain available for repurchases under<br />
this authorization. On February 2, 2005, <strong>EOG</strong> announced<br />
that the Board of Directors had approved a two-for-one<br />
stock split in the form of a stock dividend, payable to<br />
record holders as of February 15, 2005 and to be issued<br />
on March 1, 2005. In addition, the Board increased the<br />
quarterly cash dividend on the common stock by 33%,<br />
resulting in a quarterly cash dividend of $0.08 per share<br />
pre-split or $0.04 per share post-split.<br />
32 <strong>EOG</strong> RESOURCES, INC.
The following summarizes shares of common stock outstanding at December 31, for each of the years ended<br />
December 31 (in thousands):<br />
Common Shares<br />
Issued Treasury Outstanding<br />
Balance at December 31, 2001 . . . . . . . . . . . . . . . . . . . . . . . . . . . . . . . . . . . . . . . . . 124,730 (9,278) 115,452<br />
Treasury Stock Purchased . . . . . . . . . . . . . . . . . . . . . . . . . . . . . . . . . . . . . . . . . . - (1,703) (1,703)<br />
Treasury Stock Issued Under Stock Option Plans . . . . . . . . . . . . . . . . . . . . . . . . - 870 870<br />
Treasury Stock Issued Under Employee Stock Purchase Plan. . . . . . . . . . . . . . . - 69 69<br />
Restricted Stock and Units. . . . . . . . . . . . . . . . . . . . . . . . . . . . . . . . . . . . . . . . . . - 19 19<br />
Treasury Stock Issued as Compensation . . . . . . . . . . . . . . . . . . . . . . . . . . . . . . . - 13 13<br />
Balance at December 31, 2002 . . . . . . . . . . . . . . . . . . . . . . . . . . . . . . . . . . . . . . . . . 124,730 (10,010) 114,720<br />
Treasury Stock Purchased . . . . . . . . . . . . . . . . . . . . . . . . . . . . . . . . . . . . . . . . . . - (626) (626)<br />
Treasury Stock Issued under Stock Option Plans. . . . . . . . . . . . . . . . . . . . . . . . . - 1,485 1,485<br />
Treasury Stock Issued Under Employee Stock Purchase Plan. . . . . . . . . . . . . . . - 74 74<br />
Restricted Stock and Units. . . . . . . . . . . . . . . . . . . . . . . . . . . . . . . . . . . . . . . . . . - 247 247<br />
Treasury Stock Issued as Compensation . . . . . . . . . . . . . . . . . . . . . . . . . . . . . . . - 10 10<br />
Balance at December 31, 2003 . . . . . . . . . . . . . . . . . . . . . . . . . . . . . . . . . . . . . . . . . 124,730 (8,820) 115,910<br />
Treasury Stock Purchased . . . . . . . . . . . . . . . . . . . . . . . . . . . . . . . . . . . . . . . . . . - (160) (160)<br />
Treasury Stock Issued Under Stock Option Plans . . . . . . . . . . . . . . . . . . . . . . . . - 2,961 2,961<br />
Treasury Stock Issued Under Employee Stock Purchase Plan. . . . . . . . . . . . . . . - 68 68<br />
Restricted Stock and Units. . . . . . . . . . . . . . . . . . . . . . . . . . . . . . . . . . . . . . . . . . - 148 148<br />
Balance at December 31, 2004 . . . . . . . . . . . . . . . . . . . . . . . . . . . . . . . . . . . . . . . . 124,730 (5,803) 118,927<br />
On February 14, 2000, <strong>EOG</strong>’s Board of Directors<br />
declared a dividend of one preferred share purchase right<br />
(a “Right,” and the agreement governing the terms of such<br />
Rights, the “Rights Agreement”) for each outstanding<br />
share of common stock, par value $0.01 per share. The<br />
Board of Directors has adopted this Rights Agreement to<br />
protect stockholders from coercive or otherwise unfair<br />
takeover tactics. The dividend was distributed to the<br />
stockholders of record on February 24, 2000. As mentioned<br />
above, on March 1, 2005, <strong>EOG</strong> will effect a two-forone<br />
stock split in the form of a stock dividend. In accordance<br />
with the Rights Agreement, each share of common<br />
stock issued in connection with the stock split will have<br />
one Right associated with it. Each Right, expiring February<br />
24, 2010, represents a right to buy from <strong>EOG</strong> one hundredth<br />
(1/100) of a share of Series E Junior Participating<br />
Preferred Stock (Preferred Share) for $90, once the Rights<br />
become exercisable. This portion of a Preferred Share will<br />
give the stockholder approximately the same dividend,<br />
voting, and liquidation rights as would one share of common<br />
stock. Prior to exercise, the Right does not give its<br />
holder any dividend, voting, or liquidation rights. If issued,<br />
each one hundredth (1/100) of a Preferred Share: (i) will<br />
not be redeemable; (ii) will entitle holders to quarterly dividend<br />
payments of $0.01 per share, or an amount equal to<br />
the dividend paid on one share of common stock,<br />
whichever is greater; (iii) will entitle holders upon liquida-<br />
tion either to receive $1 per share or an amount equal to<br />
the payment made on one share of common stock,<br />
whichever is greater; (iv) will have the same voting power<br />
as one share of common stock; and (v) if shares of <strong>EOG</strong>’s<br />
common stock are exchanged via merger, consolidation,<br />
or a similar transaction, will entitle holders to a per share<br />
payment equal to the payment made on one share of common<br />
stock.<br />
The Rights will not be exercisable until ten days after<br />
the public announcement that a person or group has<br />
become an acquiring person (Acquiring Person) by obtaining<br />
beneficial ownership of 10% or more of <strong>EOG</strong>’s common<br />
stock, or if earlier, ten business days (or a later date<br />
determined by <strong>EOG</strong>’s Board of Directors before any person<br />
or group becomes an Acquiring Person) after a person<br />
or group begins a tender or exchange offer which, if consummated,<br />
would result in that person or group becoming<br />
an Acquiring Person. On February 24, 2005, the Rights<br />
Agreement was amended to create an exception to the<br />
definition of Acquiring Person to permit a qualified institutional<br />
investor to hold 10% or more but less than 20% of<br />
<strong>EOG</strong>’s common stock without being deemed an Acquiring<br />
Person if the institutional investor meets the following<br />
requirements: (i) the institutional investor is described in<br />
Rule 13d-1(b)(1) promulgated under the Securities<br />
Exchange Act of 1934 and is eligible to report (and, if such<br />
institutional investor is the beneficial owner of greater than<br />
2004 ANNUAL REPORT TO SHAREHOLDERS 33
5% of <strong>EOG</strong>’s common stock, does in fact report) beneficial<br />
ownership of common stock on Schedule 13G; (ii) the<br />
institutional investor is not required to file a Schedule 13D<br />
(or any successor or comparable report) with respect to its<br />
beneficial ownership of <strong>EOG</strong>’s common stock; (iii) the<br />
institutional investor does not beneficially own 15% or<br />
more of <strong>EOG</strong>’s common stock (including in such calculation<br />
the holdings of all of the institutional investor’s affiliates<br />
and associates other than those which, under published<br />
interpretations of the United States Securities and<br />
Exchange Commission or its staff, are eligible to file separate<br />
reports on Schedule 13G with respect to their beneficial<br />
ownership of <strong>EOG</strong>’s common stock); and (iv) the<br />
institutional investor does not beneficially own 20% or<br />
more of <strong>EOG</strong>’s common stock (including in such calculation<br />
the holdings of all of the institutional investor’s affiliates<br />
and associates).<br />
If a person or group becomes an Acquiring Person, all<br />
holders of Rights, except the Acquiring Person, may for<br />
$90, purchase shares of <strong>EOG</strong>’s common stock with a market<br />
value of $180, based on the market price of the common<br />
stock prior to such acquisition. If <strong>EOG</strong> is later<br />
acquired in a merger or similar transaction after the Rights<br />
become exercisable, all holders of Rights except the<br />
Acquiring Person may, for $90, purchase shares of the<br />
acquiring corporation with a market value of $180 based<br />
on the market price of the acquiring corporation’s stock,<br />
prior to such merger.<br />
<strong>EOG</strong>’s Board of Directors may redeem the Rights for<br />
$0.01 per Right at any time before any person or group<br />
becomes an Acquiring Person. If the Board of Directors<br />
redeems any Rights, it must redeem all of the Rights.<br />
Once the Rights are redeemed, the only right of the holders<br />
of Rights will be to receive the redemption price of<br />
$0.01 per Right. The redemption price will be adjusted if<br />
<strong>EOG</strong> has a stock split or stock dividends of <strong>EOG</strong>’s common<br />
stock. After a person or group becomes an Acquiring<br />
Person, but before an Acquiring Person owns 50% or<br />
more of <strong>EOG</strong>’s outstanding common stock, the Board of<br />
Directors may exchange the Rights for common stock or<br />
equivalent security at an exchange ratio of one share of<br />
common stock or an equivalent security for each such<br />
Right, other than Rights held by the Acquiring Person.<br />
Preferred Stock. <strong>EOG</strong> currently has two authorized<br />
series of preferred stock. On February 14, 2000, <strong>EOG</strong>’s<br />
Board of Directors, in connection with the Rights<br />
Agreement described above, authorized 1,500,000 shares<br />
of Series E Junior Participating Preferred Stock with the<br />
rights and preferences described above. On February 24,<br />
2005, <strong>EOG</strong>’s Board of Directors increased the authorized<br />
shares of Series E Junior Participating Preferred Stock to<br />
3,000,000 as a result of the two-for-one stock split mentioned<br />
above. Currently, there are no shares of the Series<br />
E Junior Participating Preferred Stock outstanding.<br />
On July 19, 2000, <strong>EOG</strong>’s Board of Directors authorized<br />
100,000 shares of Fixed Rate Cumulative Perpetual<br />
Senior Preferred Stock, Series B, with a $1,000<br />
Liquidation Preference per share (the “Series B”).<br />
Dividends are payable on the shares only if declared by<br />
<strong>EOG</strong>’s Board of Directors and will be cumulative. If<br />
declared, dividends will be payable at a rate of $71.95 per<br />
share, per year on March 15, June 15, September 15 and<br />
December 15 of each year beginning September 15,<br />
2000. <strong>EOG</strong> may redeem all or part of the Series B at any<br />
time beginning on December 15, 2009 at $1,000 per<br />
share, plus accrued and unpaid dividends. The Series B<br />
is not convertible into, or exchangeable for, common<br />
stock of <strong>EOG</strong>. There are 100,000 shares of the Series B<br />
currently outstanding.<br />
On July 25, 2000, <strong>EOG</strong>’s Board of Directors authorized<br />
500 shares of Flexible Money Market Cumulative<br />
Preferred Stock, Series D, with a liquidation preference of<br />
$100,000 per share (the “Series D”). Dividends were<br />
payable on the shares only if declared by <strong>EOG</strong>’s Board of<br />
Directors and were cumulative. The initial dividend rate on<br />
the shares was 6.84% until December 15, 2004. Through<br />
December 15, 2004, dividends were payable, if declared,<br />
on March 15, June 15, September 15 and December 15 of<br />
each year beginning September 15, 2000. On December<br />
15, 2004, <strong>EOG</strong> redeemed all 500 outstanding shares of the<br />
Series D at a redemption price of $100,000 per share plus<br />
accumulated and unpaid dividends for a total of $50 million.<br />
On February 24, 2005, <strong>EOG</strong> filed a Certificate of<br />
Elimination with the Secretary of State of the State of<br />
Delaware to eliminate the Series D from <strong>EOG</strong>’s Restated<br />
Certificate of <strong>Inc</strong>orporation, as amended.<br />
4. OTHER INCOME (EXPENSE), NET<br />
Other <strong>Inc</strong>ome (Expense), Net for 2004 included income<br />
from equity investments of $11 million, gains on sales of<br />
reserves and related assets of $6 million and foreign currency<br />
transaction losses of $7 million. Other <strong>Inc</strong>ome<br />
(Expense), Net for 2003 included foreign currency transaction<br />
gains of $9 million and income from equity investments<br />
of $4 million. The foreign currency transaction gain and<br />
loss amounts for 2004 and 2003 are results of applying the<br />
changes in the Canadian exchange rate to certain intercompany<br />
short-term loans that eliminate in consolidation.<br />
34 <strong>EOG</strong> RESOURCES, INC.
5. INCOME TAXES<br />
The principal components of <strong>EOG</strong>’s net deferred income tax liability at December 31 were as follows (in thousands):<br />
2004 2003<br />
Current Deferred <strong>Inc</strong>ome Tax Assets<br />
Commodity Hedging Contracts . . . . . . . . . . . . . . . . . . . . . . . . . . . . . . . . . . . . . . . . . . . . . . . . . . $ (7,701) $ 9,739<br />
Deferred Compensation Plans . . . . . . . . . . . . . . . . . . . . . . . . . . . . . . . . . . . . . . . . . . . . . . . . . . . 6,488 4,994<br />
Net Operating Loss Carryforward . . . . . . . . . . . . . . . . . . . . . . . . . . . . . . . . . . . . . . . . . . . . . . . . . - 5,225<br />
United Kingdom Net Operating Loss Carryforward (Current Portion) . . . . . . . . . . . . . . . . . . . . . 10,160 -<br />
Other . . . . . . . . . . . . . . . . . . . . . . . . . . . . . . . . . . . . . . . . . . . . . . . . . . . . . . . . . . . . . . . . . . . . . . . 13,280 11,590<br />
Total Current Deferred <strong>Inc</strong>ome Tax Assets . . . . . . . . . . . . . . . . . . . . . . . . . . . . . . . . . . . . . . 22,227 31,548<br />
Current Deferred <strong>Inc</strong>ome Tax Liabilities<br />
Timing Differences Associated With Different Year-Ends in Foreign<br />
Jurisdictions . . . . . . . . . . . . . . . . . . . . . . . . . . . . . . . . . . . . . . . . . . . . . . . . . . . . . . . . . . . . . . . . 103,903 73,611<br />
Other . . . . . . . . . . . . . . . . . . . . . . . . . . . . . . . . . . . . . . . . . . . . . . . . . . . . . . . . . . . . . . . . . . . . . . . 30 -<br />
Total Current Deferred <strong>Inc</strong>ome Tax Liabilities . . . . . . . . . . . . . . . . . . . . . . . . . . . . . . . . . . . . 103,933 73,611<br />
Total Net Current Deferred <strong>Inc</strong>ome Tax Liabilities. . . . . . . . . . . . . . . . . . . . . . . . . . . . . . . . $ 81,706 $ 42,063<br />
Noncurrent Deferred <strong>Inc</strong>ome Tax Assets (included in Other Assets)<br />
United Kingdom Net Operating Loss Carryforward . . . . . . . . . . . . . . . . . . . . . . . . . . . . . . . . . . . $ 21,764 $ 3,688<br />
United Kingdom Oil and Gas Exploration and Development Costs<br />
Deducted for Tax Over Book Depreciation, Depletion and Amortization. . . . . . . . . . . . . . . . . . (20,465) -<br />
Total Noncurrent Deferred <strong>Inc</strong>ome Tax Assets . . . . . . . . . . . . . . . . . . . . . . . . . . . . . . . . . . $ 1,299 $ 3,688<br />
Noncurrent Deferred <strong>Inc</strong>ome Tax Assets<br />
Non-Producing Leasehold Costs . . . . . . . . . . . . . . . . . . . . . . . . . . . . . . . . . . . . . . . . . . . . . . . . . $ 41,718 $ 36,154<br />
Seismic Costs Capitalized for Tax . . . . . . . . . . . . . . . . . . . . . . . . . . . . . . . . . . . . . . . . . . . . . . . . 25,563 21,365<br />
Alternative Minimum Tax Credit Carryforward . . . . . . . . . . . . . . . . . . . . . . . . . . . . . . . . . . . . . . . - 3,869<br />
Other . . . . . . . . . . . . . . . . . . . . . . . . . . . . . . . . . . . . . . . . . . . . . . . . . . . . . . . . . . . . . . . . . . . . . . . 22,740 20,124<br />
Total Noncurrent Deferred <strong>Inc</strong>ome Tax Assets . . . . . . . . . . . . . . . . . . . . . . . . . . . . . . . . . . . 90,021 81,512<br />
Noncurrent Deferred <strong>Inc</strong>ome Tax Liabilities<br />
Oil and Gas Exploration and Development Costs Deducted for<br />
Tax Over Book Depreciation, Depletion and Amortization . . . . . . . . . . . . . . . . . . . . . . . . . . 974,492 837,189<br />
Capitalized Interest . . . . . . . . . . . . . . . . . . . . . . . . . . . . . . . . . . . . . . . . . . . . . . . . . . . . . . . . . . . . 16,683 13,451<br />
Other . . . . . . . . . . . . . . . . . . . . . . . . . . . . . . . . . . . . . . . . . . . . . . . . . . . . . . . . . . . . . . . . . . . . . . . 1,200 -<br />
Total Noncurrent Deferred <strong>Inc</strong>ome Tax Liabilities . . . . . . . . . . . . . . . . . . . . . . . . . . . . . . . . . 992,375 850,640<br />
Total Net Noncurrent Deferred <strong>Inc</strong>ome Tax Liability . . . . . . . . . . . . . . . . . . . . . . . . . . . . . . $ 902,354 $ 769,128<br />
Total Net Deferred <strong>Inc</strong>ome Tax Liability . . . . . . . . . . . . . . . . . . . . . . . . . . . . . . . . . . . . . . . . . . . . . . . . $ 982,761 $ 807,503<br />
2004 ANNUAL REPORT TO SHAREHOLDERS 35
The components of income before income taxes were<br />
as follows (in thousands):<br />
2004 2003 2002<br />
United States . . . . . . . . . $ 641,973 $442,109 $ 37,354<br />
Foreign . . . . . . . . . . . . . . 284,039 211,767 82,318<br />
Total . . . . . . . . . . . . . . $ 926,012 $653,876 $ 119,672<br />
The principal components of <strong>EOG</strong>’s income tax provision<br />
for the years indicated below were as follows (in<br />
thousands):<br />
2004 2003 2002<br />
Current:<br />
Federal . . . . . . . . . . . . . . $ 58,148 $ 3,844 $ (61,013)<br />
State . . . . . . . . . . . . . . . . 3,137 880 (5,130)<br />
Foreign . . . . . . . . . . . . . . 35,641 20,150 16,463<br />
Total . . . . . . . . . . . . . . . 96,926 24,874 (49,680)<br />
Deferred:<br />
Federal . . . . . . . . . . . . . . 156,862 151,389 57,232<br />
State . . . . . . . . . . . . . . . . 7,985 4,052 (358)<br />
Foreign . . . . . . . . . . . . . . 39,384 36,285 25,305<br />
Total . . . . . . . . . . . . . . . 204,231 191,726 82,179<br />
<strong>Inc</strong>ome Tax Provision . . . . $ 301,157 $ 216,600 $ 32,499<br />
The differences between taxes computed at the<br />
United States federal statutory tax rate and <strong>EOG</strong>’s effective<br />
rate were as follows:<br />
2004 2003 2002<br />
Statutory Federal <strong>Inc</strong>ome<br />
Tax Rate . . . . . . . . . . . . . 35.00% 35.00% 35.00%<br />
State <strong>Inc</strong>ome Tax, Net<br />
of Federal Benefit . . . . . . 0.74 0.73 0.22<br />
<strong>Inc</strong>ome Tax Provision<br />
Related to Foreign<br />
Operations . . . . . . . . . . . (1.83) (0.05) (3.54)<br />
Change in Canadian<br />
Federal Tax Rate. . . . . . . - (2.16) -<br />
Change in Canadian<br />
Provincial Tax Rate . . . . . (0.58) - -<br />
Tight Gas Sands Federal<br />
<strong>Inc</strong>ome Tax Credits. . . . . - - (3.57)<br />
Other . . . . . . . . . . . . . . . . (0.81) (0.40) (0.95)<br />
Effective <strong>Inc</strong>ome<br />
Tax Rate . . . . . . . . . . 32.52% 33.12% 27.16%<br />
On October 22, 2004, the American Jobs Creation Act<br />
of 2004 (the Act) was enacted. The Act creates a temporary<br />
incentive for United States corporations to repatriate<br />
accumulated income earned abroad by providing an 85%<br />
dividends received deduction for certain dividends from<br />
controlled foreign corporations. The deduction is subject<br />
to a number of limitations and, currently, uncertainty<br />
remains as to how to interpret some provisions in the Act.<br />
The Act limits the qualified dividends to the greater of<br />
$500 million or the amount of earnings permanently reinvested<br />
outside the United States, as reported in the 2002<br />
financial statements, which was $550 million. In addition,<br />
a comprehensive analysis of foreign legal and tax ramifications<br />
must be completed before such dividends are<br />
declared. As such, <strong>EOG</strong> is not yet in a position to decide<br />
on whether, and to what extent, it might repatriate foreign<br />
earnings that have not yet been remitted to the United<br />
States. <strong>EOG</strong> expects to be in a position to complete the<br />
assessment by September 30, 2005.<br />
<strong>EOG</strong>’s foreign subsidiaries’ undistributed earnings of<br />
approximately $1 billion at December 31, 2004 are considered<br />
to be indefinitely invested outside the United States<br />
and, accordingly, no United States or state income taxes<br />
have been provided thereon. Upon distribution of those<br />
earnings in the form of dividends, <strong>EOG</strong> may be subject to<br />
both foreign withholding taxes and United States income<br />
taxes, net of allowable foreign tax credits. Determination of<br />
any potential amount of unrecognized deferred income tax<br />
liabilities is not practicable.<br />
<strong>EOG</strong> incurred a tax net operating loss of $191 million<br />
in 2002. During 2003, <strong>EOG</strong> utilized $176 million of the 2002<br />
net operating loss. The remaining net operating loss of $15<br />
million was utilized in 2004.<br />
A foreign net operating loss of $80 million, of which<br />
$55 million was incurred during 2004, will be carried forward<br />
indefinitely until utilized.<br />
<strong>EOG</strong> had an alternative minimum tax (AMT) credit<br />
carry forward from prior years of $6 million which was used<br />
to offset regular income taxes in 2004.<br />
6. EMPLOYEE BENEFIT PLANS<br />
Pension Plans<br />
<strong>EOG</strong> has a non-contributory defined contribution pension<br />
plan and a matched defined contribution savings plan<br />
in place for most of its employees in the United States.<br />
<strong>EOG</strong>’s contributions to these pension plans are based on<br />
various percentages of compensation, and in some<br />
instances, are based upon the amount of the employees’<br />
contributions. For 2004, 2003 and 2002, <strong>EOG</strong>’s total contributions<br />
to these pension plans amounted to $10.6 million,<br />
$8.2 million and $8.0 million, respectively.<br />
In addition, <strong>EOG</strong>’s Canadian subsidiary maintains a<br />
non-contributory defined contribution pension plan and a<br />
matched defined contribution savings plan and <strong>EOG</strong>’s<br />
Trinidadian subsidiary maintains a contributory defined<br />
benefit pension plan and a matched savings plan. These<br />
pension plans are available to most employees of the<br />
Canadian and Trinidadian subsidiaries and <strong>EOG</strong>’s combined<br />
contributions to these pension plans were approximately<br />
$860,000, $630,000 and $460,000 for 2004, 2003<br />
and 2002, respectively.<br />
<strong>EOG</strong>’s United Kingdom subsidiary introduced a pension<br />
plan as of January 2005. The United Kingdom subsidiary<br />
will include a defined non-contributory pension plan<br />
and a matched defined contribution savings plan. The pension<br />
plan will be available to all employees of the United<br />
Kingdom subsidiary.<br />
36 <strong>EOG</strong> RESOURCES, INC.
Postretirement Plan<br />
<strong>EOG</strong> has postretirement medical and dental benefits in place for eligible employees and their eligible dependents.<br />
Benefits are provided under the provisions of a contributory defined dollar benefit plan. <strong>EOG</strong> accrues these postretirement<br />
benefit costs over the service lives of the employees expected to be eligible to receive such benefits. The following table<br />
summarizes <strong>EOG</strong>’s postretirement benefit plan as of December 31 of the years indicated as follows (in thousands):<br />
2004 2003 2002<br />
Change in Benefit Obligation<br />
Benefit Obligation at Beginning of Year . . . . . . . . . . . . . . . . . . . . . . . . . . . . . . . . . . . . . . . $ 3,011 $ 1,875 $ 2,021<br />
Service Cost . . . . . . . . . . . . . . . . . . . . . . . . . . . . . . . . . . . . . . . . . . . . . . . . . . . . . . . . . . 175 175 139<br />
Interest Cost . . . . . . . . . . . . . . . . . . . . . . . . . . . . . . . . . . . . . . . . . . . . . . . . . . . . . . . . . . 136 131 115<br />
Plan Participants’ Contributions . . . . . . . . . . . . . . . . . . . . . . . . . . . . . . . . . . . . . . . . . . . 73 64 58<br />
Amendments. . . . . . . . . . . . . . . . . . . . . . . . . . . . . . . . . . . . . . . . . . . . . . . . . . . . . . . . . . - 773 -<br />
Benefits Paid. . . . . . . . . . . . . . . . . . . . . . . . . . . . . . . . . . . . . . . . . . . . . . . . . . . . . . . . . . (136) (102) (95)<br />
Actuarial (Gain) Loss . . . . . . . . . . . . . . . . . . . . . . . . . . . . . . . . . . . . . . . . . . . . . . . . . . . . (1,276) 95 (363)<br />
Benefit Obligation at Year-End . . . . . . . . . . . . . . . . . . . . . . . . . . . . . . . . . . . . . . . . $ 1,983 $ 3,011 $ 1,875<br />
Change in Plan Asset<br />
Fair Value of Plan Asset at Beginning of Year. . . . . . . . . . . . . . . . . . . . . . . . . . . . . . . . . . . $ - $ - $ -<br />
Employer Contributions . . . . . . . . . . . . . . . . . . . . . . . . . . . . . . . . . . . . . . . . . . . . . . . . . 63 38 37<br />
Plan Participants’ Contributions . . . . . . . . . . . . . . . . . . . . . . . . . . . . . . . . . . . . . . . . . . . 73 64 58<br />
Benefits Paid. . . . . . . . . . . . . . . . . . . . . . . . . . . . . . . . . . . . . . . . . . . . . . . . . . . . . . . . . . (136) (102) (95)<br />
Fair Value of Plan Asset at Year-End . . . . . . . . . . . . . . . . . . . . . . . . . . . . . . . . . . . $ - $ - $ -<br />
Reconciliation of Funded Status to Balance Sheet<br />
Funded Status. . . . . . . . . . . . . . . . . . . . . . . . . . . . . . . . . . . . . . . . . . . . . . . . . . . . . . . . . . . $ 1,983 $ 3,011 $ 1,875<br />
Unrecognized Net Actuarial Gain (Loss) . . . . . . . . . . . . . . . . . . . . . . . . . . . . . . . . . . . . . . . 1,158 (64) 35<br />
Unrecognized Prior Service Cost . . . . . . . . . . . . . . . . . . . . . . . . . . . . . . . . . . . . . . . . . . . . (1,517) (1,647) (948)<br />
Accrued Benefit Cost at Year-End . . . . . . . . . . . . . . . . . . . . . . . . . . . . . . . . . . . . . . . $ 1,624 $ 1,300 $ 962<br />
Components of Net Periodic Benefit Cost<br />
Service Cost . . . . . . . . . . . . . . . . . . . . . . . . . . . . . . . . . . . . . . . . . . . . . . . . . . . . . . . . . . . . $ 175 $ 175 $ 139<br />
Interest Cost . . . . . . . . . . . . . . . . . . . . . . . . . . . . . . . . . . . . . . . . . . . . . . . . . . . . . . . . . . . . 136 131 115<br />
Amortization of Prior Service Cost . . . . . . . . . . . . . . . . . . . . . . . . . . . . . . . . . . . . . . . . . . . 129 75 75<br />
Recognized Net Actuarial Gain . . . . . . . . . . . . . . . . . . . . . . . . . . . . . . . . . . . . . . . . . . . . . . (53) - (1)<br />
Net Periodic Benefit Cost. . . . . . . . . . . . . . . . . . . . . . . . . . . . . . . . . . . . . . . . . . . . . . . $ 387 $ 381 $ 328<br />
Weighted-average discount rate assumptions used in<br />
the determination of benefit obligations at December 31,<br />
2004, 2003 and 2002 were 5.95%, 6.15% and 6.40%,<br />
respectively. Weighted-average discount rate assumptions<br />
used in the determination of net periodic benefit cost for<br />
years ended December 31, 2004, 2003 and 2002 were<br />
6.15%, 6.40% and 7.00%, respectively.<br />
Estimated Future Employer-Paid Benefits. The following<br />
benefits, which reflect expected future service, as<br />
appropriate, are expected to be paid by <strong>EOG</strong> in the next<br />
10 years (in thousands):<br />
Postretirement<br />
Employer-Paid Benefits<br />
2005 . . . . . . . . . . . . . . . . . $ 84<br />
2006 . . . . . . . . . . . . . . . . . 91<br />
2007 . . . . . . . . . . . . . . . . . 96<br />
2008 . . . . . . . . . . . . . . . . . 103<br />
2009 . . . . . . . . . . . . . . . . . 126<br />
2010 - 2014 . . . . . . . . . . . 924<br />
Postretirement health care trend rates have zero<br />
effect on the amounts reported for the postretirement<br />
health care plan for both 2004 and 2003. A one-percentage<br />
point increase or decrease in <strong>EOG</strong>’s healthcare cost<br />
trend rates would have zero impact on the postretirement<br />
benefit obligation, as any increase or decrease in healthcare<br />
costs would be borne by the employee.<br />
Stock Plans<br />
<strong>EOG</strong> has various stock plans (Plans) under which<br />
employees and non-employee members of the Board of<br />
Directors of <strong>EOG</strong> and its subsidiaries have been or may be<br />
granted certain equity compensation. Since the inception<br />
of the Plans, there have been 31,445,000 shares authorized<br />
for grant. At December 31, 2004, 3,708,827 shares<br />
remain available for grant.<br />
Stock Options. Under the Plans, participants have<br />
been or may be granted rights to purchase shares of common<br />
stock of <strong>EOG</strong> at a price not less than the market price<br />
of the stock at the date of grant. Stock options granted<br />
2004 ANNUAL REPORT TO SHAREHOLDERS 37
under the Plans vest either immediately at the date of grant or up to four years from the date of grant based on the nature<br />
of the grants and as defined in individual grant agreements. Terms for stock options granted under the Plans have not<br />
exceeded a maximum term of 10 years.<br />
Beginning in August 2004, <strong>EOG</strong>’s stock options contain a feature that limits the potential gain that can be realized<br />
by requiring vested options to be exercised if the market price reaches 200% of the grant price for five consecutive trading<br />
days.<br />
The following table sets forth the option transactions for the years ended December 31 (options in thousands):<br />
2004 2003 2002<br />
Average Average Average<br />
Grant Grant Grant<br />
Options Price Options Price Options Price<br />
Outstanding at January 1 . . . . . . . . . . . . . . . . . . . . . . . . . . . 7,751 $ 30.38 7,842 $ 27.31 7,013 $ 24.69<br />
Granted . . . . . . . . . . . . . . . . . . . . . . . . . . . . . . . . . . . . . . . . . 1,307 63.94 1,515 39.13 1,809 33.82<br />
Exercised . . . . . . . . . . . . . . . . . . . . . . . . . . . . . . . . . . . . . . . . (2,961) 26.85 (1,485) 22.73 (868) 19.90<br />
Forfeited . . . . . . . . . . . . . . . . . . . . . . . . . . . . . . . . . . . . . . . . (140) 38.57 (121) 34.74 (112) 27.64<br />
Outstanding at December 31 . . . . . . . . . . . . . . . . . . . . . . . . 5,957 39.32 7,751 30.38 7,842 27.31<br />
Options Exercisable at December 31 . . . . . . . . . . . . . . . . . . 3,050 30.37 4,933 27.03 5,041 23.96<br />
Available for Future Grant . . . . . . . . . . . . . . . . . . . . . . . . . . . 3,709 1,178 2,932<br />
<strong>EOG</strong> currently expects to adopt SFAS No. 123(R) effective July 1, 2005 (see Note 1) and as a result, <strong>EOG</strong> expects<br />
the expensing of the stock options would reduce second half 2005 net earnings by a pre-tax amount of approximately<br />
$9.5 million.<br />
The following table summarizes certain information for the options outstanding at December 31, 2004 (options in<br />
thousands):<br />
Options Outstanding<br />
Options Exercisable<br />
Weighted Weighted Weighted<br />
Average Average Average<br />
Remaining Grant Grant<br />
Range of Grant Prices Options Life (Years) Price Options Price<br />
$14.00 to $17.99. . . . . . . . . . . . . . . . . . . . . . . . . . . . . . . . 362 4 $ 14.53 362 $ 14.53<br />
18.00 to 22.99. . . . . . . . . . . . . . . . . . . . . . . . . . . . . . . . 512 4 20.05 512 20.05<br />
23.00 to 28.99. . . . . . . . . . . . . . . . . . . . . . . . . . . . . . . . 44 3 24.97 42 24.85<br />
29.00 to 33.99. . . . . . . . . . . . . . . . . . . . . . . . . . . . . . . . 1,627 7 33.32 1,067 33.14<br />
34.00 to 39.99. . . . . . . . . . . . . . . . . . . . . . . . . . . . . . . . 1,905 8 37.47 882 36.75<br />
40.00 to 54.99. . . . . . . . . . . . . . . . . . . . . . . . . . . . . . . . 292 8 45.60 177 44.03<br />
55.00 to 73.99. . . . . . . . . . . . . . . . . . . . . . . . . . . . . . . . 1,215 10 64.78 8 61.22<br />
5,957 7 39.32 3,050 30.37<br />
38 <strong>EOG</strong> RESOURCES, INC.
During 2004, 2003 and 2002, <strong>EOG</strong> repurchased<br />
approximately 160,000, 626,000 and 1,703,000 of its common<br />
shares, respectively. The difference between the cost<br />
of the treasury shares and the exercise price of the<br />
options, net of federal income tax benefit of $29.4 million,<br />
$11.9 million and $5.2 million, for the years 2004, 2003<br />
and 2002, respectively, is reflected as an adjustment to<br />
additional paid in capital to the extent <strong>EOG</strong> has accumulated<br />
additional paid in capital relating to treasury stock<br />
and to retained earnings thereafter.<br />
Restricted Stock and Units. Under the Plans, employees<br />
may be granted restricted stock and/or units without<br />
cost to them. The shares and units granted vest to the<br />
employee at various times ranging from one to five years<br />
from the date of grant based on the nature of the grants<br />
and as defined in individual grant agreements. Upon vesting,<br />
restricted shares are released to the employee. Upon<br />
vesting, restricted units are converted into one share of<br />
common stock and released to the employee. The following<br />
summarizes shares of restricted stock and units granted<br />
for the three years ended December 31 (shares and<br />
units in thousands):<br />
Restricted Shares and Units<br />
2004 2003 2002<br />
Outstanding at January 1 . . . . . . 1,026 775 632<br />
Granted . . . . . . . . . . . . . . . . . . . . 330 372 158<br />
Released . . . . . . . . . . . . . . . . . . . (41) (103) (10)<br />
Forfeited or Expired . . . . . . . . . . . (32) (18) (5)<br />
Outstanding at December 31 . . . 1,283 1,026 775<br />
Average Fair Value of Shares<br />
Granted During Year . . . . . . . . $ 51.43 $ 40.43 $ 32.56<br />
The fair value of the restricted shares and units at date<br />
of grant has been recorded in shareholders’ equity as<br />
unearned compensation and is being amortized over the<br />
vesting period as compensation expense. Related compensation<br />
expense for 2004, 2003 and 2002 was $9.6 million,<br />
$6.0 million and $4.9 million, respectively.<br />
Employee Stock Purchase Plan. <strong>EOG</strong> has an Employee<br />
Stock Purchase Plan (ESPP) in place that allows eligible<br />
employees to semi-annually purchase, through payroll<br />
deductions, shares of <strong>EOG</strong> common stock at 85 percent<br />
of the fair market value at specified dates. Contributions to<br />
the ESPP are limited to 10 percent of the employees’ pay<br />
(subject to certain ESPP limits) during each of the two sixmonth<br />
offering periods. As of December 31, 2004, approximately<br />
256,600 common shares remained available for<br />
issuance under the plan. <strong>EOG</strong> currently expects to adopt<br />
SFAS No. 123(R) effective July 1, 2005 (see Note 1) and as<br />
a result, <strong>EOG</strong> expects the expense associated with the<br />
ESPP would reduce second half 2005 net earnings by a<br />
pre-tax amount of approximately $0.5 million.<br />
The following table summarizes ESPP activities for<br />
the years ended December 31 (in thousands, except number<br />
of participants):<br />
2004 2003 2002<br />
Approximate Number<br />
of Participants . . . . . . . . . . . . . 450 410 350<br />
Shares Purchased . . . . . . . . . . . . 68 74 69<br />
Aggregate Purchase Price . . . . . . $ 3,021 $2,599 $ 2,261<br />
7. COMMITMENTS AND CONTINGENCIES<br />
Letters Of Credit. At December 31, 2004 and 2003,<br />
<strong>EOG</strong> had standby letters of credit and guarantees outstanding<br />
totaling approximately $433 million and $266<br />
million, respectively. Of these amounts, $370 million and<br />
$220 million, respectively, represent guarantees of subsidiary<br />
indebtedness included under Note 2 “Long-Term<br />
Debt” while $63 million and $46 million, respectively, primarily<br />
represent guarantees of payment obligations on<br />
behalf of subsidiaries. As of February 25, 2005, there were<br />
no demands for payment under these guarantees.<br />
Minimum Commitments. At December 31, 2004, total<br />
minimum commitments from long-term non-cancelable<br />
operating leases, drilling rig commitments, seismic purchase<br />
and other purchase obligations, and pipeline transportation<br />
service commitments, based on current transportation<br />
rates and the foreign currency exchange rates at<br />
December 31, 2004, are as follows (in thousands):<br />
Total Minimum<br />
Commitments<br />
2005 . . . . . . . . . . . . . . . . . . . . . . . . . . . . . . . . . . . . . $ 45,868<br />
2006 - 2008 . . . . . . . . . . . . . . . . . . . . . . . . . . . . . . . 72,814<br />
2009 - 2010 . . . . . . . . . . . . . . . . . . . . . . . . . . . . . . . 24,733<br />
2011 and Beyond. . . . . . . . . . . . . . . . . . . . . . . . . . . 44,388<br />
$187,803<br />
<strong>Inc</strong>luded in the table above are leases for buildings,<br />
facilities and equipment with varying expiration dates<br />
through 2015. Rental expenses associated with these<br />
leases amounted to $26 million, $22 million and $21 million<br />
for 2004, 2003 and 2002, respectively.<br />
Contingencies. There are various suits and claims<br />
against <strong>EOG</strong> that have arisen in the ordinary course of<br />
business. Management believes that the chance that<br />
these suits and claims will individually or in the aggregate<br />
have a material adverse effect on the financial condition or<br />
results of operations of <strong>EOG</strong> is remote. When necessary,<br />
<strong>EOG</strong> has made accruals in accordance with SFAS No. 5 -<br />
“Accounting for Contingencies,” in order to provide for<br />
these matters.<br />
2004 ANNUAL REPORT TO SHAREHOLDERS 39
8. NET INCOME PER SHARE AVAILABLE TO COMMON<br />
The following table sets forth the computation of Net <strong>Inc</strong>ome Per Share Available to Common for the years ended<br />
December 31 (in thousands, except per share amounts):<br />
2004 2003 2002<br />
Numerator for basic and diluted earnings per share -<br />
Net income available to common . . . . . . . . . . . . . . . . . . . . . . . . . . . . . . . . . . . . . $ 613,963 $ 419,113 $ 76,141<br />
Denominator for basic earnings per share -<br />
Weighted average shares . . . . . . . . . . . . . . . . . . . . . . . . . . . . . . . . . . . . . . . . . . . 116,876 114,597 115,335<br />
Potential dilutive common shares -<br />
Stock options . . . . . . . . . . . . . . . . . . . . . . . . . . . . . . . . . . . . . . . . . . . . . . . . . . . . 1,780 1,584 1,633<br />
Restricted stock and units . . . . . . . . . . . . . . . . . . . . . . . . . . . . . . . . . . . . . . . . . . 532 338 277<br />
Denominator for diluted earnings per share -<br />
Adjusted weighted average shares. . . . . . . . . . . . . . . . . . . . . . . . . . . . . . . . . . . . 119,188 116,519 117,245<br />
Net <strong>Inc</strong>ome Per Share Available to Common<br />
Basic. . . . . . . . . . . . . . . . . . . . . . . . . . . . . . . . . . . . . . . . . . . . . . . . . . . . . . . . . . . $ 5.25 $ 3.66 $ 0.66<br />
Diluted. . . . . . . . . . . . . . . . . . . . . . . . . . . . . . . . . . . . . . . . . . . . . . . . . . . . . . . . . . $ 5.15 $ 3.60 $ 0.65<br />
9. SUPPLEMENTAL CASH FLOW INFORMATION<br />
Cash<br />
Cash<br />
paid<br />
paid<br />
for<br />
for<br />
interest<br />
interest<br />
and<br />
and<br />
income<br />
income<br />
taxes<br />
taxes<br />
was<br />
was<br />
as<br />
as<br />
follows<br />
follows<br />
for<br />
for<br />
the<br />
the<br />
years<br />
years<br />
ended<br />
ended<br />
December<br />
December<br />
31<br />
31<br />
(in<br />
(in<br />
thousands):<br />
thousands):<br />
2004 2003 2002<br />
Interest . . . . . . . . . . . . . . . . . . . . $ 60,967 $ 62,472 $ 54,432<br />
<strong>Inc</strong>ome taxes . . . . . . . . . . . . . . . . 56,654 26,330 15,946<br />
10. BUSINESS SEGMENT INFORMATION<br />
<strong>EOG</strong>’s operations are all natural gas and crude oil<br />
exploration and production related. SFAS No. 131 -<br />
“Disclosures about Segments of an Enterprise and<br />
Related Information,” establishes standards for reporting<br />
information about operating segments in annual financial<br />
statements and requires selected information about oper-<br />
ating segments in interim financial reports. Operating segments<br />
are defined as components of an enterprise about<br />
which separate financial information is available and evaluated<br />
regularly by the chief operating decision maker, or<br />
decision making group, in deciding how to allocate<br />
resources and in assessing performance. <strong>EOG</strong>’s chief<br />
operating decision making process is informal and<br />
involves the Chairman and Chief Executive Officer and<br />
other key officers. This group routinely reviews and makes<br />
operating decisions related to significant issues associated<br />
with each of <strong>EOG</strong>’s major producing areas in the United<br />
States and each significant international location. For segment<br />
reporting purposes, the major United States producing<br />
areas have been aggregated as one reportable segment<br />
due to similarities in their operations as allowed by<br />
SFAS No. 131.<br />
40 <strong>EOG</strong> RESOURCES, INC.
Financial information by reportable segment is presented below for the years ended December 31, or at<br />
December 31 (in thousands):<br />
United<br />
United<br />
States Canada Trinidad Kingdom Other Total<br />
2004<br />
Net Operating Revenues . . . . . . . . . . . . . . . . . $ 1,656,325 )(1) $ 448,562 )(1) $ 153,377 $ 12,961 $ - $ 2,271,225 )(1)<br />
Depreciation, Depletion and Amortization . . . . 382,718 99,879 20,022 1,784 - 504,403<br />
Operating <strong>Inc</strong>ome (Loss) . . . . . . . . . . . . . . . . . 682,619 222,155 91,245 (16,824) - 979,195<br />
Interest <strong>Inc</strong>ome. . . . . . . . . . . . . . . . . . . . . . . . . 292 679 659 - - 1,630<br />
Other <strong>Inc</strong>ome (Expense) . . . . . . . . . . . . . . . . . . 1,072 (4,487) 10,892 838 - 8,315<br />
Interest Expense, Net . . . . . . . . . . . . . . . . . . . . 41,571 21,415 - 142 - 63,128<br />
<strong>Inc</strong>ome (Loss) Before <strong>Inc</strong>ome Taxes. . . . . . . . . 642,412 196,932 102,796 (16,128) - 926,012<br />
<strong>Inc</strong>ome Tax Provision (Benefit) . . . . . . . . . . . . . 231,250 45,785 31,414 (7,292) - 301,157<br />
Additions to Oil and Gas Properties. . . . . . . . . 936,463 294,571 59,205 34,303 - 1,324,542<br />
Total Assets . . . . . . . . . . . . . . . . . . . . . . . . . . . 3,727,231 1,600,486 401,434 69,772 - 5,798,923<br />
2003<br />
Net Operating Revenues . . . . . . . . . . . . . . . . . $ 1,335,145 )(2) $ 309,418 )(2) $ 100,112 $ - $ - $ 1,744,675 )(2)<br />
Depreciation, Depletion and Amortization . . . . 359,439 66,334 16,070 - - 441,843<br />
Operating <strong>Inc</strong>ome (Loss) . . . . . . . . . . . . . . . . . 487,133 163,783 55,433 (9,195) 160 697,314<br />
Interest <strong>Inc</strong>ome. . . . . . . . . . . . . . . . . . . . . . . . . 1,385 950 454 - - 2,789<br />
Other <strong>Inc</strong>ome (Expense) . . . . . . . . . . . . . . . . . . 2,777 6,354 3,418 (71) 6 12,484<br />
Interest Expense, Net . . . . . . . . . . . . . . . . . . . . 43,421 14,618 670 - 2 58,711<br />
<strong>Inc</strong>ome (Loss) Before <strong>Inc</strong>ome Taxes. . . . . . . . . 447,874 156,469 58,635 (9,266) 164 653,876<br />
<strong>Inc</strong>ome Tax Provision (Benefit) . . . . . . . . . . . . . 163,359 36,190 20,671 (3,486) (134) 216,600<br />
Additions to Oil and Gas Properties. . . . . . . . . 605,667 552,164 31,942 14,610 - 1,204,383<br />
Total Assets . . . . . . . . . . . . . . . . . . . . . . . . . . . 3,119,474 1,302,753 309,727 17,061 - 4,749,015<br />
2002<br />
Net Operating Revenues . . . . . . . . . . . . . . . . . $ 846,007 )(3) $ 169,106 )(3) $ 79,551 $ - $ 18 $ 1,094,682 )(3)<br />
Depreciation, Depletion and Amortization . . . . 334,318 49,622 14,085 - 11 398,036<br />
Operating <strong>Inc</strong>ome (Loss) . . . . . . . . . . . . . . . . . 93,600 40,587 49,450 (250) (2,410) 180,977<br />
Interest <strong>Inc</strong>ome. . . . . . . . . . . . . . . . . . . . . . . . . 765 229 348 - - 1,342<br />
Other <strong>Inc</strong>ome (Expense) . . . . . . . . . . . . . . . . . . (3,652) 261 394 - 4 (2,993)<br />
Interest Expense, Net . . . . . . . . . . . . . . . . . . . . 45,907 13,534 211 - 2 59,654<br />
<strong>Inc</strong>ome (Loss) Before <strong>Inc</strong>ome Taxes. . . . . . . . . 44,806 27,543 49,981 (250) (2,408) 119,672<br />
<strong>Inc</strong>ome Tax Provision (Benefit) . . . . . . . . . . . . . (7,684) 20,359 20,974 300 (1,450) 32,499<br />
Additions to Oil and Gas Properties. . . . . . . . . 517,598 160,840 35,689 - - 714,127<br />
Total Assets . . . . . . . . . . . . . . . . . . . . . . . . . . . 2,864,862 665,202 283,395 66 43 3,813,568<br />
(1) <strong>EOG</strong> had sales activity with a single significant purchaser in the United States and Canada segments in 2004 that totaled $280 million of consolidated Net<br />
Operating Revenues.<br />
(2) <strong>EOG</strong> had sales activity with two significant purchasers, one totaled $222 million and the other totaled $182 million, of consolidated Net Operating Revenues<br />
in the United States and Canada segments in 2003.<br />
(3) <strong>EOG</strong> had sales activity with a single significant purchaser in the United States and Canada segments in 2002 that totaled $163 million of the consolidated<br />
Net Operating Revenues.<br />
2004 ANNUAL REPORT TO SHAREHOLDERS 41
11. PRICE, INTEREST RATE AND CREDIT RISK<br />
MANAGEMENT ACTIVITIES<br />
Price and Interest Rate Risks. <strong>EOG</strong> engages in price<br />
risk management activities from time to time. These activities<br />
are intended to manage <strong>EOG</strong>’s exposure to fluctuations<br />
in commodity prices for natural gas and crude oil.<br />
<strong>EOG</strong> utilizes derivative financial instruments, primarily<br />
price swaps and collars, as the means to manage this<br />
price risk. In addition to these financial transactions, <strong>EOG</strong><br />
is a party to various physical commodity contracts for the<br />
sale of hydrocarbons that cover varying periods of time<br />
and have varying pricing provisions. Under SFAS No.<br />
133 – “Accounting for Derivative Instruments and Hedging<br />
Activities,” as amended by SFAS Nos. 137, 138 and 149,<br />
these various physical commodity contracts qualify for the<br />
normal purchases and normal sales exception and therefore,<br />
are not subject to hedge accounting or mark-to-market<br />
accounting. The financial impact of these various<br />
physical commodity contracts is included in revenues at<br />
the time of settlement, which in turn affects average realized<br />
hydrocarbon prices.<br />
During 2004, 2003 and 2002, <strong>EOG</strong> elected not to designate<br />
any of its derivative financial contracts as accounting<br />
hedges and accordingly, accounted for these derivative<br />
financial contracts using mark-to-market accounting.<br />
During 2004, <strong>EOG</strong> recognized losses on mark-to-market<br />
commodity derivative contracts of $33 million, which<br />
included realized losses of $82 million and collar premium<br />
payments of $1 million. During 2003, <strong>EOG</strong> recognized<br />
losses on mark-to-market commodity derivative contracts<br />
of $80 million, which included realized losses of $45 million<br />
and collar premium payments of $3 million. During<br />
2002, <strong>EOG</strong> recognized losses on mark-to-market commodity<br />
derivative contracts of $49 million, which included<br />
realized losses of $21 million and a $2 million collar premium<br />
payment.<br />
Presented below is a summary of <strong>EOG</strong>’s 2005 natural<br />
gas financial collar contracts at December 31, 2004. As<br />
indicated, <strong>EOG</strong> does not have any financial collar or swap<br />
contracts that cover periods beyond March 2005.<br />
Moreover, <strong>EOG</strong> has not entered into any additional natural<br />
gas financial collar contracts or natural gas or crude oil<br />
financial price swap contracts since December 31, 2004.<br />
<strong>EOG</strong> accounts for these collar contracts using mark-tomarket<br />
accounting. The total fair value of the natural gas<br />
financial collar contracts at December 31, 2004 was $11<br />
million.<br />
Natural Gas Financial Collar Contracts<br />
Floor Price<br />
Ceiling Price<br />
Floor Weighted Ceiling Weighted<br />
Volume Range Average Range Average<br />
2005 (MMBtud) ($/MMBtu) ($/MMBtu) ($/MMBtu) ($/MMBtu)<br />
Jan (1) 75,000 $7.65 - 8.00 $7.77 $8.90 - 9.50 $9.10<br />
Feb (2) 75,000 7.65 - 8.00 7.77 9.19 - 9.50 9.32<br />
Mar (2) 75,000 7.65 - 8.00 7.77 9.19 - 9.50 9.32<br />
(1) Notional volumes of 25,000 MMBtud of the January 2005 collar contracts<br />
were purchased at a premium of $0.10 per MMBtu.<br />
(2) The collar contracts for February 2005 and March 2005 were purchased<br />
at a premium of $0.10 per MMBtu.<br />
The following table summarizes the estimated fair<br />
value of financial instruments and related transactions at<br />
December 31 of the years indicated as follows (in millions):<br />
2004 2003<br />
Estimated<br />
Estimated<br />
Carrying Fair Carrying Fair<br />
Amount Value (1) Amount Value (1)<br />
Long-Term Debt (2) . . $1,078 $1,146 $1,109 $1,175<br />
NYMEX-Related<br />
Commodity Market<br />
Positions . . . . . . . . 11 11 (38) (38)<br />
(1) Estimated fair values have been determined by using available market<br />
data and valuation methodologies. Judgment is required in interpreting<br />
market data and the use of different market assumptions or estimation<br />
methodologies may affect the estimated fair value amounts.<br />
(2) See Note 2.<br />
42 <strong>EOG</strong> RESOURCES, INC.
Credit Risk. While notional contract amounts are used<br />
to express the magnitude of commodity price and interest<br />
rate swap agreements, the amounts potentially subject to<br />
credit risk, in the event of nonperformance by the other<br />
parties, are substantially smaller. <strong>EOG</strong> evaluates its exposure<br />
to all counterparties on an ongoing basis, including<br />
those arising from physical and financial transactions. In<br />
some instances, <strong>EOG</strong> requires collateral, parent guarantees<br />
or letters of credit to minimize credit risk. At<br />
December 31, 2004, <strong>EOG</strong>’s net accounts receivable balance<br />
related to United States and Canada hydrocarbon<br />
sales included two receivable balances, each of which<br />
constituted 11% of the total balance. These receivables<br />
were due from two integrated oil and gas companies. The<br />
related amounts were collected during early 2005. The<br />
amounts due from an integrated oil and gas company and<br />
a utility company at December 31, 2003, which approximated<br />
14% and 11%, respectively, of the United States<br />
and Canada net accounts receivable balance, were collected<br />
during early 2004. No other individual purchaser<br />
accounted for 10% or more of the United States and<br />
Canada net accounts receivable balance at December 31,<br />
2004 and 2003. At December 31, 2004, <strong>EOG</strong> had an<br />
allowance for doubtful accounts of $21 million, of which<br />
$19 million is associated with the Enron bankruptcies<br />
recorded in December 2001.<br />
Substantially all of <strong>EOG</strong>’s accounts receivable at<br />
December 31, 2004 and 2003 result from hydrocarbon<br />
sales and/or joint interest billings to third party companies<br />
including foreign state-owned entities in the oil and gas<br />
industry. This concentration of customers and joint interest<br />
owners may impact <strong>EOG</strong>’s overall credit risk, either<br />
positively or negatively, in that these entities may be similarly<br />
affected by changes in economic or other conditions.<br />
In determining whether or not to require collateral or other<br />
credit enhancements from a customer or joint interest<br />
owner, <strong>EOG</strong> analyzes the entity’s net worth, cash flows,<br />
earnings, and credit ratings. Receivables are generally not<br />
collateralized. During the three-year period ended<br />
December 31, 2004, credit losses incurred on receivables<br />
by <strong>EOG</strong> have been immaterial.<br />
12. ACCOUNTING FOR CERTAIN LONG-LIVED<br />
ASSETS<br />
<strong>EOG</strong> reviews its oil and gas properties for impairment<br />
purposes by comparing the expected undiscounted future<br />
cash flows at a producing field level to the unamortized<br />
capitalized cost of the asset. During 2004, 2003 and 2002,<br />
such reviews indicated that unamortized capitalized costs<br />
of certain properties were higher than their expected<br />
undiscounted future cash flows due primarily to downward<br />
reserve revisions for certain producing fields. As a result,<br />
during 2004, 2003 and 2002, <strong>EOG</strong> recorded in<br />
Impairments pre-tax charges of $17 million, $21 million<br />
and $30 million, respectively, in the United States operating<br />
segment and $8 million, $4 million and $0, respectively,<br />
in the Canada operating segment. The carrying values<br />
for assets determined to be impaired were adjusted to<br />
estimated fair values based on projected future net cash<br />
flows discounted using <strong>EOG</strong>’s risk-adjusted discount rate.<br />
Amortization expenses of acquisition costs of unproved<br />
properties, including amortization of capitalized interest,<br />
were $57 million, $64 million and $38 million for 2004,<br />
2003 and 2002, respectively.<br />
13. ACCOUNTING FOR ASSET RETIREMENT<br />
OBLIGATIONS<br />
<strong>EOG</strong> adopted SFAS No. 143 – “Accounting for Asset<br />
Retirement Obligations” on January 1, 2003. The adoption<br />
of the statement resulted in an after-tax charge of $7.1 million,<br />
which was reported in the first quarter of 2003 as<br />
Cumulative Effect of Change in Accounting Principle. The<br />
following table presents the reconciliation of the beginning<br />
and ending aggregate carrying amount of short-term and<br />
long-term legal obligations associated with the retirement<br />
of oil and gas properties pursuant to SFAS No. 143 for<br />
2004 (in thousands):<br />
Asset Retirement Obligations<br />
Short-Term Long-Term Total<br />
Balance at<br />
December 31, 2003 . . . . $5,320 $118,624 $123,944<br />
Liabilities <strong>Inc</strong>urred. . . . . . . . 2,060 14,728 16,788<br />
Liabilities Settled . . . . . . . . (4,831) (5,422) (10,253)<br />
Accretion . . . . . . . . . . . . . . 164 5,423 5,587<br />
Revision . . . . . . . . . . . . . . . 1,333 744 2,077<br />
Reclassification. . . . . . . . . . 2,894 (2,894) -<br />
Foreign Currency<br />
Translation . . . . . . . . . . . 30 586 616<br />
Balance at<br />
December 31, 2004 . . . . $6,970 $131,789 $138,759<br />
Pro forma net income and earnings per share are not<br />
presented for the comparable period in 2002 because the<br />
pro forma application of SFAS No. 143 to the prior period<br />
would not result in pro forma net income and earnings per<br />
share materially different from the actual amounts reported<br />
for the period in the accompanying Consolidated<br />
Statements of <strong>Inc</strong>ome.<br />
2004 ANNUAL REPORT TO SHAREHOLDERS 43
14. INVESTMENT IN CARIBBEAN NITROGEN<br />
COMPANY LIMITED AND NITROGEN (2000)<br />
UNLIMITED<br />
<strong>EOG</strong>, through certain wholly owned subsidiaries,<br />
owns equity interests in two Trinidadian companies:<br />
CNCL and N2000. During the first quarters of 2003 and<br />
2004, <strong>EOG</strong> completed separate share sale agreements<br />
whereby a portion of the <strong>EOG</strong> subsidiaries’ shareholdings<br />
in CNCL and N2000 was sold to a third party energy<br />
company. The sales left <strong>EOG</strong> with equity interests of<br />
12% in CNCL and 23% in N2000 and did not result in<br />
any gain or loss.<br />
In February 2005, a portion of <strong>EOG</strong>’s shareholdings<br />
in N2000 was sold to a subsidiary of one of the other<br />
shareholders. The sale resulted in a pre-tax gain of<br />
approximately $2 million. <strong>EOG</strong>’s equity interest in N2000<br />
is now 10%.<br />
The other shareholders in CNCL are Ferrostaal AG,<br />
Clico Energy Company Limited, KBRDC CNC (Cayman)<br />
Ltd. and Koch CNC (Nevis) LLC. At December 31, 2004,<br />
investment in CNCL was $15 million. CNCL commenced<br />
production in June 2002, and at December 31, 2004, was<br />
producing approximately 1,850 metric tons of ammonia<br />
daily. At December 31, 2004, CNCL had a long-term debt<br />
balance of $203 million, which is non-recourse to CNCL’s<br />
shareholders. <strong>EOG</strong> will be liable for its share of any postcompletion<br />
deficiency funds, loans to fund the costs of<br />
operation, payment of principal and interest to the principal<br />
creditor and other cash deficiencies of CNCL up to $30<br />
million, approximately $4 million of which is net to <strong>EOG</strong>’s<br />
interest. The Shareholders’ Agreement requires the consent<br />
of the holders of 90% or more of the shares to take<br />
certain material actions. Accordingly, given its current<br />
level of equity ownership, <strong>EOG</strong> is able to exercise significant<br />
influence over the operating and financial policies of<br />
CNCL and therefore, it accounts for the investment using<br />
the equity method. During 2004, <strong>EOG</strong> recognized equity<br />
income of $5 million and received cash dividends of<br />
$5 million from CNCL.<br />
The other shareholders in N2000 are FS Petrochemicals<br />
(St. Kitts) Limited, CE Limited, KBRDC Nitrogen<br />
2000 (St. Lucia) Ltd. and Koch N2000 (Nevis) LLC. At<br />
December 31, 2004, investment in N2000 was $26 million.<br />
N2000 commenced production in August 2004, and at<br />
December 31, 2004, was producing approximately 1,950<br />
metric tons of ammonia daily. At December 31, 2004,<br />
N2000 had a long-term debt balance of $228 million,<br />
which is non-recourse to N2000’s shareholders. At<br />
December 31, 2004, <strong>EOG</strong> was liable for its share of any<br />
post-completion deficiency funds, loans to fund the costs<br />
of operation, payment of principal and interest to the principal<br />
creditor and other cash deficiencies of N2000 up to<br />
$30 million, approximately $7 million of which is net to<br />
<strong>EOG</strong>’s interest. The Shareholders’ Agreement requires the<br />
consent of the holders of 100% of the shares to take certain<br />
material actions. Accordingly, given its current level of<br />
equity ownership, <strong>EOG</strong> is able to exercise significant influence<br />
over the operating and financial policies of N2000<br />
and therefore, it accounts for the investment using the<br />
equity method. During 2004, <strong>EOG</strong> recognized equity<br />
income of $6 million.<br />
15. PROPERTY ACQUISITIONS<br />
On October 1, 2003, a Canadian subsidiary of <strong>EOG</strong><br />
closed an asset purchase of natural gas properties in the<br />
Wintering Hills, Drumheller East and Twining areas of southeast<br />
Alberta from a subsidiary of Husky Energy <strong>Inc</strong>. for<br />
approximately US$320 million. These properties are essentially<br />
adjacent to existing <strong>EOG</strong> operations or are properties<br />
in which <strong>EOG</strong> already had a working interest. The transaction<br />
was partially funded by commercial paper borrowings<br />
of US$140.5 million on October 1, 2003. The remainder of<br />
the purchase price, US$179.5 million, was funded by <strong>EOG</strong>’s<br />
available cash balance. Subsequent to the closing, the purchase<br />
price was reduced by exercised preferential rights on<br />
the properties which totaled approximately US$5 million. In<br />
late December 2003, a Canadian subsidiary of <strong>EOG</strong> closed<br />
another property acquisition for US$46 million.<br />
44 <strong>EOG</strong> RESOURCES, INC.
SUPPLEMENTAL INFORMATION TO CONSOLIDATED FINANCIAL STATEMENTS<br />
(In Thousands Except Per Share Amounts Unless Otherwise Indicated)<br />
(Unaudited Except for Results of Operations for Oil and Gas Producing Activities)<br />
OIL AND GAS PRODUCING ACTIVITIES<br />
The following disclosures are made in accordance<br />
with SFAS No. 69 - “Disclosures about Oil and Gas<br />
Producing Activities”:<br />
Oil and Gas Reserves. Users of this information should<br />
be aware that the process of estimating quantities of<br />
“proved,” “proved developed” and “proved undeveloped”<br />
crude oil and natural gas reserves is very complex, requiring<br />
significant subjective decisions in the evaluation of all<br />
available geological, engineering and economic data for<br />
each reservoir. The data for a given reservoir may also<br />
change substantially over time as a result of numerous<br />
factors including, but not limited to, additional development<br />
activity, evolving production history, and continual<br />
reassessment of the viability of production under varying<br />
economic conditions. Consequently, material revisions<br />
(upward or downward) to existing reserve estimates may<br />
occur from time to time. Although every reasonable effort<br />
is made to ensure that reserve estimates reported represent<br />
the most accurate assessments possible, the significance<br />
of the subjective decisions required and variances<br />
in available data for various reservoirs make these estimates<br />
generally less precise than other estimates presented<br />
in connection with financial statement disclosures.<br />
Proved reserves represent estimated quantities of<br />
natural gas, crude oil, condensate, and natural gas liquids<br />
that geological and engineering data demonstrate, with<br />
reasonable certainty, to be recoverable in future years<br />
from known reservoirs under economic and operating<br />
conditions existing at the time the estimates were made.<br />
Proved developed reserves are proved reserves<br />
expected to be recovered, through wells and equipment in<br />
place and under operating methods being utilized at the<br />
time the estimates were made.<br />
Proved undeveloped reserves are reserves that are<br />
expected to be recovered from new wells on undrilled<br />
acreage, or from existing wells where a relatively major<br />
expenditure is required for completion. Reserves on<br />
undrilled acreage are limited to those drilling units offsetting<br />
productive units that are reasonably certain of production<br />
when drilled. Proved reserves for other undrilled<br />
units can be claimed only where it can be demonstrated<br />
with certainty that there is continuity of production from<br />
the existing productive formation. Estimates for proved<br />
undeveloped reserves are not attributed to any acreage for<br />
which an application of fluid injection or other improved<br />
recovery technique is contemplated, unless such techniques<br />
have been proved effective by actual tests in the<br />
area and in the same reservoir.<br />
Canadian provincial royalties are determined based<br />
on a graduated percentage scale which varies with prices<br />
and production volumes. Canadian reserves, as presented<br />
on a net basis, assume prices and royalty rates in existence<br />
at the time the estimates were made, and <strong>EOG</strong>’s<br />
estimate of future production volumes. Future fluctuations<br />
in prices, production rates, or changes in political or regulatory<br />
environments could cause <strong>EOG</strong>’s share of future<br />
production from Canadian reserves to be materially different<br />
from that presented.<br />
Estimates of proved and proved developed reserves<br />
at December 31, 2004, 2003 and 2002 were based on<br />
studies performed by the engineering staff of <strong>EOG</strong> for all<br />
reserves. Opinions by DeGolyer and MacNaughton (D&M),<br />
independent petroleum consultants, for the years ended<br />
December 31, 2004, 2003 and 2002 covered producing<br />
areas containing 77%, 72% and 73%, respectively, of<br />
proved reserves of <strong>EOG</strong> on a net-equivalent-cubic-feetof-gas<br />
basis. D&M’s opinions indicate that the estimates<br />
of proved reserves prepared by <strong>EOG</strong>’s engineering staff<br />
for the properties reviewed by D&M, when compared in<br />
total on a net-equivalent-cubic-feet-of-gas basis, do not<br />
differ materially from the estimates prepared by D&M.<br />
Such estimates by D&M in the aggregate varied by not<br />
more than 5% from those prepared by the engineering<br />
staff of <strong>EOG</strong>. All reports by D&M were developed utilizing<br />
geological and engineering data provided by <strong>EOG</strong>.<br />
No major discovery or other favorable or adverse<br />
event subsequent to December 31, 2004 is believed to<br />
have caused a material change in the estimates of proved<br />
or proved developed reserves as of that date.<br />
2004 ANNUAL REPORT TO SHAREHOLDERS 45
NET PROVED AND PROVED DEVELOPED RESERVE SUMMARY<br />
The following table sets forth <strong>EOG</strong>’s net proved and proved developed reserves at December 31 for each of the four<br />
years in the period ended December 31, 2004, and the changes in the net proved reserves for each of the three years<br />
in the period then ended as estimated by the engineering staff of <strong>EOG</strong>.<br />
Net Proved Reserves United United<br />
States Canada Trinidad Kingdom TOTAL<br />
Natural Gas (Bcf)<br />
Net proved reserves at December 31, 2001 . . . . . . . . . 2,007.3 644.1 1,145.1 - 3,796.5<br />
Revisions of previous estimates . . . . . . . . . . . . . . . . 9.4 4.7 (21.7) - (7.6)<br />
Purchases in place . . . . . . . . . . . . . . . . . . . . . . . . . . 9.9 102.9 - - 112.8<br />
Extensions, discoveries and other additions. . . . . . . 217.0 83.9 232.4 - 533.3<br />
Sales in place . . . . . . . . . . . . . . . . . . . . . . . . . . . . . . (0.8) (1.5) - - (2.3)<br />
Production. . . . . . . . . . . . . . . . . . . . . . . . . . . . . . . . . (236.6) (56.2) (49.3) - (342.1)<br />
Net proved reserves at December 31, 2002 . . . . . . . . . 2,006.2 777.9 1,306.5 - 4,090.6<br />
Revisions of previous estimates . . . . . . . . . . . . . . . . (24.9) (18.5) (74.9) - (118.3)<br />
Purchases in place . . . . . . . . . . . . . . . . . . . . . . . . . . 43.9 361.0 - - 404.9<br />
Extensions, discoveries and other additions. . . . . . . 345.5 118.3 129.3 59.2 652.3<br />
Sales in place . . . . . . . . . . . . . . . . . . . . . . . . . . . . . . (30.8) - - - (30.8)<br />
Production. . . . . . . . . . . . . . . . . . . . . . . . . . . . . . . . . (238.3) (60.2) (55.4) - (353.9)<br />
Net proved reserves at December 31, 2003 . . . . . . . . . 2,101.6 1,178.5 1,305.5 59.2 4,644.8<br />
Revisions of previous estimates . . . . . . . . . . . . . . . . (62.8) (26.8) 34.2 - (55.4)<br />
Purchases in place . . . . . . . . . . . . . . . . . . . . . . . . . . 44.4 16.6 - - 61.0<br />
Extensions, discoveries and other additions. . . . . . . 537.8 208.0 37.9 - 783.7<br />
Sales in place . . . . . . . . . . . . . . . . . . . . . . . . . . . . . . (1.3) (0.6) - - (1.9)<br />
Production. . . . . . . . . . . . . . . . . . . . . . . . . . . . . . . . . (237.2) (77.4) (68.2) (2.4) (385.2)<br />
Net proved reserves at December 31, 2004 . . . . . . . 2,382.5 1,298.3 1,309.4 56.8 5,047.0<br />
Liquids (MBbl)<br />
Net proved reserves at December 31, 2001 . . . . . . . . . 52,383 6,652 13,099 - 72,134<br />
Revisions of previous estimates . . . . . . . . . . . . . . . . 3,543 396 (572) - 3,367<br />
Purchases in place . . . . . . . . . . . . . . . . . . . . . . . . . . 624 865 - - 1,489<br />
Extensions, discoveries and other additions. . . . . . . 14,763 279 3,041 - 18,083<br />
Sales in place . . . . . . . . . . . . . . . . . . . . . . . . . . . . . . (33) - - - (33)<br />
Production. . . . . . . . . . . . . . . . . . . . . . . . . . . . . . . . . (7,925) (1,026) (874) - (9,825)<br />
Net proved reserves at December 31, 2002 . . . . . . . . . 63,355 7,166 14,694 - 85,215<br />
Revisions of previous estimates . . . . . . . . . . . . . . . . 1,487 214 (1,120) - 581<br />
Purchases in place . . . . . . . . . . . . . . . . . . . . . . . . . . 738 1,379 - - 2,117<br />
Extensions, discoveries and other additions. . . . . . . 15,669 598 1,212 84 17,563<br />
Sales in place . . . . . . . . . . . . . . . . . . . . . . . . . . . . . . (344) - - - (344)<br />
Production. . . . . . . . . . . . . . . . . . . . . . . . . . . . . . . . . (7,897) (1,091) (881) - (9,869)<br />
Net proved reserves at December 31, 2003 . . . . . . . . . 73,008 8,266 13,905 84 95,263<br />
Revisions of previous estimates . . . . . . . . . . . . . . . . 2,649 (116) 3,417 69 6,019<br />
Purchases in place . . . . . . . . . . . . . . . . . . . . . . . . . . 157 1 - - 158<br />
Extensions, discoveries and other additions. . . . . . . 9,859 920 229 - 11,008<br />
Sales in place . . . . . . . . . . . . . . . . . . . . . . . . . . . . . . (411) (14) - - (425)<br />
Production. . . . . . . . . . . . . . . . . . . . . . . . . . . . . . . . . (9,474) (1,290) (1,291) (9) (12,064)<br />
Net proved reserves at December 31, 2004 . . . . . . . 75,788 7,767 16,260 144 99,959<br />
46 <strong>EOG</strong> RESOURCES, INC.
United<br />
United<br />
States Canada Trinidad Kingdom TOTAL<br />
Bcf Equivalent (Bcfe)<br />
Net proved reserves at December 31, 2001 . . . . . . . . . 2,321.6 684.0 1,223.7 - 4,229.3<br />
Revisions of previous estimates . . . . . . . . . . . . . . . . 30.7 7.1 (25.1) - 12.7<br />
Purchases in place . . . . . . . . . . . . . . . . . . . . . . . . . . 13.6 108.1 - - 121.7<br />
Extensions, discoveries and other additions. . . . . . . 305.6 85.6 250.6 - 641.8<br />
Sales in place . . . . . . . . . . . . . . . . . . . . . . . . . . . . . . (1.0) (1.5) - - (2.5)<br />
Production. . . . . . . . . . . . . . . . . . . . . . . . . . . . . . . . . (284.2) (62.4) (54.5) - (401.1)<br />
Net proved reserves at December 31, 2002 . . . . . . . . . 2,386.3 820.9 1,394.7 - 4,601.9<br />
Revisions of previous estimates . . . . . . . . . . . . . . . . (15.9) (17.2) (81.7) - (114.8)<br />
Purchases in place . . . . . . . . . . . . . . . . . . . . . . . . . . 48.3 369.3 - - 417.6<br />
Extensions, discoveries and other additions. . . . . . . 439.6 121.8 136.5 59.7 757.6<br />
Sales in place . . . . . . . . . . . . . . . . . . . . . . . . . . . . . . (32.9) - - - (32.9)<br />
Production. . . . . . . . . . . . . . . . . . . . . . . . . . . . . . . . . (285.7) (66.7) (60.7) - (413.1)<br />
Net proved reserves at December 31, 2003 . . . . . . . . . 2,539.7 1,228.1 1,388.8 59.7 5,216.3<br />
Revisions of previous estimates . . . . . . . . . . . . . . . . (47.0) (27.5) 54.8 0.4 (19.3)<br />
Purchases in place . . . . . . . . . . . . . . . . . . . . . . . . . . 45.4 16.6 - - 62.0<br />
Extensions, discoveries and other additions. . . . . . . 597.0 213.5 39.3 - 849.8<br />
Sales in place . . . . . . . . . . . . . . . . . . . . . . . . . . . . . . (3.8) (0.7) - - (4.5)<br />
Production. . . . . . . . . . . . . . . . . . . . . . . . . . . . . . . . . (294.1) (85.1) (75.9) (2.5) (457.6)<br />
Net proved reserves at December 31, 2004 . . . . . . . 2,837.2 1,344.9 1,407.0 57.6 5,646.7<br />
Net Proved Developed Reserves at: United United<br />
States Canada Trinidad Kingdom TOTAL<br />
Natural Gas (Bcf)<br />
December 31, 2001 . . . . . . . . . . . . . . . . . . . . . . . . . 1,588.4 587.6 620.6 - 2,796.<br />
December 31, 2002 . . . . . . . . . . . . . . . . . . . . . . . . . 1,658.7 683.3 555.2 - 2,897.2<br />
December 31, 2003 . . . . . . . . . . . . . . . . . . . . . . . . . 1,749.3 889.2 429.9 - 3,068.4<br />
December 31, 2004. . . . . . . . . . . . . . . . . . . . . . . . . 1,855.7 1,070.1 760.9 56.8 3,743.5<br />
Liquids (MBbl)<br />
December 31, 2001 . . . . . . . . . . . . . . . . . . . . . . . . . 41,205 6,532 8,435 - 56,172<br />
December 31, 2002 . . . . . . . . . . . . . . . . . . . . . . . . . 47,476 7,045 7,135 - 61,656<br />
December 31, 2003 . . . . . . . . . . . . . . . . . . . . . . . . . 56,321 7,995 5,229 - 69,545<br />
December 31, 2004. . . . . . . . . . . . . . . . . . . . . . . . . 60,478 7,414 10,874 144 78,910<br />
Bcf Equivalents (Bcfe)<br />
December 31, 2001 . . . . . . . . . . . . . . . . . . . . . . . . . 1,835.7 626.8 671.1 - 3,133.6<br />
December 31, 2002 . . . . . . . . . . . . . . . . . . . . . . . . . 1,943.6 725.5 598.0 - 3,267.1<br />
December 31, 2003 . . . . . . . . . . . . . . . . . . . . . . . . . 2,087.3 937.2 461.2 - 3,485.7<br />
December 31, 2004. . . . . . . . . . . . . . . . . . . . . . . . . 2,218.5 1,114.7 826.2 57.6 4,217.0<br />
2004 ANNUAL REPORT TO SHAREHOLDERS 47
Capitalized Costs Relating to Oil and Gas Producing<br />
Activities. The following table sets forth the capitalized<br />
costs relating to <strong>EOG</strong>’s natural gas and crude oil producing<br />
activities at December 31 of the years indicated as follows:<br />
2004 2003<br />
Proved Properties . . . . . . . . . . $9,307,422 $7,990,675<br />
Unproved Properties . . . . . . . . 291,854 198,387<br />
Total . . . . . . . . . . . . . . . . . . 9,599,276 8,189,062<br />
Accumulated Depreciation,<br />
Depletion and<br />
Amortization . . . . . . . . . . . . . (4,497,673) (3,940,145)<br />
Net Capitalized Costs . . . . $5,101,603 $4,248,917<br />
Costs <strong>Inc</strong>urred in Oil and Gas Property Acquisition,<br />
Exploration and Development Activities. The acquisition,<br />
exploration and development costs disclosed in the following<br />
tables are in accordance with definitions in<br />
SFAS No. 19 - “Financial Accounting and Reporting by<br />
Oil and Gas Producing Companies” and SFAS No. 143 -<br />
“Accounting for Asset Retirement Obligations.”<br />
Acquisition costs include costs incurred to purchase,<br />
lease, or otherwise acquire property.<br />
Exploration costs include additions to exploration wells<br />
including those in progress and exploration expenses.<br />
Development costs include additions to production<br />
facilities and equipment and additions to development<br />
wells including those in progress.<br />
The following tables set forth costs incurred related to <strong>EOG</strong>’s oil and gas activities for the years ended December 31:<br />
United<br />
United<br />
States Canada Trinidad Kingdom Other TOTAL<br />
2004<br />
Acquisition Costs of Properties<br />
Unproved . . . . . . . . . . . . . . . . . . . . . . . . . . . . . . $ 129,230 $ 13,490 $ 74 $ - $ - $ 142,794<br />
Proved . . . . . . . . . . . . . . . . . . . . . . . . . . . . . . . . 47,653 4,587 - - - 52,240<br />
Subtotal . . . . . . . . . . . . . . . . . . . . . . . . . . . 176,883 18,077 74 - - 195,034<br />
Exploration Costs . . . . . . . . . . . . . . . . . . . . . . . . . . 212,324 27,771 35,227 27,818 3,443 306,583<br />
Development Costs . . . . . . . . . . . . . . . . . . . . . . . . . 660,799 270,435 46,864 30,910 - 1,009,008<br />
Subtotal . . . . . . . . . . . . . . . . . . . . . . . . . . . 1,050,006 316,283 82,165 58,728 3,443 1,510,625<br />
Asset Retirement Costs (1) . . . . . . . . . . . . . . . . . . . . 5,644 6,610 1,754 2,223 - 16,231<br />
Deferred <strong>Inc</strong>ome Tax on Acquired<br />
Properties . . . . . . . . . . . . . . . . . . . . . . . . . . . . . . . - (16,834) - - - (16,834)<br />
Total. . . . . . . . . . . . . . . . . . . . . . . . . . . . . . $ 1,055,650 $ 306,059 $ 83,919 $ 60,951 $ 3,443 $ 1,510,022<br />
2003<br />
Acquisition Costs of Properties<br />
Unproved . . . . . . . . . . . . . . . . . . . . . . . . . . . . . . $ 43,890 $ 14,536 $ 172 $ - $ - $ 58,598<br />
Proved . . . . . . . . . . . . . . . . . . . . . . . . . . . . . . . . 18,347 386,532 - - - 404,879<br />
Subtotal . . . . . . . . . . . . . . . . . . . . . . . . . . . 62,237 401,068 172 - - 463,477<br />
Exploration Costs . . . . . . . . . . . . . . . . . . . . . . . . . . 145,104 15,429 20,517 20,958 4,664 206,672<br />
Development Costs . . . . . . . . . . . . . . . . . . . . . . . . . 480,257 145,539 23,140 2,812 - 651,748<br />
Subtotal . . . . . . . . . . . . . . . . . . . . . . . . . . . 687,598 562,036 43,829 23,770 4,664 1,321,897<br />
Asset Retirement Costs (1) . . . . . . . . . . . . . . . . . . . . 8,167 3,552 - - - 11,719<br />
Total. . . . . . . . . . . . . . . . . . . . . . . . . . . . . . $ 695,765 $ 565,588 $ 43,829 $ 23,770 $ 4,664 $ 1,333,616<br />
2002<br />
Acquisition Costs of Properties<br />
Unproved . . . . . . . . . . . . . . . . . . . . . . . . . . . . . . $ 28,232 $ 4,754 $ 5,629 $ - $ - $ 38,615<br />
Proved . . . . . . . . . . . . . . . . . . . . . . . . . . . . . . . . 22,589 48,487 - - - 71,076<br />
Subtotal . . . . . . . . . . . . . . . . . . . . . . . . . . . 50,821 53,241 5,629 - - 109,691<br />
Exploration Costs . . . . . . . . . . . . . . . . . . . . . . . . . . 120,058 25,866 18,117 - 2,384 166,425<br />
Development Costs . . . . . . . . . . . . . . . . . . . . . . . . . 423,436 107,952 13,600 - - 544,988<br />
Subtotal . . . . . . . . . . . . . . . . . . . . . . . . . . . 594,315 187,059 37,346 - 2,384 821,104<br />
Deferred <strong>Inc</strong>ome Tax on Acquired<br />
Properties . . . . . . . . . . . . . . . . . . . . . . . . . . . . . . . - 14,938 - - - 14,938<br />
Total (2) . . . . . . . . . . . . . . . . . . . . . . . . . . . . $ 594,315 $ 201,997 $ 37,346 $ - $ 2,384 $ 836,042<br />
(1) The Asset Retirement Costs for the United States are netted with $1 million net gains recognized upon settlement of asset retirement obligations for each<br />
of 2004 and 2003. Asset Retirement Costs for 2003 do not include the cumulative effect of adoption of SFAS No. 143 - “Accounting for Asset Retirement<br />
Obligations” on January 1, 2003.<br />
(2) Pro forma total costs incurred for 2002 are not presented as the pro forma application of SFAS No. 143 to the prior period would not result in pro forma<br />
total expenditures materially different from the actual amount reported.<br />
48 <strong>EOG</strong> RESOURCES, INC.
Results of Operations for Oil and Gas Producing Activities (1) . The following tables set forth results of operations for oil<br />
and gas producing activities for the years ended December 31:<br />
United<br />
United<br />
States Canada Trinidad Kingdom Other (2) TOTAL<br />
2004<br />
Natural Gas, Crude Oil<br />
and Condensate Revenues . . . . . . . . . . . . . . $ 1,687,646 $ 448,346 $ 153,377 $ 12,972 $ - $ 2,302,341<br />
Other, Net . . . . . . . . . . . . . . . . . . . . . . . . . . . . . . 2,128 205 - - - 2,333<br />
Total . . . . . . . . . . . . . . . . . . . . . . . . . . . . . . . 1,689,774 448,551 153,377 12,972 - 2,304,674<br />
Exploration Expenses . . . . . . . . . . . . . . . . . . . . . 71,823 10,264 7,109 4,745 - 93,941<br />
Dry Hole Expenses . . . . . . . . . . . . . . . . . . . . . . . 45,164 11,447 15,851 19,680 - 92,142<br />
Production Costs. . . . . . . . . . . . . . . . . . . . . . . . . 294,338 83,527 14,670 1,790 - 394,325<br />
Impairments. . . . . . . . . . . . . . . . . . . . . . . . . . . . . 68,309 13,221 - - - 81,530<br />
Depreciation, Depletion and Amortization. . . . . . . 382,718 99,879 20,022 1,784 - 504,403<br />
<strong>Inc</strong>ome (Loss) Before <strong>Inc</strong>ome Taxes . . . . . . . . . . 827,422 230,213 95,725 (15,027) - 1,138,333<br />
<strong>Inc</strong>ome Tax Provision (Benefit) . . . . . . . . . . . . . . 295,063 75,146 33,953 (7,230) - 396,932<br />
Results of Operations . . . . . . . . . . . . . . . . . . . . $ 532,359 $ 155,067 $ 61,772 $ (7,797) $ - $ 741,401<br />
2003<br />
Natural Gas, Crude Oil<br />
and Condensate Revenues . . . . . . . . . . . . . . $ 1,410,946 $ 309,336 $ 100,112 $ - $ - $ 1,820,394<br />
Other, Net . . . . . . . . . . . . . . . . . . . . . . . . . . . . . . 4,613 82 - - - 4,695<br />
Total . . . . . . . . . . . . . . . . . . . . . . . . . . . . . . . 1,415,559 309,418 100,112 - - 1,825,089<br />
Exploration Expenses . . . . . . . . . . . . . . . . . . . . . 65,885 5,726 3,997 739 11 76,358<br />
Dry Hole Expenses . . . . . . . . . . . . . . . . . . . . . . . 20,706 4,139 7,890 8,421 - 41,156<br />
Production Costs. . . . . . . . . . . . . . . . . . . . . . . . . 219,447 58,249 11,363 51 2 289,112<br />
Impairments. . . . . . . . . . . . . . . . . . . . . . . . . . . . . 81,661 7,473 - - (1) 89,133<br />
Depreciation, Depletion and Amortization. . . . . . . 359,439 66,334 16,070 - - 441,843<br />
<strong>Inc</strong>ome (Loss) Before <strong>Inc</strong>ome Taxes . . . . . . . . . . 668,421 167,497 60,792 (9,211) (12) 887,487<br />
<strong>Inc</strong>ome Tax Provision (Benefit) . . . . . . . . . . . . . . 239,534 61,928 24,661 (3,673) (5) 322,445<br />
Results of Operations . . . . . . . . . . . . . . . . . . . . $ 428,887 $ 105,569 $ 36,131 $ (5,538) $ (7) $ 565,042<br />
2002<br />
Natural Gas, Crude Oil<br />
and Condensate Revenues . . . . . . . . . . . . . . $ 891,991 $ 170,875 $ 79,551 $ - $ 21 $ 1,142,438<br />
Other, Net . . . . . . . . . . . . . . . . . . . . . . . . . . . . . . 2,521 (1,769) - - - 752<br />
Total . . . . . . . . . . . . . . . . . . . . . . . . . . . . . . . 894,512 169,106 79,551 - 21 1,143,190<br />
Exploration Expenses . . . . . . . . . . . . . . . . . . . . . 52,830 5,529 1,656 152 61 60,228<br />
Dry Hole Expenses . . . . . . . . . . . . . . . . . . . . . . . 26,107 20,642 - - - 46,749<br />
Production Costs. . . . . . . . . . . . . . . . . . . . . . . . . 186,041 48,261 9,977 64 7 244,350<br />
Impairments. . . . . . . . . . . . . . . . . . . . . . . . . . . . . 65,813 2,619 - - (2) 68,430<br />
Depreciation, Depletion and Amortization. . . . . . . 334,318 49,622 14,085 - 11 398,036<br />
<strong>Inc</strong>ome (Loss) Before <strong>Inc</strong>ome Taxes . . . . . . . . . . 229,403 42,433 53,833 (216) (56) 325,397<br />
<strong>Inc</strong>ome Tax Provision (Benefit) . . . . . . . . . . . . . . 82,136 10,319 23,971 (70) (20) 116,336<br />
Results of Operations . . . . . . . . . . . . . . . . . . . . $ 147,267 $ 32,114 $ 29,862 $ (146) $ (36) $ 209,061<br />
(1) Excludes gains or losses on mark-to-market commodity derivative contracts, interest charges and general corporate expenses for each of the three years<br />
in the period ended December 31, 2004.<br />
(2) Other includes other international operations.<br />
2004 ANNUAL REPORT TO SHAREHOLDERS 49
Standardized Measure of Discounted Future Net Cash<br />
Flows Relating to Proved Oil and Gas Reserves. The following<br />
information has been developed utilizing procedures<br />
prescribed by SFAS No. 69 and based on crude oil and<br />
natural gas reserve and production volumes estimated by<br />
the engineering staff of <strong>EOG</strong>. It may be useful for certain<br />
comparison purposes, but should not be solely relied<br />
upon in evaluating <strong>EOG</strong> or its performance. Further, information<br />
contained in the following table should not be considered<br />
as representative of realistic assessments of<br />
future cash flows, nor should the Standardized Measure of<br />
Discounted Future Net Cash Flows be viewed as representative<br />
of the current value of <strong>EOG</strong>.<br />
The future cash flows presented below are based on<br />
sales prices, cost rates, and statutory income tax rates in<br />
existence as of the date of the projections. It is expected<br />
that material revisions to some estimates of crude oil and<br />
natural gas reserves may occur in the future, development<br />
and production of the reserves may occur in periods other<br />
than those assumed, and actual prices realized and costs<br />
incurred may vary significantly from those used.<br />
Management does not rely upon the following information<br />
in making investment and operating decisions.<br />
Such decisions are based upon a wide range of factors,<br />
including estimates of probable as well as proved reserves,<br />
and varying price and cost assumptions considered more<br />
representative of a range of possible economic conditions<br />
that may be anticipated.<br />
The following table sets forth the standardized measure of discounted future net cash flows from projected<br />
production of <strong>EOG</strong>’s crude oil and natural gas reserves for the years ended December 31:<br />
United<br />
United<br />
States Canada Trinidad Kingdom TOTAL<br />
2004<br />
Future cash inflows . . . . . . . . . . . . . . . . . . . . . . . . $ 17,044,764 $ 7,530,192 $ 3,419,365 $ 312,843 $ 28,307,164<br />
Future production costs . . . . . . . . . . . . . . . . . . . . (4,485,711) (2,436,056) (486,892) (77,245) (7,485,904)<br />
Future development costs. . . . . . . . . . . . . . . . . . . (873,309) (281,233) (218,784) (2,422) (1,375,748)<br />
Future net cash flows before income taxes. . . . . . 11,685,744 4,812,903 2,713,689 233,176 19,445,512<br />
Future income taxes . . . . . . . . . . . . . . . . . . . . . . . (3,583,378) (1,295,774) (986,977) (60,010) (5,926,139)<br />
Future net cash flows . . . . . . . . . . . . . . . . . . . . . . 8,102,366 3,517,129 1,726,712 173,166 13,519,373<br />
Discount to present value at<br />
10% annual rate . . . . . . . . . . . . . . . . . . . . . . . . . (3,795,487) (1,570,232) (809,757) (25,919) (6,201,395)<br />
Standardized measure of discounted<br />
future net cash flows relating<br />
to proved oil and gas reserves . . . . . . . . . . . . $ 4,306,879 $ 1,946,897 $ 916,955 $ 147,247 $ 7,317,978<br />
2003<br />
Future cash inflows . . . . . . . . . . . . . . . . . . . . . . . . $ 14,030,539 $ 6,221,171 $ 2,995,951 $ 320,427 $ 23,568,088<br />
Future production costs . . . . . . . . . . . . . . . . . . . . (3,026,650) (1,289,592) (449,200) (47,524) (4,812,966)<br />
Future development costs. . . . . . . . . . . . . . . . . . . (524,401) (200,324) (228,504) (21,289) (974,518)<br />
Future net cash flows before income taxes. . . . . . 10,479,488 4,731,255 2,318,247 251,614 17,780,604<br />
Future income taxes . . . . . . . . . . . . . . . . . . . . . . . (3,382,125) (1,376,955) (786,418) (96,896) (5,642,394)<br />
Future net cash flows . . . . . . . . . . . . . . . . . . . . . . 7,097,363 3,354,300 1,531,829 154,718 12,138,210<br />
Discount to present value at<br />
10% annual rate . . . . . . . . . . . . . . . . . . . . . . . . . (3,393,605) (1,610,085) (778,985) (41,420) (5,824,095)<br />
Standardized measure of discounted<br />
future net cash flows relating<br />
to proved oil and gas reserves . . . . . . . . . . . . $ 3,703,758 $ 1,744,215 $ 752,844 $ 113,298 $ 6,314,115<br />
2002<br />
Future cash inflows . . . . . . . . . . . . . . . . . . . . . . . . $ 9,826,571 $ 2,989,000 $ 2,303,930 $ - $ 15,119,501<br />
Future production costs . . . . . . . . . . . . . . . . . . . . (2,212,357) (586,166) (433,029) - (3,231,552)<br />
Future development costs. . . . . . . . . . . . . . . . . . . (359,787) (43,876) (177,275) - (580,938)<br />
Future net cash flows before income taxes. . . . . . 7,254,427 2,358,958 1,693,626 - 11,307,011<br />
Future income taxes . . . . . . . . . . . . . . . . . . . . . . . (2,214,072) (653,425) (558,788) - (3,426,285)<br />
Future net cash flows . . . . . . . . . . . . . . . . . . . . . . 5,040,355 1,705,533 1,134,838 - 7,880,726<br />
Discount to present value at<br />
10% annual rate . . . . . . . . . . . . . . . . . . . . . . . . . (2,265,700) (766,567) (629,024) - (3,661,291)<br />
Standardized measure of discounted<br />
future net cash flows relating<br />
to proved oil and gas reserves . . . . . . . . . . . . $ 2,774,655 $ 938,966 $ 505,814 $ - $ 4,219,435<br />
50 <strong>EOG</strong> RESOURCES, INC.
Changes in Standardized Measure of Discounted Future Net Cash Flows. The following table sets forth the changes<br />
in the standardized measure of discounted future net cash flows at December 31, for each of the three years in the period<br />
ended December 31, 2004:<br />
United<br />
United<br />
States Canada Trinidad Kingdom TOTAL<br />
December 31, 2001 . . . . . . . . . . . . . . . . . . . . . . . $ 1,710,026 $ 470,477 $ 346,886 $ - $ 2,527,389<br />
Sales and transfers of oil and gas<br />
produced, net of production costs. . . . . . . . . (705,938) (122,614) (69,574) - (898,126)<br />
Net changes in prices and<br />
production costs . . . . . . . . . . . . . . . . . . . . . . 1,561,946 460,977 223,614 - 2,246,537<br />
Extensions, discoveries, additions and<br />
improved recovery net of related costs . . . . . 499,257 123,700 110,415 - 733,372<br />
Development costs incurred . . . . . . . . . . . . . . . 84,300 18,100 13,600 - 116,000<br />
Revisions of estimated development cost . . . . 35,255 (11,418) (20,574) - 3,263<br />
Revisions of previous quantity estimates . . . . . 51,227 11,470 (15,634) - 47,063<br />
Accretion of discount . . . . . . . . . . . . . . . . . . . . 200,701 59,594 48,622 - 308,917<br />
Net change in income taxes . . . . . . . . . . . . . . . (692,670) (135,888) (87,229) - (915,787)<br />
Purchases of reserves in place . . . . . . . . . . . . . 28,851 117,958 - - 146,809<br />
Sales of reserves in place . . . . . . . . . . . . . . . . . (715) (2,827) - - (3,542)<br />
Changes in timing and other. . . . . . . . . . . . . . . 2,415 (50,563) (44,312) - (92,460)<br />
December 31, 2002 . . . . . . . . . . . . . . . . . . . . . . . 2,774,655 938,966 505,814 - 4,219,435<br />
Sales and transfers of oil and gas<br />
produced, net of production costs. . . . . . . . . (1,191,450) (251,070) (88,749) - (1,531,269)<br />
Net changes in prices and production costs . . . . . 1,334,817 422,754 294,570 - 2,052,141<br />
Extensions, discoveries, additions and<br />
improved recovery net of related costs . . . . . 916,653 227,632 93,754 182,581 1,420,620<br />
Development costs incurred . . . . . . . . . . . . . . . 103,200 22,600 23,100 - 148,900<br />
Revisions of estimated development cost . . . . (34,688) (45,591) (29,415) - (109,694)<br />
Revisions of previous quantity estimates . . . . . (35,537) (34,700) (65,239) - (135,476)<br />
Accretion of discount . . . . . . . . . . . . . . . . . . . . 376,431 120,032 73,237 - 569,700<br />
Net change in income taxes . . . . . . . . . . . . . . . (520,575) (240,253) (145,698) (69,283) (975,809)<br />
Purchases of reserves in place . . . . . . . . . . . . . 94,482 547,011 - - 641,493<br />
Sales of reserves in place . . . . . . . . . . . . . . . . . (63,136) - - - (63,136)<br />
Changes in timing and other. . . . . . . . . . . . . . . (51,094) 36,834 91,470 - 77,210<br />
December 31, 2003 . . . . . . . . . . . . . . . . . . . . . . . 3,703,758 1,744,215 752,844 113,298 6,314,115<br />
Sales and transfers of oil and gas<br />
produced, net of production costs. . . . . . . . . (1,393,308) (364,819) (138,707) (11,182) (1,908,016)<br />
Net changes in prices and production costs . . . . . 104,059 (148,876) 181,837 (20,213) 116,807<br />
Extensions, discoveries, additions and<br />
improved recovery net of related costs . . . . . 1,247,934 385,547 8,564 - 1,642,045<br />
Development costs incurred . . . . . . . . . . . . . . . 130,000 88,900 97,000 9,500 325,400<br />
Revisions of estimated development cost . . . . 77,986 8,058 (31,237) 5,138 59,945<br />
Revisions of previous quantity estimates . . . . . (101,976) (48,656) 56,372 1,252 (93,008)<br />
Accretion of discount . . . . . . . . . . . . . . . . . . . . 521,398 224,582 112,510 18,258 876,748<br />
Net change in income taxes . . . . . . . . . . . . . . . (143,615) 23,315 (124,614) 26,552 (218,362)<br />
Purchases of reserves in place . . . . . . . . . . . . . 79,703 15,543 - - 95,246<br />
Sales of reserves in place . . . . . . . . . . . . . . . . . (10,307) (1,776) - - (12,083)<br />
Changes in timing and other. . . . . . . . . . . . . . . 91,247 20,864 2,386 4,644 119,141<br />
December 31, 2004 . . . . . . . . . . . . . . . . . . . . . . $ 4,306,879 $ 1,946,897 $ 916,955 $ 147,247 $ 7,317,978<br />
2004 ANNUAL REPORT TO SHAREHOLDERS 51
Unaudited Quarterly Financial Information<br />
The following table presents unaudited quarterly financial information for 2004 and 2003:<br />
Quarter Ended<br />
(In Thousands, Except Per Share Amounts) Mar 31 Jun 30 Sep 30 Dec 31<br />
2004<br />
Net Operating Revenues . . . . . . . . . . . . . . . . . . . . . . . . $ 464,320 $ 519,021 $ 594,230 $ 693,654<br />
Operating <strong>Inc</strong>ome . . . . . . . . . . . . . . . . . . . . . . . . . . . . . $ 171,436 $ 226,736 $ 274,500 $ 306,523<br />
<strong>Inc</strong>ome Before <strong>Inc</strong>ome Taxes . . . . . . . . . . . . . . . . . . . . $ 152,024 $ 212,745 $ 262,343 $ 298,900<br />
<strong>Inc</strong>ome Tax Provision . . . . . . . . . . . . . . . . . . . . . . . . . . 51,171 67,808 90,033 92,145<br />
Net <strong>Inc</strong>ome . . . . . . . . . . . . . . . . . . . . . . . . . . . . . . . . . . 100,853 144,937 172,310 206,755<br />
Preferred Stock Dividends . . . . . . . . . . . . . . . . . . . . . . 2,758 2,758 2,758 2,618<br />
Net <strong>Inc</strong>ome Available to Common. . . . . . . . . . . . . . . . . $ 98,095 $ 142,179 $ 169,552 $ 204,137<br />
Net <strong>Inc</strong>ome Per Share Available to Common<br />
Basic (1) . . . . . . . . . . . . . . . . . . . . . . . . . . . . . . . . . . . . $ 0.85 $ 1.22 $ 1.44 $ 1.73<br />
Diluted (1) . . . . . . . . . . . . . . . . . . . . . . . . . . . . . . . . . . . $ 0.83 $ 1.20 $ 1.42 $ 1.69<br />
Average Number of Common Shares<br />
Basic . . . . . . . . . . . . . . . . . . . . . . . . . . . . . . . . . . . . . 115,645 116,388 117,411 118,070<br />
Diluted . . . . . . . . . . . . . . . . . . . . . . . . . . . . . . . . . . . . 117,621 118,709 119,677 120,556<br />
2003<br />
Net Operating Revenues . . . . . . . . . . . . . . . . . . . . . . . . $ 464,669 $ 424,754 $ 458,724 $ 396,528<br />
Operating <strong>Inc</strong>ome . . . . . . . . . . . . . . . . . . . . . . . . . . . . . $ 226,129 $ 176,868 $ 193,312 $ 101,005<br />
<strong>Inc</strong>ome Before <strong>Inc</strong>ome Taxes . . . . . . . . . . . . . . . . . . . . $ 210,963 $ 165,741 $ 179,604 $ 97,568<br />
<strong>Inc</strong>ome Tax Provision . . . . . . . . . . . . . . . . . . . . . . . . . . 74,407 56,950 62,185 23,058<br />
Net <strong>Inc</strong>ome Before Cumulative Effect of<br />
Change in Accounting Principle . . . . . . . . . . . . . . . . . 136,556 108,791 117,419 74,510<br />
Cumulative Effect of Change in Accounting<br />
Principle, Net of <strong>Inc</strong>ome Tax . . . . . . . . . . . . . . . . . . . . (7,131) - - -<br />
Net <strong>Inc</strong>ome . . . . . . . . . . . . . . . . . . . . . . . . . . . . . . . . . . 129,425 108,791 117,419 74,510<br />
Preferred Stock Dividends . . . . . . . . . . . . . . . . . . . . . . 2,758 2,758 2,758 2,758<br />
Net <strong>Inc</strong>ome Available to Common. . . . . . . . . . . . . . . . . $ 126,667 $ 106,033 $ 114,661 $ 71,752<br />
Net <strong>Inc</strong>ome Per Share<br />
Basic (1)<br />
Net <strong>Inc</strong>ome Available to Common Before<br />
Cumulative Effect of Change in<br />
Accounting Principle . . . . . . . . . . . . . . . . . . . . . . $ 1.17 $ 0.93 $ 1.00 $ 0.62<br />
Cumulative Effect of Change in<br />
Accounting Principle, Net of <strong>Inc</strong>ome Tax . . . . . . (0.06) - - -<br />
Net <strong>Inc</strong>ome Per Share Available to Common . . . . . . . $ 1.11 $ 0.93 $ 1.00 $ 0.62<br />
Diluted (1)<br />
Net <strong>Inc</strong>ome Available to Common Before<br />
Cumulative Effect of Change in<br />
Accounting Principle . . . . . . . . . . . . . . . . . . . . . . $ 1.15 $ 0.91 $ 0.99 $ 0.61<br />
Cumulative Effect of Change in<br />
Accounting Principle, Net of <strong>Inc</strong>ome Tax . . . . . . (0.06) - - -<br />
Net <strong>Inc</strong>ome Per Share Available to Common . . . . . . . $ 1.09 $ 0.91 $ 0.99 $ 0.61<br />
Average Number of Common Shares<br />
Basic . . . . . . . . . . . . . . . . . . . . . . . . . . . . . . . . . . . . . 114,441 114,382 114,616 114,893<br />
Diluted . . . . . . . . . . . . . . . . . . . . . . . . . . . . . . . . . . . . 116,224 116,131 116,370 117,209<br />
(1) The sum of net income per share available to common may not agree with total year net income per share available to common as each quarterly<br />
computation is based on the weighted average of common shares outstanding.<br />
52 <strong>EOG</strong> RESOURCES, INC.
SELECTED FINANCIAL DATA<br />
Year Ended December 31<br />
(In Thousands, Except Per Share Amounts) 2004 2003 2002<br />
Statement of <strong>Inc</strong>ome Data:<br />
Net Operating Revenues . . . . . . . . . . . . . . . . . . . . . . . . . . . . . . . . . . . . . . $ 2,271,225 $ 1,744,675 $ 1,094,682<br />
Operating <strong>Inc</strong>ome . . . . . . . . . . . . . . . . . . . . . . . . . . . . . . . . . . . . . . . . . . . 979,195 697,314 180,977<br />
Net <strong>Inc</strong>ome Before Cumulative Effect of<br />
Change in Accounting Principle . . . . . . . . . . . . . . . . . . . . . . . . . . . . . . . $ 624,855 $ 437,276 $ 87,173<br />
Cumulative Effect of Change in Accounting Principle,<br />
Net of <strong>Inc</strong>ome Tax (1) . . . . . . . . . . . . . . . . . . . . . . . . . . . . . . . . . . . . . . . - (7,131) -<br />
Net <strong>Inc</strong>ome . . . . . . . . . . . . . . . . . . . . . . . . . . . . . . . . . . . . . . . . . . . . . . . . 624,855 430,145 87,173<br />
Preferred Stock Dividends . . . . . . . . . . . . . . . . . . . . . . . . . . . . . . . . . . . . 10,892 11,032 11,032<br />
Net <strong>Inc</strong>ome Available to Common . . . . . . . . . . . . . . . . . . . . . . . . . . . . . $ 613,963 $ 419,113 $ 76,141<br />
Net <strong>Inc</strong>ome Per Share Available to Common<br />
Basic<br />
Net <strong>Inc</strong>ome Available to Common<br />
Before Cumulative Effect of Change<br />
in Accounting Principle. . . . . . . . . . . . . . . . . . . . . . . . . . . . . . . . . $ 5.25 $ 3.72 $ 0.66<br />
Cumulative Effect of Change in<br />
Accounting Principle, Net of <strong>Inc</strong>ome Tax (1) . . . . . . . . . . . . . . . . . . - (0.06) -<br />
Net <strong>Inc</strong>ome Per Share Available to Common . . . . . . . . . . . . . . . . . $ 5.25 $ 3.66 $ 0.66<br />
Diluted<br />
Net <strong>Inc</strong>ome Available to Common<br />
Before Cumulative Effect of Change<br />
in Accounting Principle. . . . . . . . . . . . . . . . . . . . . . . . . . . . . . . . . $ 5.15 $ 3.66 $ 0.65<br />
Cumulative Effect of Change in<br />
Accounting Principle, Net of <strong>Inc</strong>ome Tax (1) . . . . . . . . . . . . . . . . . . - (0.06) -<br />
Net <strong>Inc</strong>ome Per Share Available to Common . . . . . . . . . . . . . . . . . $ 5.15 $ 3.60 $ 0.65<br />
Average Number of Common Shares<br />
Basic . . . . . . . . . . . . . . . . . . . . . . . . . . . . . . . . . . . . . . . . . . . . . . . . . 116,876 114,597 115,335<br />
Diluted . . . . . . . . . . . . . . . . . . . . . . . . . . . . . . . . . . . . . . . . . . . . . . . . . 119,188 116,519 117,245<br />
(1) <strong>EOG</strong> adopted Statement of Financial Accounting Standards (SFAS) No. 143 - “Accounting for Asset Retirement Obligations” on January 1, 2003. Pro forma<br />
net income for 2002 is not presented since the pro forma application of SFAS No. 143 to the prior periods would not result in pro forma net income materially<br />
different from the actual amount reported.<br />
At December 31<br />
(In Thousands) 2004 2003 2002<br />
Balance Sheet Data:<br />
Net Oil and Gas Properties . . . . . . . . . . . . . . . . . . . . . . . . . . . . . . . . . . . . $ 5,101,603 $ 4,248,917 $ 3,321,548<br />
Total Assets. . . . . . . . . . . . . . . . . . . . . . . . . . . . . . . . . . . . . . . . . . . . . . . . 5,798,923 4,749,015 3,813,568<br />
Long-Term Debt . . . . . . . . . . . . . . . . . . . . . . . . . . . . . . . . . . . . . . . . . . . . 1,077,622 1,108,872 1,145,132<br />
Shareholders’ Equity . . . . . . . . . . . . . . . . . . . . . . . . . . . . . . . . . . . . . . . . . 2,945,424 2,223,381 1,672,395<br />
2004 ANNUAL REPORT TO SHAREHOLDERS 53
QUARTERLY STOCK DATA AND RELATED SHAREHOLDER MATTERS<br />
The following table sets forth, for the periods indicated, the high and low sales prices per share for the common<br />
stock of <strong>EOG</strong>, as reported on the New York Stock Exchange Composite Tape, and the amount of common stock dividend<br />
declared per share. The information shown in the following table is not adjusted for the 2005 stock split discussed<br />
below.<br />
Price Range Dividend<br />
High Low Declared<br />
2004<br />
First Quarter . . . . . . . . . . . . . . . . . . . . $ 47.45 $ 42.45 $ 0.06<br />
Second Quarter. . . . . . . . . . . . . . . . . . 63.69 45.32 0.06<br />
Third Quarter. . . . . . . . . . . . . . . . . . . . 66.87 55.20 0.06<br />
Fourth Quarter . . . . . . . . . . . . . . . . . . 76.50 64.15 0.06<br />
2003<br />
First Quarter . . . . . . . . . . . . . . . . . . . . $ 42.83 $ 35.70 $ 0.04<br />
Second Quarter. . . . . . . . . . . . . . . . . . 45.56 36.56 0.05<br />
Third Quarter. . . . . . . . . . . . . . . . . . . . 42.87 37.70 0.05<br />
Fourth Quarter . . . . . . . . . . . . . . . . . . 47.52 40.85 0.05<br />
On February 2, 2005, <strong>EOG</strong> announced that the Board of Directors had approved a two-for-one stock split in the form<br />
of a stock dividend, payable to record holders as of February 15, 2005 and to be issued on March 1, 2005. In addition,<br />
the Board increased the quarterly cash dividend on the common stock by 33%, resulting in a quarterly cash dividend of<br />
$0.08 per share pre-split or $0.04 per share post-split. The stock split was the second stock split in the history of <strong>EOG</strong>.<br />
On June 15, 1994, <strong>EOG</strong> also effected a two-for-one stock split in the form of a stock dividend.<br />
As of February 24, 2005, there were approximately 270 record holders of <strong>EOG</strong>’s common stock, including individual<br />
participants in security position listings. There are an estimated 77,750 beneficial owners of <strong>EOG</strong>’s common stock,<br />
including shares held in street name.<br />
<strong>EOG</strong> currently intends to continue to pay quarterly cash dividends on its outstanding shares of common stock.<br />
However, the determination of the amount of future cash dividends, if any, to be declared and paid will depend upon,<br />
among other things, the financial condition, funds from operations, level of exploration, exploitation and development<br />
expenditure opportunities and future business prospects of <strong>EOG</strong>.<br />
54 <strong>EOG</strong> RESOURCES, INC.
RECONCILIATION SCHEDULES<br />
(Unaudited; In Millions, Except Ratio and Share Information)<br />
Below are supporting schedules and definitions for certain quantitative measures used in the Letter to<br />
Shareholders:<br />
1999 2000 2001 2002 2003 2004<br />
Return on Equity (ROE)<br />
Shareholders’ Equity . . . . . . . . . . . . . . . . . . . . . . . . . . . $ 1,130 $ 1,381 $ 1,643 $ 1,672 $ 2,223 $ 2,945<br />
Less: Preferred Stock. . . . . . . . . . . . . . . . . . . . . . . . . . . (147) (147) (148) (148) (148) (99)<br />
Common Shareholders’ Equity (Non-GAAP) . . . . . . . . . $ 983 $ 1,234 $ 1,495 $ 1,524 $ 2,075 $ 2,846<br />
Average Common Shareholders' Equity - (a). . . . . . . . . $ 1,109 $ 1,365 $ 1,510 $ 1,800 $ 2,461<br />
Net <strong>Inc</strong>ome Available to Common - (b) . . . . . . . . . . . . . $ 386 $ 388 $ 76 $ 419 $ 614<br />
ROE - (b) / (a) . . . . . . . . . . . . . . . . . . . . . . . . . . . . . . . . . 35% 28% 5% 23% 25%*<br />
Average ROE 2000 - 2004 . . . . . . . . . . . . . . . . . . . . . . . 23%*<br />
Return on Capital Employed (ROCE)<br />
Interest Expense . . . . . . . . . . . . . . . . . . . . . . . . . . . . . . $ 61 $ 45 $ 60 $ 59 $ 63<br />
Tax Benefit Imputed (based on 35%) . . . . . . . . . . . . . . (21) (16) (21) (21) (22)<br />
After Tax Interest Expense (Non-GAAP) - (a) . . . . . . . . . $ 40 $ 29 $ 39 $ 38 $ 41<br />
Net <strong>Inc</strong>ome - (b) . . . . . . . . . . . . . . . . . . . . . . . . . . . . . . . $ 397 $ 399 $ 87 $ 430 $ 625<br />
Shareholders’ Equity . . . . . . . . . . . . . . . . . . . . . . . . . . . $ 1,130 $ 1,381 $ 1,643 $ 1,672 $ 2,223 $ 2,945<br />
Net Debt<br />
Long-Term Debt . . . . . . . . . . . . . . . . . . . . . . . . . . . . 990 859 856 1,145 1,109 1,078<br />
Less: Cash . . . . . . . . . . . . . . . . . . . . . . . . . . . . . . . . (25) (20) (3) (10) (4) (21)<br />
Total Capitalization . . . . . . . . . . . . . . . . . . . . . . . . . . . . . $ 2,095 $ 2,220 $ 2,496 $ 2,807 $ 3,328 $ 4,002<br />
Average Total Capitalization - (c) . . . . . . . . . . . . . . . . . . $ 2,157 $ 2,358 $ 2,652 $ 3,068 $ 3,665<br />
ROCE - [(a) + (b)] / (c). . . . . . . . . . . . . . . . . . . . . . . . . . . 20% 18% 5% 15% 18%*<br />
Average ROCE 2000 - 2004. . . . . . . . . . . . . . . . . . . . . . 15%*<br />
Debt-to-Total Capitalization Ratio<br />
As used in this ratio, Total Capitalization is the sum of Long-Term Debt and Shareholders’ Equity.<br />
Return to Shareholders<br />
Return to Shareholders represents the total return after reinvesting all dividends back into the share and the appreciation<br />
in stock price during the period. The total return is expressed as a percentage of the stock price at the beginning<br />
of the period.<br />
2004 ANNUAL REPORT TO SHAREHOLDERS 55
CERTIFICATIONS<br />
In 2004, <strong>EOG</strong>’s chief executive officer (CEO) provided to the New York Stock Exchange the annual CEO<br />
certification regarding <strong>EOG</strong>’s compliance with the New York Stock Exchange’s corporate governance listing<br />
standards. In addition, <strong>EOG</strong>’s CEO and <strong>EOG</strong>’s principal financial officer filed with the U.S. Securities and Exchange<br />
Commission all required certifications regarding the quality of <strong>EOG</strong>’s public disclosures in its reports for the fiscal<br />
year 2004.<br />
GLOSSARY OF TERMS<br />
Bcf<br />
Billion cubic feet<br />
MMcf<br />
Million cubic feet<br />
Bcfe<br />
Billion cubic feet equivalent<br />
MMcfd<br />
Million cubic feet per day<br />
CNCL<br />
Caribbean Nitrogen Company Limited<br />
MMcfe<br />
Million cubic feet equivalent<br />
$/Bbl<br />
Dollars per barrel<br />
MMcfed<br />
Million cubic feet equivalent per day<br />
$/Mcf<br />
Dollars per thousand cubic feet<br />
N2000<br />
Nitrogen (2000) Unlimited<br />
$/MMBtu<br />
Dollars per million British thermal units<br />
NGC<br />
National Gas Company of Trinidad and<br />
LNG<br />
Liquefied Natural Gas<br />
Tobago<br />
MBbl<br />
Thousand barrels<br />
NYMEX<br />
New York Mercantile Exchange<br />
MBbld<br />
Thousand barrels per day<br />
ROCE<br />
Return on Capital Employed<br />
Mcf<br />
Thousand cubic feet<br />
ROE<br />
Return on Equity<br />
Mcfe<br />
Thousand cubic feet equivalent<br />
S&P<br />
Standard and Poor’s<br />
MMBtu<br />
Million British thermal units<br />
SECC<br />
South East Coast Consortium<br />
MMBtud<br />
Million British thermal units per day<br />
Tcfe<br />
Trillion cubic feet equivalent<br />
56 <strong>EOG</strong> RESOURCES, INC.
OFFICERS AND DIRECTORS<br />
Directors<br />
George A. Alcorn (1)<br />
Houston, Texas<br />
President, Alcorn Exploration, <strong>Inc</strong>.<br />
Charles R. Crisp (2)<br />
Houston, Texas<br />
Investments<br />
Mark G. Papa<br />
Chairman and Chief Executive Officer<br />
<strong>EOG</strong> <strong>Resources</strong>, <strong>Inc</strong>.<br />
Edmund P. Segner, III<br />
President and Chief of Staff<br />
<strong>EOG</strong> <strong>Resources</strong>, <strong>Inc</strong>.<br />
William D. Stevens (3)<br />
Houston, Texas<br />
Retired<br />
H. Leighton Steward (4)<br />
Boerne, Texas<br />
Author-Partner, Sugar Busters LLC<br />
Donald F. Textor (5)<br />
Locust Valley, New York<br />
Portfolio Manager, Dorset Energy Fund<br />
and Partner, Knott Partners LLC<br />
Frank G. Wisner (6)<br />
New York, New York<br />
Vice Chairman<br />
American International Group, <strong>Inc</strong>.<br />
Executive Committee<br />
Mark G. Papa<br />
Chairman and Chief Executive Officer<br />
Edmund P. Segner, III<br />
President and Chief of Staff<br />
Loren M. Leiker<br />
Executive Vice President,<br />
Exploration and Development<br />
Gary L. Thomas<br />
Executive Vice President, Operations<br />
Barry Hunsaker, Jr.<br />
Senior Vice President and General<br />
Counsel<br />
Sandeep Bhakhri<br />
Vice President and Chief Information<br />
Officer<br />
Officers<br />
(including key subsidiaries)<br />
Lewis Chandler, Jr.<br />
Senior Vice President, Law<br />
Steven B. Coleman<br />
Senior Vice President and General<br />
Manager, Tyler<br />
Kurt D. Doerr<br />
Senior Vice President and General<br />
Manager, Denver<br />
Lawrence E. Fenwick<br />
Senior Vice President and General<br />
Manager, <strong>EOG</strong> <strong>Resources</strong> Canada <strong>Inc</strong>.<br />
Robert K. Garrison<br />
Senior Vice President and General<br />
Manager, Corpus Christi<br />
William R. Thomas<br />
Senior Vice President and General<br />
Manager, Fort Worth<br />
William E. Albrecht<br />
Vice President, Acquisitions and<br />
Engineering<br />
Maire A. Baldwin<br />
Vice President, Investor Relations<br />
Ben B. Boyd<br />
Vice President, Accounting,<br />
<strong>EOG</strong> <strong>Resources</strong> International, <strong>Inc</strong>.<br />
Gerald R. Colley<br />
Vice President and General Manager,<br />
International<br />
President, <strong>EOG</strong> <strong>Resources</strong><br />
International, <strong>Inc</strong>.<br />
Phil C. DeLozier<br />
Vice President, Business Development<br />
Timothy K. Driggers<br />
Vice President and Chief Accounting<br />
Officer<br />
Patricia L. Edwards<br />
Vice President, Human <strong>Resources</strong>,<br />
Administration and Corporate<br />
Secretary<br />
Kevin S. Hanzel<br />
Vice President, Audit<br />
Andrew N. Hoyle<br />
Vice President, Marketing and<br />
Regulatory Affairs<br />
Olaf A. C. Karlsen<br />
General Manager, <strong>EOG</strong> <strong>Resources</strong><br />
United Kingdom Limited<br />
Lindell L. Looger<br />
Vice President and General Manager,<br />
<strong>EOG</strong> <strong>Resources</strong> Trinidad Limited<br />
Tony C. Maranto<br />
Vice President and General Manager,<br />
Oklahoma City<br />
Richard A. Ott<br />
Vice President, Tax<br />
Earl J. Ritchie, Jr.<br />
Vice President and General Manager,<br />
Offshore<br />
Gary L. Smith<br />
Vice President and General Manager,<br />
Pittsburgh<br />
Steven E. Weatherl<br />
Vice President and General Manager,<br />
Midland<br />
Ronnie L. Adams<br />
Controller, Land Administration<br />
Ann D. Janssen<br />
Controller, Financial Reporting and<br />
Planning<br />
Joseph C. Landry<br />
Controller, Operations Accounting<br />
Helen Y. Lim<br />
Treasurer<br />
(1) Chairman, Compensation Committee;<br />
Member, Audit, Corporate Governance<br />
and Nominating Committees; 2004<br />
Presiding Director<br />
(2) Chairman, Nominating Committee;<br />
Member, Audit, Compensation and<br />
Corporate Governance Committees<br />
(3) Member, Audit, Compensation,<br />
Corporate Governance and Nominating<br />
Committees<br />
(4) Member, Audit, Compensation,<br />
Corporate Governance and Nominating<br />
Committees; 2005 Presiding Director<br />
(5) Chairman, Audit Committee; Member,<br />
Compensation, Corporate Governance<br />
and Nominating Committees<br />
(6) Chairman, Corporate Governance<br />
Committee; Member, Audit,<br />
Compensation and Nominating<br />
Committees<br />
2004 ANNUAL REPORT TO SHAREHOLDERS 57
SHAREHOLDER INFORMATION<br />
Corporate Headquarters<br />
333 Clay Street, Suite 4200<br />
Houston, Texas 77002<br />
P.O. Box 4362<br />
Houston, Texas 77210-4362<br />
(713) 651-7000<br />
Toll Free: (877) 363-<strong>EOG</strong>R<br />
www.eogresources.com<br />
Common Stock Exchange Listing<br />
New York Stock Exchange<br />
Ticker Symbol: <strong>EOG</strong><br />
Common Stock Outstanding at<br />
December 31, 2004: 118,927,444<br />
Principal Transfer Agent<br />
EquiServe Trust Company, N.A.<br />
P.O. Box 2500<br />
Jersey City, New Jersey 07303-2500<br />
Toll Free: (800) 519-3111<br />
Outside U.S.: (201) 324-1225<br />
www.equiserve.com<br />
Hearing Impaired: TDD (201) 222-4955<br />
Annual Meeting of Shareholders<br />
The Annual Meeting of Shareholders will be held at 2 p.m. CDT<br />
in the La Salle “A” Room of the Doubletree Hotel, 400 Dallas Street,<br />
Houston, Texas 77002 on Tuesday, May 3, 2005. Information with<br />
respect to this meeting is contained in the Proxy Statement sent<br />
with this Annual Report to holders of record of <strong>EOG</strong> <strong>Resources</strong>, <strong>Inc</strong>.<br />
Common Stock. The Annual Report is not to be considered a part<br />
of the proxy soliciting material.<br />
Additional Information<br />
Additional copies of the Annual Report and the Form 10-K<br />
are available upon request by calling (877) 363-<strong>EOG</strong>R or through<br />
the <strong>EOG</strong> <strong>Resources</strong> website at www.eogresources.com.<br />
Quarterly earnings press release information and SEC filings<br />
also can be accessed through the website.<br />
Financial analysts and investors who need additional<br />
information should visit the <strong>EOG</strong> website, www.eogresources.com,<br />
or contact Investor Relations at (713) 651-7000.<br />
58 <strong>EOG</strong> RESOURCES, INC.
OUR EMPLOYEES Latiff Abdool Harold Abernathy Ismael Abila Linda Abrego Rosie Abrego Maria Acevedo Linda Acosta Tammy Adair Kimberly Adams Ronnie Adams Michael Adrion Candelario Aguilar<br />
Amit Ahuja Roberto Alaniz Melissa Albert William Albrecht Patricia Aleman Joseph Alexander Gabriella Aliberti-Mabry Raymond Allbee Kenneth Allemand Kenneth Allen Cathy Anderson David Anderson<br />
Joseph Anderson William Anderson Francisca Andreassen Hilary Andrews Tammy Andrews Jim Anschutz Barbara Anselm Andres Arambula Kerry Archibald Blaine Ardelian Rene Argueta Erick Armentrout<br />
Ralph Armentrout Donald Armstrong Robert Armstrong Derek Arnold Lance Arnold Paul Arnott James Ary Terry Avery Balliram Bachan Peter Bacon Lanny Baker Twila Baker Maire Baldwin Jerry Ball John Ball<br />
F. Blaine Balmer Jimmy Banks Valeria Banks Bijay Banthia Brian Baptiste Judy Barlow James Barnes Kelley Barnett Emilio Barrera Anthony Barrett Jennifer Barter Curt Bateman Dale Bawol Ana Beasley<br />
Michelle Beauchamp Jennifer Beavers Carla Beck Gary Beck John Becker Stephen Bedell Barbara Belcher Heather Bell Olynda Bello Adriana Benavides Steven Bennett Stephen Benoit Roy Benteau<br />
A. John Bergquist Martha Bernardini Kerry Bernas Timothy Berry Berwin Best Sandeep Bhakhri Jerry Biggs Jeffery Birkelbach Blaine Bischoff Wendy Bjorkman Sidney Bjorlie Jennifer Blackburn Randolph Blackburn<br />
Brad Blackwood Carolyn Bladek Dana Blevins Teresa Block Stanley Blundell Kenneth Boedeker Susan Boedeker Mark Boehm David Boerm Timothy Boggess David Boisjolie Kimberly Bolton Wendy Bone<br />
Kelly Bonogofski Alisa Booth Vera Boren Richard Bosch Stewart Bosch James Bouillion Deidra Bourland David Bowdle Jamie Bowman Ben Boyd John Boyd Mary Bradford Diane Bradley Tom Bradley<br />
Sharleen Brand Bryan Brandon Laurie Brandon Crystal Branham Cheryl Brashear Larry Brazile Sheila Bremer Isabelle Briand Mike Brietzke Susan Bright Ann Brindle Gary Britt Rachel Britt Sonia Brittain<br />
Michael Brooks Burt Broussard Jeff Brown Jody Brown Robert Brown Steve Brown David Brunette Linda Bruster Alecia Bryson Steven Bryson James Bucci Shane Buck Kerry Burdett Geoff Burkart Rick Burke<br />
Wesley Burke Wendy Burlock James Burnett John Burnette Tina Burns Laurie Burt Paul Burt Debbie Butler Dustin Bynum Kenneth Byrd William Byrd Kim Cadena Shardee Caesar Brad Cage Robert Cahill<br />
Gary Cain Mark Cain Victoria Calhoun Carol Cameron Howard Cameron Carleen Campbell Catherine Campbell Daniel Canales David Canales Charlotte Candler Joseph Cantu Emmett Capt Joseph Caputo<br />
John Cardin Santos Cardona Charleen Carlos Skipper Carnes Ronald Carney Stacy Carpenter Jacqueline Carr-Brown Noemi Carrillo Leland Carroll Ricky Carroll Robert Carroll Gary Carson Kenneth Carter<br />
Gary Cartwright Susan Carulli Nanci Cassard Jesus Castillo Dennis Cates Paula Chaffin Rinu Chahal Katherine Chalfant Sheryl Champagne Shelly Chan Lewis Chandler John Chapman William Chapman<br />
Andres Chavez Linda Chenoweth Clara Chiew Helen Chin Michael Chong Tracey Chong-Ashing Penny Chrisman Lorne Christal Beverly Christensen Elnora Christoffersen Douglas Chrumka Samie Clanton<br />
Chantelle Clark Douglas Clark John Clark Richard Clark Sandra Clark Julie Clay Tamara Clayton Eugene Clower Linda Cluiss April Colbert Ruby Cole Carolyn Coleman Clifton Coleman James Coleman<br />
Steven Coleman Robert Coles Gerald Colley Charles Colson Christian Combs Traci Conner Paul Connolly Erica Conroy Barry Constable Duane Cook Karen Cook Michael Cooksey Tyler Coon Lisa Copeland<br />
Craig Cormany Neal Cormier Roy Coston Stephen Couch David Covill Betty Cowart Emily Cowen Kim Cowherd Dawn Marie Cox Mark Cox Russell Cox Jack Cozart Hal Crabb Logan Craig Alicia Craigwell<br />
Douglas Cramer Garth Cramer Bette Cranford John Cranmore Nora Crawford Sherry Crawford Wayland Crawley Misti Creach Robert Crim Paul Cross Barry Crowder Phyllis Croy Stephen Croy Herminia Cruz<br />
Terry Csere Wade Cuch Valerie Culpepper Ferdinand Cumberbatch James Cunkelman Peter Cunningham Nancy Currie Louis D'Abadie Diana Dabiedeen Ashish Dabral Jeff Dahl Lee Dailey Donald Daisher<br />
Wendy Dalton Fassil Daniel Robert Daniels Marsha Danzel Leandro Daponte Judy Dargin Roger Dart Bryan David David Davis Donald Davis Randall Davis Robert Davis William Davis Jeremy Dawson Richard Day<br />
David Deal Teresa Dean Patricia Dechow Howard Deis Elizabeth DeLaGarza Chris Delcambre Gloria DelCampo James DelCampo Joseph DelCampo Tonie DeLeon Brenda Dellinger Phil DeLozier Marie Deslattes<br />
Ronald Devoll Shahin Dewji Nancy Diaz Curtis Dill Trudy Dillon-Patrick John Dixon Kurt Doerr Daniel Domingue Holly Dominguez Manuel Dominguez Kathryn Donaldson Daryl Doodnath Timothy Dort<br />
Rebecca Doyle Patrick Draves Timothy Driggers Bobby Driver Barbara Drosche Hans Dube Denis Dufresne Cynthia Duge James Dunford Lane Dunham Kenneth Dunn George Dupre Brian Durman Frederick Ealand<br />
Louise Earl Karen Ebbert Madeline Edgley Patricia Edwards Ronald Einerson Cynthia Einkauf Jerome Ellard Mark Ellerbe Terrence Elliot Edward Elliott Robert Ellis Donna Ellsworth John Ellyson William Elmer<br />
Jerome Elmlinger Ronald Ensminger Darrah Eresman Karen Erwin Marc Eschenburg Amanda Espinosa Don Estill Sandra Estrada Betty Evans Carol Evans-Danver Beverly Fabian Kathleen Fabra Clyde Faggett<br />
Roger Falk Richard Fansher Carol Faullon Melanie Fehr Lawrence Fenwick William Fergeson Len Ferguson Richard Ferguson Olga Ferrell John Ferringer Perry Fields Marilyn Fish David Fleming James Fletcher<br />
Criselda Flores Daniel Flores Robbye Floyd-Archibald Clifford Fobes Richard Fobes James Folcik Grace Ford Larry Formo Susan Forsyth Chantal Fortin Mark Fortuna Darryl Fossen Therese Foster Ilona Fournier<br />
Larry Fournier John Fowler Lonnie Fox Charles Francis Janie Franco Lydia Franco Christine Frank Danny Frederick Joe Freeman Reginald Freestone Judy Frey William Fricker Bonita Friesenhahn Kari Fritz<br />
David Frye Laura Fuentes Catherine Gage Jeremy Galeski Raymond Galvan Barbara Ganong Stephen Garber Agustin Garcia Maria Garcia Vic Garcia Kaylene Gardner Michael Gardner Dwayne Garnett<br />
Robert Garrison Yolanda Garza Richard Gauthier Debra Gay Marshall Gazette Maria Geerligs Zola George James Gerlinger Mark Germinario Karen Gibson Owen Gibson Jeff Gigstad Murray Gilhooly Victor Gilliam<br />
Melissa Gillispie Michael Goad Frank Gomez Jose Gonzalez Rosa Gonzalez Jeffrey Gordon Casey Gordy Linda Goroniuk Mark Gorski Lisa Gosine-Alleyne Lindsay Gowan Vickie Graham Patricia Granger<br />
Doris Grau Dortha Gray Katherine Gray Eldon Greanya Jayne Green Rickey Green Ruth Green Norma Greenlee James Gregory Julie Grey Wendi Grieve Dana Griffin Mary Grisaffi Larry Gross Nicholas Groves<br />
Joseph Guerrero John Guillot Michelle Gummelt Emelia Guzman Laura Guzman Lula Hain Kent Hale Leta Hale Vivi Ann Hall Robert Halverson Phillip Hampton Debbra Hamre Susan Hanselman Andrew Hanson<br />
Kevin Hanzel Ricky Hardaway Jeffery Harmon Robert Harp Jamie Harris Joe Harris Kristina Harris Steven Harrison Burton Hartley Lance Hartwell Tracy Hartzog John Haskins Mark Hately James Hatfield<br />
Tammy Hatfield Michele Hatz Gina Hauck Debbie Haugen Darcy Hawkins Gordon Haycraft Susan Haynes Indira Heeralal Roy Hefley Michael Heil Lloyd Helms Jennifer Henderson Ronald Henderson Bryan Hendricks<br />
Bryan Hennigan Carla Henry Dan Henry James Henry Richard Henry Bernadette Hernandez Eduardo Hernandez Irene Herrera Stephen Hertig Billy Hester Tom Heydt Deborah Hibler Vicki Hietpas John Hill<br />
Elise Hillman Stephen Himes Linda Hoagland Randy Hodgins James Hodgson Garett Hodne Chris Hoefer Deanna Hoffman Myron Hoffman Danny Holgate Wayne Holt Tyler Homan Helen Hosein-Mulloon<br />
Glenn Howard Stephen Howell Adriana Howells William Howells Andrew Hoyle Donna Hradil Robert Hubbert Frank Hudec John Hudec Brandy Hudson Carolyn Hughes Deanne Hulquist Wan-Hsiang Hung<br />
Barry Hunsaker D'Undra Hunter Michael Huntington Timothy Hutchins Raymond Ingle Greg Ingram Kathleen Insley Michael Isaacs Elizabeth Ivers Diana Jablonski Herschel Jackson Kenneth Jackson<br />
Melinda Jackson Ronnie Jackson Camille Jacobs George James Ann Janssen Darryl Janssen Lonnie Jeannerett Donna Jenkins Lee Jenkins Donna Jensen M. Teresa Jimenez Craig Jobe Bruce Johnson<br />
Corby Johnson Courtney Johnson Deborah Johnson Donna Johnson Janet Johnson Joyce Johnson Sonya Johnson John Johnston Patricia Johnston Vickie Jolley Amy Jones Calvert Jones Dennis Jones<br />
Gregg Jones Linda Jones Matthew Jones Sherry Jones Douglas Jordan Jon Jorgenson Sheryl Joubert James Joyce Sheri Jurecek Astrid Kalmet Teresa Kaplan Terrence Karka Olaf Karlsen Srinivasulu Karnati<br />
Steven Keenan Thomas Keetley Theodore Kelly Howard Kemp Wilbur Kennedy James Kerbow Sara Kerley Eldon Keung Mphatso Khoza Robert Kidney Richard King Rick King Colin Kinniburgh Carol Kirksey<br />
Timothy Kirksey Tracy Kisell Denise Klatt Derek Klein Mildred Kleinschmidt Ronald Knippa David Kocian Anthony Koester Saul Korrodi Joseph Kozeal Nancy Krahn Lynn Krailo Mark Kraus Lisa Krawchuk<br />
Ronald Krieger Anthony Krupa Darcy Kubik Albert Kucharski Shrut Kumar Charles Kunze Sharon Kurzy Kenneth Kuykendall Cyril Lackey Nancy Lackey Ernest LaFlure Jason LaGrega Renee Lagrone<br />
Kwong Yip Lai Gordon Lain Cori Lambert George Lambert Jeffery Landrum Randy Landrum Joseph Landry John Lang Richard Lanning Janice Laughery Bill Laughlin Joan Laury Peggy Lavine Felicia Lawal<br />
Jill Lawhon Renee Lawrence Herman Lawson Lugard Layne Kim-Hue Le Michael LeBaron William Leflar Shelley Leggitt Tommy Lehman Loren Leiker Philip Leimer Charles Lemon Kevin Leonce Brent Lesy<br />
Herman Leung Randolph Lewellen Clara Lewis Gareth Lewis Neil Lewis Allen Light James Ligon Helen Lim Warren Lindland Stephen Lipari Scott Listiak Elaine Lloyd Karen Lockhart Milford Lockwood<br />
Curtis Lodhar David Long Robert Long Mark Longden Lindell Looger David Looney Annel Lopez Ernest Lopez Jerome Lopez Juan Lopez Jonathan Loreco Douglas Love Robert Love Gloria Loveless Allen Luckow<br />
Jeanene Lueckemeyer Damian Lynch Clarissia Lynn Jocelyn Lyrock Mary Maestas Darryl Magnusson Charles Mallary Marla Mallett-Davis Davina Manohar Preston Mansor Donald Manton Tony Maranto<br />
Kenneth Marbach Mara Marchesan Colleen Marples Heather Marshall Jacob Marshall Claudia Martens Debra Martin Patricia Martin Rebecca Martin Thelma Martin Antonio Martinez Sergio Martinez Kelly Mason<br />
John Massie Cathy Mathias Mark Mathias Beverly Matthews Mervin Matus David May Jeffrey May Michelle Mayo Vicki McAteer Robert McAuley Naomi McBeath Ronald McBee George McBride Marilyn McCall<br />
Christopher McCarthy Ricky McCaslin Kenn McComb Michael McCown Thomas McCray Daniel McCright Karen McDaniel Terri McDearman John McDonald Richard McGough Jay McIntyre Kenneth McKinley<br />
James McKinney Beverly McMahan Tolliver McNeill Megan McWhorter Linda Meade David Meadows John Mears Joseph Meeks John Melby David Men Marilyn Merryweather David Metzner Gail Meyer<br />
Rachel Meyer Tina Meyer Eloise Meza Greer Mick Kenneth Middlemiss Rudy Mikulec Jill Miller Matthew Miller Toni Miller Robert Milne David Minions Sheila Mirich Karen Mitchell Chris Moffat Terence Mok<br />
Lisa Molinar Steven Molitor Anthony Monariti Steven Montez Delores Montoya Judith Montoya Aramis Morales Gerson Morales Ronald Morgan William Morgan Douglas Morgareidge Andrew Morris William Morris<br />
Kristin Morton Richard Morton Michael Moton Pat Moya Douglas Mueller Arthur Mullenax Michael Mullins Edward Mumford Alonzo Munoz Linda Munoz Robert Munoz Thomas Murphy Patrick Murtagh<br />
Daniel Murton Ramey Musgrave Christopher Myers Amanda Naaykens Harrienarine Nanan Shareen Nash Corina Neagu Heather Nealson Daniel Needham Todd Neely Brian Neemar Barbara Nelligan Jimmy Nelson<br />
Shona Ness Adrian Neumann Kevin Newberry John Nicholas Judy Nichols Mark Nicholson Thomas Nielsen Richard Nies Juan Nieto Orrison Niles Xiaomei Ning Sherly Nissing Benjamin Nolan Joel Noronha<br />
Murray Novak Lori Nugent Timothy Nugent Janie Null Terry Nunn Martha Nutter Claude Oberholzer Alison Oblinger Kolton Obritsch Lori Odom John O'Donnell Julie Ogren Michelle Oliver Daniel Olson<br />
Peter O'Mara David O'Neill Carmen Oney D. Alexander Orr Jay Orr Richard Ott Jacky Ouin Ray Owsley Andrew Pakes Debra Palmer Douglas Palmer John Palmer Mike Palmquist Elizabeth Panfely Mark Papa<br />
Tracy Pape Kevin Parker Wendy Parker Theodore Parrish Curtis Parsons Michael Partin Antony Passaro Barbara Paul William Pauly Brenda Payne Debrah Payne Brent Pears Annette Pearsall Richard Pedder<br />
Paul Pendleton Katherine Perez Kim Perez Stacy Perez Sandra Perko Narine Persad Vanessa Pete Joseph Peter Donald Peters James Peterson Russell Petry Timothy Petta James Pettibone Kevin Pfister<br />
Dorothy Pflughaupt Georgia Phillips Sammy Pickering Silvestre Pineda Karen Pitman Lisa Pittman Donald Pitts Darcy Poncsak Batina Poorbaugh Kyla Porche Earnest Powell Virginia Powers Donald Presenkowski<br />
Debbie Price Susan Price Ralph Proksell Peter Pumilia James Pusley Michael Quinn Shelley Quiring Shawn Racca Marjorie Rael Elizabeth Ramirez Rodolfo Ramirez Ann Ramlochan Gregory Ramsey Keith Rasmussen<br />
Rance Rasmussen Stanley Rauh David Rawlins Jimmy Redfearn Gilberda Reed Cheryl Reese Anna Reeves Kathleen Reeves Derek Reiber Kelly Reiber Brandi Reiling Terry Rekdal Colleen Remenda Fred Rhodes<br />
Richard Rhodes Ronald Richard Clarence Ries Jerry Rietveld Cris Riley Jeffrey Risinger Earl Ritchie Roy Roach Wilbur Roane Marvin Roark Clifford Roberts Rita Robicheaux Bettie Robinson Carl Robinson<br />
Lynita Robinson Samuel Robinson Kaye Rockel Elitha Rocke-Maharaj Jeanne Rodgers Debra Rodieck David Rolando Linda Romano Cindi Rosenau Vicki Ross Tara Rosser Sarah Rotermann Patricia Roufs<br />
Bridget Row Kelly Roy Kenneth Roy Kristie-Anne Royal Stephen Ruiz Douglas Runkel Karen Rushforth Jeanette Rutherford Paul Sacco David Saldivar Ellen Saldivar Ivan Salick Gina Salinas Linda Samford<br />
David Sammons Inocente Sanchez Bobby Sanders Danny Sandifer Marikay Saranthus Edgar Sarmiento Roderick Sauter James Schaefer Brenda Schamehorn Rick Schatz Wendi Scheier Darla Schmaltz<br />
Jerry Schmaltz Jamie Schmid Brian Schmidt Gerald Schneider Shane Schneider Keith Schnurer Shaun Schnurer Curtis Schoenfeld Margaret Schroeder Helen Schroller Leann Schroller Paul Schuler Bobby Schultz<br />
Frederick Schultz Alfreda Schulz Charles Schwab Michael Schween Kim Schwoerke Dolores Scotka Andrew Scott Marion Sczykutowicz Urban Seay Edmund Segner Brian Sehn Mel Sehn Timothy Seiple<br />
Markie Senn Hector Serna Roxana Serpa Bodee Sessions Larry Seymour Gregory Shaffer Pamela Shaffer Eneta Sharma Douglass Sharp Alison Sharratt Donald Shaw John Sheehan Donald Shelden Ted Shell<br />
Sidney Shepperd Tracy Shipp Dale Short Michael Sickon Jacqueline Sides Daryl Siebens Teena Simmons Ria Singh-Date Sallie Singleton Trent Skelton Robert Slavens Gary Slusher Joseph Smathers<br />
Linda Smedlund Ace Smith Charles Smith Delmer Smith Gary Smith Heather Smith Kevin Smith Paula Smith Robert Smith Shawn Smith Sheila Smith Thomas Smith Cheryle Snow Janie Snyder Katherine Sohns<br />
Larry Solomon Billie Sowle Anslem Spears Debra Spears William Speer Jeff Spencer John Spradley Stephanie Spriggins Terrie Springman Alan Stacy Manuel Staffero Jack Staley Randall Stanger Bridgett Staples<br />
Morgan Steele Patti Steely Walter Stefanik Verna Stein Brenda Stephens Robert Sterling Martha Sterner Carrie Stevens Phillip Stevens Rodney Steward Carly Stewart Kent Stewart Kenneth Stillman Jerry Stinson<br />
Rex Stout Scott Stovin Hugh Stowe Cindy Stowell Jeffrey Strausser Elton Street John Studt Jason Sugg Suvarna Sule Gary Superville David Swauger David Sweeley Richard Swimm Sundai Swinney<br />
James Szenasy Valarie Taber Dara Tatum Deborah Taylor Edward Taylor Heidi Taylor Jeane Taylor Kenneth Taylor Nick Taylor Ralph Telford James Terando Eileen Thoede Gary Thomas J. Layton Thomas<br />
Kimberly Thomas Melva Thomas Rita Thomas William Thomas James Thompson Robert Thompson Mark Thorne Christina Thring Dewayne Tidwell Joseph Tigner Gina Tobey Brent Tocher Brian Tompkins<br />
Kelly Tompkins Ola Tompkins Patrick Tower Dominico Tran Jennifer Tran Linda Tran Tuongvan Tran Steven Travis Marcus Trevino David Trice Jonell Trodlier Delbert Trolinder John Troschinetz Joseph Troupe<br />
Bella Trudel Linda Tucker Dan Tuer Valerie Tuitt Cameron Turnbull Linda Turner Sonja Turner Lawrence Tuttle Zane Tymrick Tull Umphres Sherry Upton Andrea Urciuoli Vance Utri David Vague Brian Valencia<br />
Michael VanHorn Cynthia VanRanken Michael Vargo Martha Varice Terry Vaughn Evelyn Vauthier Jennifer Vega Emiliano Vela Mark Verhoeve George Vieira Cheryl Vierling Timothy Vogler Andrew Volk Prody Vong<br />
Bruce Voshall George Vouronikas Denise Wade Dallas Wagner Frederic Wagner Dennis Wagstaff Roger Wainwright Deborah Wakeford Matthew Walden Paula Waldo Julie Walker Wanda Walls Joseph Walthall<br />
Deborah Walther Cynthia Walton Martin Wang Allan Wanner Ralph Warby Laura Wardlaw William Wardlaw Freddie Warren Andrew Washburn Alan Watkins Karon Watson Steven Weatherl Robert Weeks<br />
Kenneth Weiland Tyson Weinberger Amanda Weishuhn Michael Welch William Weldon Katherine Wells Nathan Wells Ronald Wells Steven Wentworth Jeffrey Wenz Kari Wenz Robert West Davette Weston<br />
Erica Westphalen James Whaley George Wheat Leesa White Michael White Stephen White Alison Whiteley Melanie Whitlock Donald Whitmer Richard Whittingham John Wilkins Nancy Wilkins Dan Wilkirson<br />
Cheryl Williams Raymond Williams Steven Williams Rachelle Willis Alicia Wilson Daniel Wilson Danny Wilson Frank Wilson James Wilson James Wilson Leila Wilson Robert Wilson Thomas Wilson Walter Wilson<br />
William Winkelman Sharron Winter Anna Wojtowicz Barbara Wood Pat Woods David Work Lloyd Woychuk David Wright David Wright Angela Wysocki Theresa Wysocki Michael Ybarra Angie Young Craig Young<br />
Qian Yu Jeffrey Zawila Craig Zempel Barry Zinz
333 Clay Street, Suite 4200<br />
Houston, Texas 77002<br />
P.O. Box 4362<br />
Houston, Texas 77210–4362<br />
(713) 651-7000<br />
www.eogresources.com<br />
<strong>EOG</strong> <strong>Resources</strong>, <strong>Inc</strong>. 2004 Annual Report to Shareholders