Protocol for Establishing and Maintaining the Calibration - NPL ...
Protocol for Establishing and Maintaining the Calibration - NPL ...
Protocol for Establishing and Maintaining the Calibration - NPL ...
You also want an ePaper? Increase the reach of your titles
YUMPU automatically turns print PDFs into web optimized ePapers that Google loves.
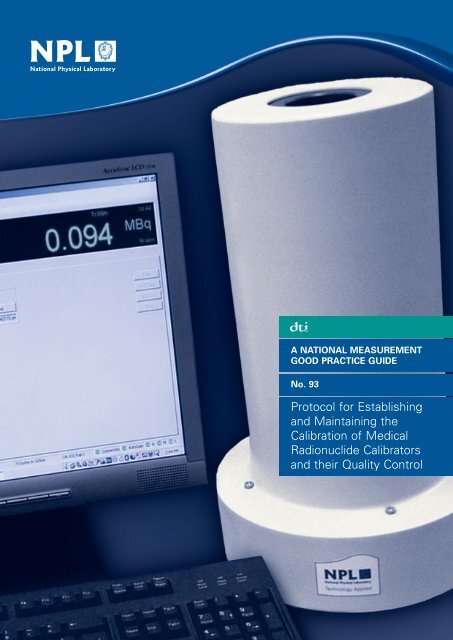
A NATIONAL MEASUREMENT<br />
GOOD PRACTICE GUIDE<br />
No. 93<br />
<strong>Protocol</strong> <strong>for</strong> <strong>Establishing</strong><br />
<strong>and</strong> <strong>Maintaining</strong> <strong>the</strong><br />
<strong>Calibration</strong> of Medical<br />
Radionuclide Calibrators<br />
<strong>and</strong> <strong>the</strong>ir Quality Control
The DTI drives our ambition of<br />
‘prosperity <strong>for</strong> all’ by working to<br />
create <strong>the</strong> best environment <strong>for</strong><br />
business success in <strong>the</strong> UK.<br />
We help people <strong>and</strong> companies<br />
become more productive by<br />
promoting enterprise, innovation<br />
<strong>and</strong> creativity.<br />
We champion UK business at home<br />
<strong>and</strong> abroad. We invest heavily in<br />
world-class science <strong>and</strong> technology.<br />
We protect <strong>the</strong> rights of working<br />
people <strong>and</strong> consumers. And we<br />
st<strong>and</strong> up <strong>for</strong> fair <strong>and</strong> open markets<br />
in <strong>the</strong> UK, Europe <strong>and</strong> <strong>the</strong> world.<br />
This Guide was developed by <strong>the</strong> National<br />
Physical Laboratory on behalf of <strong>the</strong> NMS.
Measurement Good Practice Guide No. 93<br />
<strong>Protocol</strong> <strong>for</strong> <strong>Establishing</strong> <strong>and</strong> <strong>Maintaining</strong> <strong>the</strong> <strong>Calibration</strong> of<br />
Medical Radionuclide Calibrators <strong>and</strong> <strong>the</strong>ir Quality Control<br />
Prepared by a joint working party composed of representatives from <strong>the</strong> following:<br />
Institute of Physics <strong>and</strong> Engineering in Medicine<br />
Ionising Radiation Metrology Consultants Ltd<br />
National Physical Laboratory<br />
R GADD (1) (Chairman), M BAKER (2) (Secretary), K S NIJRAN (3), S OWENS (4),<br />
W THOMSON (5), M J WOODS (6) <strong>and</strong> F ZANANIRI (7)<br />
(1) University Hospital of North Staf<strong>for</strong>dshire, Stoke-on-Trent, Staf<strong>for</strong>dshire, ST4 7LN<br />
(2) National Physical Laboratory, Teddington, Middlesex, TW11 0LW<br />
(3) Hammersmith Hospitals NHS Trust, London, W12 0HS<br />
(4) North Western Medical Physics, Christie Hospital, Manchester, M20 4BX<br />
(5) S<strong>and</strong>well <strong>and</strong> West Midl<strong>and</strong>s Hospital Trust, Birmingham, West Midl<strong>and</strong>s, B18 7QH<br />
(6) Ionising Radiation Metrology Consultants Ltd, Teddington, Middlesex, TW11 0LW<br />
(7) Bristol General Hospital, Bristol, Avon, BS1 6SY<br />
ABSTRACT<br />
Guidance is given on <strong>the</strong> quality controls that should be undertaken on a routine basis <strong>for</strong><br />
medical radionuclide calibrators to ensure <strong>the</strong> accuracy <strong>and</strong> traceability of measurements of<br />
<strong>the</strong> activities of radiopharmaceuticals. Sources of error <strong>and</strong> magnitudes of associated<br />
uncertainties are discussed.
© Crown Copyright 2006<br />
Reproduced by permission of <strong>the</strong> Controller of HMSO<br />
ISSN: 1368-6550<br />
May 2006<br />
National Physical Laboratory<br />
Teddington, Middlesex, United Kingdom TW11 0LW<br />
Website: www.npl.co.uk
FOREWORD<br />
This Good Practice Guide describes <strong>the</strong> use of radionuclide calibrators <strong>for</strong> <strong>the</strong> measurement<br />
of radionuclides used in medical practice <strong>and</strong> how all measurements made using <strong>the</strong>se<br />
systems can be traced to primary measurement st<strong>and</strong>ards held at <strong>the</strong> National Physical<br />
Laboratory (<strong>NPL</strong>). Accurate measurements <strong>and</strong> <strong>the</strong>ir traceability to primary st<strong>and</strong>ards<br />
toge<strong>the</strong>r with a documented quality assurance programme are requirements of both <strong>the</strong><br />
Ionising Radiation Regulations, 1999[1] <strong>and</strong> <strong>the</strong> Ionising Radiations (Medical Exposures)<br />
Regulations, 2000 [2].<br />
In 1992, <strong>the</strong> Institute of Physical Sciences in Medicine (IPSM) addressed <strong>the</strong> issue of Quality<br />
St<strong>and</strong>ards in Nuclear Medicine <strong>and</strong> published <strong>the</strong>ir recommendations in IPSM Report No. 65,<br />
Chapter 5 [3]. This section of <strong>the</strong> report was produced by a joint Working Group, comprising<br />
members of IPSM <strong>and</strong> <strong>NPL</strong>, which dealt specifically with <strong>the</strong> establishment <strong>and</strong> maintenance<br />
of <strong>the</strong> calibration of medical radionuclide calibrators <strong>and</strong> <strong>the</strong>ir quality control. Since <strong>the</strong>n,<br />
new measurement needs have arisen <strong>and</strong> commercially available calibrators have been<br />
improved <strong>and</strong> upgraded. It was agreed that <strong>the</strong> original recommendations should be revised<br />
<strong>and</strong> updated accordingly.<br />
The Institute of Physics <strong>and</strong> Engineering in Medicine (IPEM) <strong>and</strong> <strong>the</strong> <strong>NPL</strong> established a<br />
fur<strong>the</strong>r Working Group in 2001 to revise <strong>the</strong> existing guidelines <strong>and</strong> to produce a good<br />
practice guide <strong>for</strong> users of radionuclide calibrators in hospitals. The recommended<br />
procedures are intended <strong>for</strong> use in busy hospital departments <strong>and</strong> should not add appreciably<br />
to <strong>the</strong> existing workload. The emphasis has continued to be simple, robust <strong>and</strong> reliable<br />
procedures.<br />
The revision comprises two chapters. Chapter 1 includes most of <strong>the</strong> existing procedures<br />
whilst Chapter 2 provides more detailed descriptions of, <strong>and</strong> justifications <strong>for</strong>, <strong>the</strong> procedures<br />
toge<strong>the</strong>r with relevant examples of possible sources of error <strong>and</strong> <strong>the</strong> typical uncertainties<br />
associated with <strong>the</strong>m.
i<br />
Contents<br />
Quality Assurance & Quality Control Procedures ........................ 1<br />
1.1 Introduction ..................................................................................................................2<br />
1.2 Principles of Traceability .............................................................................................3<br />
1.3 Procedures <strong>for</strong> Quality Control ....................................................................................5<br />
1.3.1 High Voltage ..........................................................................................................6<br />
1.3.2 Display ...................................................................................................................6<br />
1.3.3 Zero Adjust.............................................................................................................6<br />
1.3.4 Background............................................................................................................6<br />
1.3.5 Check Source (Relative Response).........................................................................6<br />
1.3.6 Accuracy ................................................................................................................7<br />
1.3.7 Repeatability ..........................................................................................................7<br />
1.3.8 Subsidiary <strong>Calibration</strong>s .........................................................................................7<br />
1.3.9 Linearity.................................................................................................................8<br />
1.4 Additional Considerations..........................................................................................10<br />
1.4.1 Environmental Requirements...............................................................................10<br />
1.4.2 Power Requirements ............................................................................................10<br />
1.4.3 Shielding ..............................................................................................................10<br />
1.5 Quality Assurance <strong>and</strong> Documentation......................................................................10<br />
1.5.1 Authorisations......................................................................................................12<br />
1.5.2 Non-con<strong>for</strong>mances ...............................................................................................12<br />
1.5.3 Documentation.....................................................................................................12<br />
Uncertainties & Sources of Error ..........................................13<br />
2.1 Introduction ................................................................................................................14<br />
2.2 <strong>Calibration</strong>..................................................................................................................16<br />
2.2.1 <strong>Calibration</strong> factor ................................................................................................16<br />
2.2.2 Chamber wall thickness .......................................................................................16<br />
2.3 Electronics..................................................................................................................17<br />
2.3.1 Inherent accuracy ................................................................................................17<br />
2.3.2 Linearity...............................................................................................................17<br />
2.3.3 Range changing ...................................................................................................17<br />
2.4 Statistical ....................................................................................................................18<br />
2.5 Activity.......................................................................................................................19<br />
2.5.1 High Activity ........................................................................................................19<br />
2.5.2 Low activity <strong>and</strong> background...............................................................................20<br />
2.6 Shielding.....................................................................................................................21<br />
2.7 Container <strong>and</strong> Source Effects .....................................................................................21<br />
2.7.1 Container wall thickness......................................................................................21<br />
2.7.2 Container Types...................................................................................................22<br />
2.7.3 Volume ................................................................................................................24<br />
2.7.4 Position ................................................................................................................25<br />
2.7.5 Density .................................................................................................................26<br />
2.7.6 Homogeneity ........................................................................................................26<br />
2.7.7 Adsorption............................................................................................................26
ii<br />
2.8 Radionuclide Purity....................................................................................................27<br />
2.9 Nuclear Data...............................................................................................................29<br />
2.10 Simulated Sources ......................................................................................................29<br />
2.11 Specific Problem of Assaying Pure Beta Emitters.....................................................30<br />
References .....................................................................31<br />
List of Tables<br />
Table 1.1 Acceptable calibration tolerances <strong>for</strong> reference <strong>and</strong> field instruments..............5<br />
Table 1.2 Recommended frequencies <strong>for</strong> measuring radionuclide calibrator per<strong>for</strong>mance<br />
parameters..........................................................................................................5<br />
Table 1.3 Results of UK hospital comparisons................................................................11<br />
Table 2.1 Principal Sources of Uncertainty .....................................................................15<br />
Table 2.2 Typical state-of-<strong>the</strong>-art uncertainties <strong>for</strong> primary st<strong>and</strong>ards ............................16<br />
Table 2.3 Change in response of an aluminium-wall ionization chamber with an<br />
additional aluminium layer between <strong>the</strong> source <strong>and</strong> chamber .........................17<br />
Table 2.4 Variation of radionuclide calibrator response with shielding/backscatter.......21<br />
Table 2.5 Typical glass vials (All dimensions in mm) ....................................................22<br />
Table 2.6 Change in response of an <strong>NPL</strong> ionization chamber with variation in wall<br />
thickness of glass vials.....................................................................................22<br />
Table 2.7 Differences between calibration factors <strong>for</strong> <strong>NPL</strong> Secondary St<strong>and</strong>ard<br />
Radionuclide Calibrator <strong>for</strong> different containers, relative to 10R Schott vials23<br />
Table 2.8 Indicative differences between responses <strong>for</strong> Capintec CRC120 <strong>for</strong> syringes<br />
relative to P6 vials............................................................................................23<br />
List of Figures<br />
Figure 1.1 Radionuclide calibration ....................................................................................2<br />
Figure 1.2 Traceability <strong>and</strong> equivalence .............................................................................4<br />
Figure 2.1 Effects of inherent accuracy, linearity <strong>and</strong> range changing in electrometers ..18<br />
Figure 2.2 Effects of recombination..................................................................................20<br />
Figure 2.3 Volume correction factors <strong>for</strong> <strong>the</strong> <strong>NPL</strong> SSRC <strong>for</strong> 10R Schott,<br />
Type +1 vials ...................................................................................................24<br />
Figure 2.4 The spatial sensitivity of a typical ionisation chamber to a point source. .......25<br />
Figure 2.5<br />
Variation in response <strong>for</strong> radial <strong>and</strong> axial displacements of 3 ml solution in<br />
5 ml ampoule <strong>for</strong> <strong>NPL</strong> secondary st<strong>and</strong>ard radionuclide calibrator ...............26
Quality Assurance<br />
& Quality Control<br />
Procedures<br />
11<br />
IN THIS CHAPTER<br />
• Introduction<br />
• Principles of traceability<br />
• Procedures <strong>for</strong> quality control<br />
» High voltage<br />
» Display<br />
» Zero adjust<br />
» Background<br />
» Check source (Relative Response)<br />
» Accuracy<br />
» Repeatability<br />
» Subsidiary calibrations<br />
» Linearity<br />
• Additional considerations<br />
» Environmental requirements<br />
» Power requirements<br />
» Shielding<br />
• Quality assurance <strong>and</strong> documentation<br />
» Authorisations<br />
» Non-con<strong>for</strong>mances<br />
» Documentation
2 Good Practice Guide 93 Chapter 1<br />
1.1 Introduction<br />
Radioactive materials are widely used in hospitals <strong>for</strong> diagnostic <strong>and</strong> <strong>the</strong>rapeutic purposes. It is<br />
important that <strong>the</strong> activity of <strong>the</strong> radioactive material should be accurately determined prior to<br />
administration to a patient. The principal instrument used to assay <strong>the</strong> radioactivity is <strong>the</strong><br />
radionuclide calibrator (see Figure 1.1).<br />
This instrument normally consists of:<br />
(a)<br />
(b)<br />
(c)<br />
(d)<br />
(e)<br />
Well-type ionisation chamber<br />
Stabilised high voltage supply<br />
Electrometer <strong>for</strong> measuring <strong>the</strong> small ionisation currents<br />
Processing electronics<br />
Display device<br />
Figure 1.1<br />
Radionuclide calibration<br />
Sample<br />
High voltage<br />
supply<br />
DDD.D<br />
MBq<br />
Ionisation<br />
chamber<br />
Electrometer,<br />
processor, display<br />
An ionisation chamber consists essentially of two electrodes at a potential difference of several<br />
hundred volts <strong>and</strong> insulated from each o<strong>the</strong>r by an envelope of gas. Most chambers are sealed <strong>and</strong><br />
<strong>the</strong> gas is usually at a pressure of several atmospheres. The radioactive sample is placed into a<br />
cavity surrounded by <strong>the</strong> chamber. The passage of ionising radiation through <strong>the</strong> sensitive volume<br />
of <strong>the</strong> calibrator ionises <strong>the</strong> gas, producing an electrical current, <strong>the</strong> magnitude of which is<br />
proportional to <strong>the</strong> activity of radionuclide being assayed. The ratio of <strong>the</strong> current to <strong>the</strong> activity is<br />
normally referred to as <strong>the</strong> calibration factor <strong>for</strong> that radionuclide. The calibration factor is not<br />
only dependent on <strong>the</strong> emissions of <strong>the</strong> radionuclide but also on a number of o<strong>the</strong>r factors,<br />
including, <strong>for</strong> example, <strong>the</strong> nature of <strong>the</strong> container <strong>and</strong> volume of solution. The current that is<br />
generated between <strong>the</strong> electrodes typically ranges from 10’s of femtoamperes (fA) up to perhaps<br />
microamperes (μA) – a dynamic range of 10 8 . The electrometer in <strong>the</strong> radionuclide calibrator has<br />
to be capable of making accurate measurements over this large dynamic range.
Chapter 1 Good Practice Guide 93 3<br />
Radionuclide calibrators were originally designed <strong>for</strong> <strong>the</strong> measurement of <strong>the</strong> activity of gammaemitting<br />
radionuclides in solution. Since those early days, <strong>the</strong>ir use has been extended to <strong>the</strong><br />
activity assay of high-energy pure beta emitters (e.g. 32 P, 89 Sr <strong>and</strong> 90 Y) as well as to <strong>the</strong> dose assay<br />
of Low Dose Rate <strong>the</strong>rapeutic sources (e.g. 125 I prostate seeds, 137 Cs needles <strong>and</strong> 192 Ir wires).<br />
Although general principles in this document apply equally to <strong>the</strong> assay of <strong>the</strong>se new sources,<br />
sources of this type are not specifically covered by this document.<br />
It is important that <strong>the</strong> calibrator user answers several questions be<strong>for</strong>e using a calibrator:<br />
(a)<br />
(b)<br />
(c)<br />
(d)<br />
(e)<br />
(f)<br />
(g)<br />
(h)<br />
Are <strong>the</strong> calibration factors traceable to national st<strong>and</strong>ards <strong>and</strong> is <strong>the</strong>re documented evidence to<br />
support this?<br />
What is <strong>the</strong> overall uncertainty that is needed <strong>for</strong> <strong>the</strong> activity of any particular radionuclide?<br />
Do <strong>the</strong> calibration factors apply to <strong>the</strong> volumes <strong>and</strong> containers being used in practice? If not,<br />
are accurate correction factors available <strong>and</strong> what additional uncertainties do <strong>the</strong>y introduce?<br />
What are <strong>the</strong> ranges of activity that can be assayed within <strong>the</strong> declared uncertainty limits?<br />
Is <strong>the</strong>re a long-lived check source available, <strong>the</strong> response to which has been documented<br />
when <strong>the</strong> system was first calibrated?<br />
Can <strong>the</strong> system response be adjusted easily to ensure that <strong>the</strong> response is <strong>the</strong> same as when<br />
<strong>the</strong> system was first calibrated?<br />
Is <strong>the</strong> effect of secondary shielding around <strong>the</strong> chamber known?<br />
If <strong>the</strong> electrometer or ionisation chamber has been replaced, has <strong>the</strong> system been recalibrated<br />
<strong>for</strong> all calibration factors?<br />
Such considerations should be considered in <strong>the</strong> selection process when a calibrator is being<br />
purchased <strong>and</strong> tests may need to be undertaken to confirm that <strong>the</strong> declared specifications are met.<br />
However, it is equally important that <strong>the</strong>se specifications continue to be met throughout <strong>the</strong> useful<br />
life of <strong>the</strong> calibrator. The procedures detailed in this chapter are those that are recommended as <strong>the</strong><br />
minimum requirements of a quality assurance system that will confirm <strong>the</strong> initial <strong>and</strong> ongoing<br />
validity of <strong>the</strong>se specifications.<br />
1.2 Principles of Traceability<br />
Traceability is defined as “The property of a result or a measurement whereby it can be related to<br />
appropriate st<strong>and</strong>ards, generally international or national st<strong>and</strong>ards, through an unbroken chain of<br />
comparisons” [4]. In <strong>the</strong> context of nuclear medicine <strong>and</strong> its associated statutory obligations,<br />
calibration factors should be traceable (<strong>for</strong> each radionuclide that is to be used) to <strong>the</strong> national<br />
primary st<strong>and</strong>ards of radioactivity. National primary st<strong>and</strong>ards are normally maintained by <strong>the</strong>
4 Good Practice Guide 93 Chapter 1<br />
relevant National Metrology Institute (NMI). In <strong>the</strong> UK, <strong>the</strong> NMI is <strong>the</strong> National Physical<br />
Laboratory in Teddington. The NMI confirms <strong>the</strong> accuracy of its st<strong>and</strong>ards by comparisons with<br />
<strong>the</strong> NMIs of o<strong>the</strong>r countries: <strong>the</strong>se are organised by <strong>the</strong> Bureau International des Poids et Mesures<br />
(BIPM), <strong>the</strong> world measurement st<strong>and</strong>ards authority. This process is generally described as <strong>the</strong><br />
establishment of Equivalence (see Figure 1.2):<br />
Figure 1.2<br />
Traceability <strong>and</strong> equivalence<br />
← E Q U I V A L E N C E →<br />
NIST<br />
(USA)<br />
⇔<br />
<strong>NPL</strong><br />
(UK)<br />
Secondary<br />
St<strong>and</strong>ards<br />
Laboratory<br />
Reference<br />
Instrument<br />
Field<br />
Instrument<br />
⇔<br />
PTB<br />
(DE)<br />
⇔<br />
LNHB<br />
(FR)<br />
⇔<br />
⇔<br />
↑<br />
T<br />
R<br />
A<br />
C<br />
E<br />
A<br />
B<br />
I<br />
L<br />
I<br />
T<br />
Y<br />
↓<br />
There are a number of ways in which traceability can be established <strong>and</strong> <strong>the</strong> uncertainty associated<br />
with <strong>the</strong> calibration factor will depend to a large degree on <strong>the</strong> calibration method used. Two<br />
possible calibration methods used by manufacturers are:<br />
(a)<br />
(b)<br />
The master system is calibrated <strong>for</strong> each radionuclide using primary st<strong>and</strong>ards.<br />
The manufacturer determines of <strong>the</strong> calibration factors <strong>for</strong> a typical production calibrator <strong>for</strong> a<br />
restricted range of radionuclides using traceable st<strong>and</strong>ards. The response-energy curve is <strong>the</strong>n<br />
calculated <strong>and</strong> calibration factors <strong>for</strong> all radionuclides are calculated from knowledge of <strong>the</strong>ir<br />
radiative emissions <strong>and</strong> <strong>the</strong> response curve. Additional uncertainties <strong>the</strong>n need to be included<br />
to allow <strong>for</strong> manufacturing differences between <strong>the</strong> “typical” calibrator <strong>and</strong> all o<strong>the</strong>r<br />
production models.<br />
These two examples might be regarded as <strong>the</strong> extremes in terms of <strong>the</strong> resultant uncertainties on<br />
individual calibration factors. There are o<strong>the</strong>r options <strong>and</strong> <strong>the</strong>se can also be supplemented by<br />
subsequent calibrations <strong>and</strong> comparisons that will provide opportunities to reduce <strong>the</strong>se<br />
uncertainties.<br />
A practical method to ensure traceability to <strong>the</strong> national st<strong>and</strong>ard is to calibrate, at least annually,<br />
<strong>the</strong> routine instrument (field instrument) against a reference instrument. This can be a “secondary<br />
st<strong>and</strong>ard” instrument <strong>for</strong> which nationally traceable measurements are available <strong>for</strong> a
Chapter 1 Good Practice Guide 93 5<br />
comprehensive range of radionuclides, geometries <strong>and</strong> activities. Alternatively a reliable routine<br />
instrument that has been individually calibrated <strong>for</strong> <strong>the</strong> full range of radionuclides <strong>for</strong> which it is to<br />
be a reference could be used. Typical acceptable tolerances <strong>for</strong> reference <strong>and</strong> field instruments are<br />
shown in Table 1.1.<br />
Table 1.1<br />
Acceptable calibration tolerances <strong>for</strong> reference <strong>and</strong> field<br />
instruments<br />
Parameter Reference Instrument Field Instrument<br />
Repeatability ± 0.5% (1 s.d.) ± 1% (1 s.d.)<br />
Linearity (over range used) ± 1% (1 s.d.) ± 5% (1 s.d.)<br />
Accuracy<br />
High energy & gamma<br />
(> 100 keV)<br />
Low energy & gamma<br />
(< 100 keV)<br />
± 2% (range) to secondary<br />
st<strong>and</strong>ard<br />
± 5% (range) to secondary<br />
st<strong>and</strong>ard<br />
± 5% (range) to reference<br />
± 10% (range) to reference<br />
1.3 Procedures <strong>for</strong> Quality Control<br />
Several parameters must be assessed to confirm that <strong>the</strong> radionuclide calibrator meets its<br />
per<strong>for</strong>mance requirements. The most thorough assessment will be made during acceptance testing.<br />
Thereafter, less extensive measurements may be sufficient to confirm that <strong>the</strong>re has been no<br />
significant change in per<strong>for</strong>mance. However, if <strong>the</strong> per<strong>for</strong>mance changes or <strong>the</strong>re have been major<br />
repairs, <strong>the</strong> detailed measurements required <strong>for</strong> acceptance testing must be repeated. The<br />
recommended frequency <strong>for</strong> checking each aspect of calibrator per<strong>for</strong>mance is indicated in Table<br />
1.2.<br />
Table 1.2<br />
Recommended frequencies <strong>for</strong> measuring radionuclide calibrator<br />
per<strong>for</strong>mance parameters.<br />
Acceptance Daily Monthly Annually<br />
High voltage <br />
Display <br />
Zero adjust <br />
Background <br />
Check source (Relative Response) <br />
Accuracy <br />
Repeatability <br />
Subsidiary calibrations <br />
Linearity <br />
Details of how <strong>the</strong> various measurements may be made are described below.
6 Good Practice Guide 93 Chapter 1<br />
1.3.1 High Voltage<br />
If it is possible to display <strong>the</strong> high voltage, its value should be recorded to note any drift<br />
(particularly downwards) or to compare with <strong>the</strong> manufacturers tolerances. If <strong>the</strong> display is not<br />
available, measurement of <strong>the</strong> check source may indicate if a problem exists. With low activities, a<br />
small change in voltage will have little effect on <strong>the</strong> measurement. However, <strong>the</strong> same change in<br />
voltage can have a large effect on <strong>the</strong> measurement of high activities. This is because<br />
recombination effects in <strong>the</strong> ion chamber change with voltage <strong>and</strong> are important at high currents.<br />
1.3.2 Display<br />
If <strong>the</strong>re is a segmented display, <strong>the</strong>re should be a facility to check that all segments are operating<br />
correctly.<br />
1.3.3 Zero Adjust<br />
This facility should be checked in accordance with <strong>the</strong> instructions in <strong>the</strong> user manual. It is useful<br />
to record <strong>the</strong> “zero” reading be<strong>for</strong>e any adjustment is made in order to identify any ongoing trend<br />
which suggests that <strong>the</strong> instrument needs repair.<br />
1.3.4 Background<br />
A sufficiently large measurement period, toge<strong>the</strong>r with an appropriate number of significant figures<br />
on <strong>the</strong> display, should be used <strong>for</strong> <strong>the</strong> background measurement. The magnitude of <strong>the</strong> background<br />
should be noted daily <strong>and</strong> compared against previous values (ideally a control chart should be<br />
maintained) or against a control value. Acceptable variations need to be determined by a series of<br />
repeated benchmark measurements at <strong>the</strong> installation stage. Background measurements should be<br />
made with <strong>the</strong> source holder in <strong>the</strong> chamber.<br />
If <strong>the</strong> measured background is higher than expected this may be due to contamination of <strong>the</strong><br />
chamber/ source holder/ liner or because of <strong>the</strong> presence of large sources nearby.<br />
1.3.5 Check Source (Relative Response)<br />
It is important that a long-lived radioactive check source is available <strong>and</strong> measured on a regular<br />
basis. These sources should be chosen <strong>for</strong> <strong>the</strong>ir long half-lives <strong>and</strong> <strong>the</strong> absence of any significant<br />
radioactive impurity. Typical sources used are 137 Cs (half-life = 30 years), 57 Co (half-life = 270<br />
days) or 226 Ra (half-life = 1600 years). However, sources such as 57 Co, which do contain<br />
impurities, have altered effective half-lives <strong>and</strong> so must be treated with caution. The check source<br />
initially checks <strong>the</strong> response of <strong>the</strong> overall system (chamber + electrometer) against a benchmark<br />
value, which is established when <strong>the</strong> system is first installed. A record should be kept of <strong>the</strong> daily<br />
checks <strong>and</strong> any adjustments documented. Daily measurements of <strong>the</strong> responses to a check source<br />
need only be per<strong>for</strong>med <strong>for</strong> instrument nuclide settings corresponding to <strong>the</strong> radionuclides, which<br />
will be measured on that day.<br />
This check gives a measure of <strong>the</strong> reproducibility [4] <strong>for</strong> day to day measurements of <strong>the</strong> ionisation<br />
chamber <strong>and</strong> electrometer combination. If checks indicate that <strong>the</strong> response suffers large r<strong>and</strong>om<br />
variations, this may suggest an inherent instability in <strong>the</strong> electrometer. If <strong>the</strong>re is an ongoing trend,<br />
which indicates that <strong>the</strong> response is continually rising (or falling), this could indicate ei<strong>the</strong>r a leak in<br />
<strong>the</strong> pressurised ionisation chamber or a progressive drift of <strong>the</strong> electrometer. In ei<strong>the</strong>r of <strong>the</strong>se<br />
cases an initial compensation could be achieved by adjusting <strong>the</strong> electrometer, but if <strong>the</strong> cumulative<br />
change is greater than 5% it should be repaired: <strong>the</strong> problem may be more than just that arising<br />
from <strong>the</strong> inherent instability of <strong>the</strong> electrometer.<br />
The check source should be a solid source, which is less prone to loss of activity than a solution. It<br />
is important to recognise that <strong>the</strong> check source is NOT a calibration source <strong>for</strong> that radionuclide. It<br />
would generally have different characteristics to those of sources, which are routinely assayed <strong>and</strong>,
Chapter 1 Good Practice Guide 93 7<br />
hence, have a different calibration factor. A check should be made using all <strong>the</strong> instrument nuclide<br />
settings that are to be used that day.<br />
1.3.6 Accuracy<br />
For acceptance testing, reference sources <strong>for</strong> as many relevant radionuclides as practicable should<br />
be obtained. These should normally be in liquid <strong>for</strong>m <strong>and</strong> should be in <strong>the</strong> volume <strong>and</strong> container<br />
<strong>for</strong> which calibration factors have been supplied by <strong>the</strong> manufacturer. If <strong>the</strong>re is a difference<br />
between <strong>the</strong> container/volume specified by <strong>the</strong> manufacturer <strong>and</strong> those routinely used, <strong>the</strong><br />
appropriate procedure described below (Subsidiary <strong>Calibration</strong>s) should be applied. In <strong>the</strong> UK at<br />
<strong>the</strong> time of writing, a volume of 4 ml in a 10R Schott vial is recommended as a reference source.<br />
The activities of reference sources must be traceable to national st<strong>and</strong>ards. This can be achieved by<br />
purchasing such sources ei<strong>the</strong>r from <strong>the</strong> national laboratory (<strong>NPL</strong> in <strong>the</strong> case of <strong>the</strong> UK), or from a<br />
secondary st<strong>and</strong>ard supplier that can guarantee traceability to <strong>the</strong> national laboratory <strong>for</strong> each of <strong>the</strong><br />
reference sources supplied. Alternatively <strong>the</strong> national laboratory can assay samples sent to <strong>the</strong>m<br />
from <strong>the</strong> hospital or, if <strong>the</strong> ionisation chamber is a field instrument, it can be calibrated against a<br />
secondary st<strong>and</strong>ard instrument already traceable to <strong>the</strong> national st<strong>and</strong>ard.<br />
In order to maintain <strong>and</strong> demonstrate traceability, it is essential that all steps are fully documented<br />
in accordance with a quality assurance procedure (Section 1.5)<br />
It is recommended that <strong>the</strong> instrument calibration is checked annually with at least two reference<br />
sources <strong>and</strong> that <strong>the</strong> radionuclides used should vary from year to year. The intention of this rotation<br />
policy should be two-fold. First, it should seek to cover <strong>the</strong> energy range of those radionuclides<br />
which are commonly used <strong>and</strong>, second, it should seek to include, over a reasonable period of time,<br />
all of those radionuclides which are commonly used. For example, a schedule could be as follows:<br />
Year 1:<br />
Year 2:<br />
Year 3:<br />
Year 4:<br />
Year 5:<br />
99m Tc <strong>and</strong> 131 I<br />
201 Tl <strong>and</strong> 67 Ga<br />
123 I <strong>and</strong> 89 Sr<br />
99m Tc <strong>and</strong> 111 In<br />
131 I <strong>and</strong> 90 Y<br />
Where operator preset calibration switches are used, each of <strong>the</strong>se must be checked to ensure it is<br />
operating correctly.<br />
1.3.7 Repeatability<br />
Repeatability [4, 17] is normally expressed as a percentage value (<strong>the</strong> st<strong>and</strong>ard deviation of at least<br />
10 measurements divided by <strong>the</strong> mean <strong>and</strong> multiplied by 100), <strong>and</strong> measured using a source, which<br />
exhibits negligible decay during <strong>the</strong> period of measurement. The sealed check source referred to in<br />
section 1.3.5 is suitable <strong>for</strong> this purpose. The source should not be removed from <strong>the</strong> ionisation<br />
chamber between each measurement. Where more than one time constant is available precision<br />
should be checked <strong>for</strong> each setting. If possible, repeatability should be determined <strong>for</strong> each current<br />
range <strong>for</strong> which <strong>the</strong> calibrator will be used. This can be accomplished using a series of sources with<br />
activities within each measurement range tested.<br />
1.3.8 Subsidiary <strong>Calibration</strong>s<br />
Subsidiary calibrations are those that relate to containers <strong>and</strong> volumes <strong>for</strong> which calibration factors<br />
are not supplied by <strong>the</strong> manufacturer. A procedure to determine <strong>the</strong>se subsidiary calibrations is as<br />
follows.
8 Good Practice Guide 93 Chapter 1<br />
First, measure <strong>the</strong> activity of a solution in <strong>the</strong> st<strong>and</strong>ard container <strong>and</strong> <strong>the</strong>n transfer a known<br />
proportion of <strong>the</strong> liquid to <strong>the</strong> container <strong>for</strong> which <strong>the</strong> calibration is to be determined. The volume<br />
transferred may be determined by accurate weighing be<strong>for</strong>e <strong>and</strong> after transfer. To confirm <strong>the</strong><br />
activity removed, <strong>the</strong> original container can be re-assayed, having first adjusted <strong>the</strong> container to <strong>the</strong><br />
original volume using non-radioactive liquid of <strong>the</strong> same density. Having determined <strong>the</strong> activity<br />
transferred from <strong>the</strong> original container, <strong>the</strong> instrument setting required to display this activity <strong>for</strong> <strong>the</strong><br />
new container/volume can be determined by trial <strong>and</strong> error. During this procedure care must be<br />
taken to avoid loss of radioactive liquid during <strong>the</strong> transfer. This can be checked by monitoring all<br />
containers, syringes etc., involved in <strong>the</strong> process, <strong>and</strong> confirming that any residual activity is trivial.<br />
1.3.9 Linearity<br />
This should be measured over <strong>the</strong> entire range of activity <strong>for</strong> which a particular radionuclide<br />
calibrator will be used. The usual technique is <strong>the</strong> decaying source method. A vial containing <strong>the</strong><br />
maximum activity of a radionuclide used in <strong>the</strong> department is measured at intervals as <strong>the</strong> source<br />
decays. To cover <strong>the</strong> entire activity range this may require measurements to be made several times<br />
each day <strong>for</strong> several days. The activity at which non-linearities appear will be different <strong>for</strong> different<br />
radionuclides.<br />
Activity measurements can be recorded on a spreadsheet <strong>and</strong> a log-linear graph made of <strong>the</strong>se<br />
measurements plotted against time. With a linear system, this should be a straight line, <strong>and</strong> <strong>the</strong><br />
slope of <strong>the</strong> trend line produced <strong>for</strong> <strong>the</strong> whole of <strong>the</strong> data should equate to <strong>the</strong> decay constant of <strong>the</strong><br />
radionuclide used. Any difference will indicate that non-linearities exist.<br />
In order to quantify this non-linearity a region of <strong>the</strong> plot should be identified where <strong>the</strong> slope<br />
equates to <strong>the</strong> decay constant of <strong>the</strong> radionuclide used. Typically, this section of data is where <strong>the</strong><br />
measured activity is 100 times background <strong>and</strong> covers about 10 half-lives. This can <strong>the</strong>n be<br />
extrapolated back to obtain predicted activities at all measurement times. The activities at which<br />
<strong>the</strong> predicted activity <strong>and</strong> <strong>the</strong> measured activity differ by 1% (reference instrument limit) <strong>and</strong> 5%<br />
(field instrument limit) can <strong>the</strong>n be identified. For each radionuclide, <strong>the</strong> range of activities over<br />
which <strong>the</strong> instrument may be used as ei<strong>the</strong>r a field or reference instrument can <strong>the</strong>n be determined.<br />
A full outline of <strong>the</strong> method using 99m Tc, which is <strong>the</strong> most widely used radionuclide, is shown<br />
below.
Chapter 1 Good Practice Guide 93 9<br />
(a) Acquire a 99m Tc generator at an activity as large as will be encountered in <strong>the</strong><br />
department.<br />
(b) Record at least 10 consecutive measurements of background using <strong>the</strong> 99m Tc<br />
calibration setting. (Ensure chamber is shielded from <strong>the</strong> 99m Tc source <strong>and</strong> any o<strong>the</strong>r<br />
sources of radiation). Calculate mean value, B, of background (in terms of MBq of<br />
99m Tc).<br />
(c) Milk <strong>the</strong> 99m Tc generator into an elution vial, place vial in chamber.<br />
(d) Initiate measurement (ideally using <strong>the</strong> mode whereby <strong>the</strong> display is continually<br />
updated).<br />
(e) Record measurement, M. Record time of day, T, of start time of measurement to<br />
nearest minute (<strong>for</strong> 99m Tc this will result in a timing error of less than 0.1 %).<br />
(f) Repeat (e) at least once every 2 hours until <strong>the</strong> measurement is less than 10 x B.<br />
(g) Remove source to shielded area. Repeat (b) <strong>and</strong> check that <strong>the</strong> mean value is not<br />
significantly different from B.<br />
(h) Plot ln(M-B) against (T-T 0 ), where T 0 is <strong>the</strong> time of <strong>the</strong> first reading. Calculate <strong>the</strong><br />
slope over <strong>the</strong> range where M lies between 100xB <strong>and</strong> 100,000xB. This should be<br />
equal to - 0.1154 h -1 within 0.1% (equivalent to a half-life of 6.007 hours). If this is <strong>the</strong><br />
case, <strong>the</strong> response is linear over this region.<br />
(i) Calculate <strong>the</strong> predicted reading at all recorded points using a half-life of 6.007 hours<br />
<strong>and</strong> compare with recorded value. Determine <strong>the</strong> activity value where <strong>the</strong> measured<br />
value is 1% <strong>and</strong> 5% lower than <strong>the</strong> predicted.<br />
When <strong>the</strong> measurement range of <strong>the</strong> instrument changes <strong>the</strong>re may be a discrete change in linearity<br />
of a few percent (see section 2.3.3).<br />
Alternatives to <strong>the</strong> above method include <strong>the</strong> graded source <strong>and</strong> graded shielding methods. The<br />
graded source method requires measurement of aliquots of a stock solution covering <strong>the</strong> activity<br />
range of interest. The relative activities of <strong>the</strong> aliquots should be determined by accurate weighing.<br />
After weighing it is essential to make all containers up to <strong>the</strong> same volume <strong>and</strong> corrections <strong>for</strong><br />
decay may also have to be made if measurements are not made over sufficiently short periods of<br />
time. The graded shielding method requires <strong>the</strong> use of pre-calibrated shielding to cover <strong>the</strong> activity<br />
range of interest. The calibration of <strong>the</strong> shielding needs to be specific to <strong>the</strong> radionuclide used.<br />
Both of <strong>the</strong>se alternative methods require greater care on <strong>the</strong> part of <strong>the</strong> operator <strong>and</strong> are not<br />
recommended.
10 Good Practice Guide 93 Chapter 1<br />
1.4 Additional Considerations<br />
1.4.1 Environmental Requirements<br />
Ideally <strong>the</strong> instrument should be used in a stable environment. The chamber should be mounted on<br />
a very firm, vibration-free base. The area must not be affected by high activity sources nearby <strong>and</strong><br />
this will often require extra shielding (see section 1.3.4). For reliability <strong>and</strong> stability, <strong>the</strong> calibrator<br />
should be operated at a reasonably constant temperature. Direct sunlight or proximity to a room<br />
heater or air conditioner should be avoided. Excessive humidity should also be avoided.<br />
1.4.2 Power Requirements<br />
No special power requirements are normally necessary. The line voltage required will be stated in<br />
<strong>the</strong> user manual. For optimum per<strong>for</strong>mance, <strong>the</strong> unit should be left powered at all times. The use<br />
of a mains interference filter <strong>and</strong> an uninterruptible power supply (UPS) is recommended.<br />
1.4.3 Shielding<br />
An effective way of reducing <strong>the</strong> effects of local environment radiation is to shield <strong>the</strong> ionisation<br />
chamber, usually with lead. Shielding also helps to minimise <strong>the</strong> dose to <strong>the</strong> operator whilst a<br />
radioactive source is in <strong>the</strong> ionisation chamber. The shield may be provided by <strong>the</strong> manufacturer<br />
ei<strong>the</strong>r as an integral part of <strong>the</strong> chamber module or as a removable outer sleeve; alternatively it may<br />
be constructed "in-house" by <strong>the</strong> user as <strong>the</strong> only <strong>for</strong>m of shielding or in addition to that already<br />
provided with <strong>the</strong> chamber.<br />
It is important to note that shielding will alter <strong>the</strong> calibration factors to an extent that is dependent<br />
on <strong>the</strong> type <strong>and</strong> proximity of <strong>the</strong> shielding. This arises from back-scattering of photons from <strong>the</strong><br />
source after <strong>the</strong>y emerge from <strong>the</strong> outer surface of <strong>the</strong> chamber toge<strong>the</strong>r with <strong>the</strong> emission of Pb K<br />
X-rays arising from interactions within <strong>the</strong> lead shielding. Typically, <strong>the</strong> combination of <strong>the</strong>se two<br />
events results in an enhancement of <strong>the</strong> chamber response, which maximises in <strong>the</strong> region of 80<br />
keV. As such, those radionuclides, which are ideal <strong>for</strong> imaging purposes also suffer most from this<br />
effect. It is important <strong>the</strong>re<strong>for</strong>e to determine <strong>the</strong> shielding arrangements which apply <strong>for</strong> <strong>the</strong><br />
calibration settings provided by <strong>the</strong> manufacturer. If additional shielding is introduced,<br />
comparative measurements should be made with <strong>and</strong> without <strong>the</strong> additional shielding to determine<br />
<strong>the</strong> correction factors that will need to be applied.<br />
1.5 Quality Assurance <strong>and</strong> Documentation<br />
Results of UK hospital exercises conducted over <strong>the</strong> years by <strong>NPL</strong> <strong>for</strong> a wide range of medical<br />
radionuclides illustrate a wide variation of response, even <strong>for</strong> those using chambers of <strong>the</strong> same<br />
model. They also demonstrate that it is related to <strong>the</strong> average energy of <strong>the</strong> photon radiation being<br />
measured: <strong>the</strong> lower <strong>the</strong> photon energy, <strong>the</strong> wider <strong>the</strong> variation. This is demonstrated in Table 1.3,<br />
which examines <strong>the</strong> spread of responses <strong>for</strong> a particular radionuclide in terms of <strong>the</strong> fraction of<br />
results which lie within a given range of <strong>the</strong> true value. The results have been presented in<br />
ascending order of average photon energy (results from a recent comparison of a pure beta emitter,<br />
89 Sr, have also been included).
Chapter 1 Good Practice Guide 93 11<br />
Table 1.3<br />
Results of UK hospital comparisons<br />
Nuclide<br />
Ref.<br />
Principal Photon<br />
Energy (keV)<br />
Emission<br />
Probability<br />
Percentage of results within<br />
given range of <strong>NPL</strong> value<br />
0.95 – 1.05 0.90 – 1.10<br />
125 I [5] ~30 1.39 13 26<br />
123 I * [6, 7]<br />
30<br />
159<br />
0.87<br />
0.83<br />
29 66<br />
57 Co [5] 122 0.855 52 76<br />
201 Tl [8]<br />
71<br />
167<br />
0.47<br />
0.10<br />
73 94<br />
99m Tc [9] 141 0.890 73 94<br />
111 In [10]<br />
67 Ga [11]<br />
26<br />
171<br />
245<br />
93<br />
185<br />
300<br />
393<br />
0.83<br />
0.90<br />
0.94<br />
0.42<br />
0.21<br />
0.17<br />
0.05<br />
84 92<br />
91 95<br />
131 I [9, 12] 365 0.82 90 100<br />
89 Sr ** [13] beta emitter 58 86<br />
* 123 I errors in response mainly due to low energy photon emissions<br />
** 89 Sr errors in response mainly due to inadequate corrections <strong>for</strong> <strong>the</strong> presence of 85 Sr impurity.<br />
These results demonstrate <strong>the</strong> need <strong>for</strong> a rigorous approach to quality assurance. The quality<br />
control procedures detailed above (section 1.3) are specific actions that need to be taken on a<br />
routine basis. They should <strong>for</strong>m part of such an overall quality assurance system. For operations<br />
which include a significant technical content including calibration, <strong>the</strong> most relevant QA system is<br />
that of <strong>the</strong> international st<strong>and</strong>ard, ISO17025 [14] This st<strong>and</strong>ard addresses both <strong>the</strong> management <strong>and</strong><br />
technical requirements necessary to maintain an operation which will produce technically valid data<br />
<strong>and</strong> results.<br />
It is not <strong>the</strong> remit of this guidance to reproduce ISO17025 but <strong>the</strong>re are some points, which are<br />
worth emphasising.
12 Good Practice Guide 93 Chapter 1<br />
1.5.1 Authorisations<br />
The system should document <strong>the</strong> qualifications <strong>and</strong> training requirements necessary <strong>for</strong> those<br />
personnel who are to operate radionuclide calibrators. It should also detail those who are<br />
subsequently authorised to operate <strong>the</strong> calibrators as well as those who have ultimate responsibility<br />
<strong>for</strong> <strong>the</strong>ir correct functioning.<br />
1.5.2 Non-con<strong>for</strong>mances<br />
There should be agreed <strong>and</strong> documented criteria which define <strong>the</strong> points at which <strong>the</strong> results of<br />
quality control measurements (section 1.3) fall outside acceptable limits (non-con<strong>for</strong>mance). When<br />
this occurs, <strong>the</strong>re should be defined responsibilities <strong>and</strong> follow-up actions, which ensure that <strong>the</strong><br />
non-con<strong>for</strong>mances are remedied. It is often useful to mainain charts (ei<strong>the</strong>r h<strong>and</strong>-drawn or<br />
computer based) which display tolerance levels <strong>and</strong> not only record quality control measurements<br />
but also provide an instant indication of when non-con<strong>for</strong>mances arise or identify trends which<br />
might give early warning of future problems.<br />
1.5.3 Documentation<br />
Sufficient records need to be kept to demonstrate that quality control procedures have been adhered<br />
to <strong>and</strong> that <strong>the</strong> calibrator can be shown to have been operating correctly at all times. Actual<br />
readings should be recorded. Details of any maintenance or repair should also be recorded. Users<br />
should develop <strong>for</strong>ms, which meet <strong>the</strong> requirements of <strong>the</strong>ir own systems.
Uncertainties &<br />
Sources of Error<br />
22<br />
IN THIS CHAPTER<br />
• Introduction<br />
• <strong>Calibration</strong><br />
» <strong>Calibration</strong> factor<br />
» Chamber wall thickness<br />
• Electronics<br />
» Inherent accuracy<br />
» Linearity<br />
» Range changing<br />
• Statistical<br />
• Activity<br />
» High activity<br />
» Low activity & background<br />
• Shielding<br />
• Container & source effect<br />
» Container wall thickness<br />
» Container types<br />
» Volume<br />
» Position<br />
» Density<br />
» Homogeneity<br />
» Adsorption<br />
• Radionuclide purity<br />
• Nuclear data<br />
• Simulated sources<br />
• Specific problem of assaying pure beta<br />
emitters
14 Good Practice Guide 93 Chapter 2<br />
2.1 Introduction<br />
Over <strong>the</strong> past few years, <strong>the</strong> determination of <strong>the</strong> uncertainty of a measurement value has become as<br />
important as <strong>the</strong> measurement value itself. The accepted concept is that “An expression of <strong>the</strong><br />
result of a measurement is incomplete unless it includes a statement of <strong>the</strong> associated uncertainty.”<br />
There is now international agreement on <strong>the</strong> way in which uncertainties should be estimated <strong>and</strong><br />
this is documented in <strong>the</strong> ISO publication,“Guidance on <strong>the</strong> Estimation of Uncertainties in<br />
Measurement (GUM) [15]. The United Kingdom Accreditation Service (UKAS) has produced its<br />
own version (M3003) [16] of this <strong>for</strong> <strong>the</strong> UK. These guidelines have been adopted in all National<br />
Measurement Institutes worldwide <strong>and</strong> <strong>the</strong>ir use is being extended down through <strong>the</strong> relevant<br />
measurement chains to all those organisations <strong>and</strong> individuals who make measurements in whatever<br />
field or discipline. An extended discussion of <strong>the</strong> underlying principles of this new guidance is<br />
beyond <strong>the</strong> scope of this protocol <strong>and</strong> users should refer to GUM <strong>and</strong> M3003.<br />
For an explanation of <strong>the</strong> terminology <strong>the</strong> user is referred to <strong>NPL</strong> Measurement Good Practice<br />
Guide Number 11 – A Beginner’s Guide to Uncertainty of Measurement [17].<br />
However, it is useful to summarise <strong>the</strong> main steps described in <strong>the</strong>se two documents in order to<br />
show how <strong>the</strong> overall uncertainty in a final measurement can be derived. These steps are:<br />
a) Identify each independent input component, which will affect <strong>the</strong> uncertainty in <strong>the</strong><br />
measurement <strong>and</strong> estimate <strong>the</strong> magnitude of <strong>the</strong> component’s uncertainty at <strong>the</strong> 68%<br />
confidence level (approximately plus or minus one st<strong>and</strong>ard deviation).<br />
b) Estimate <strong>the</strong> st<strong>and</strong>ard uncertainty which each component contributes to <strong>the</strong> measurement<br />
result by identifying <strong>the</strong> weighting of <strong>the</strong> component, expressed as a sensitivity coefficient<br />
per unit change in <strong>the</strong> measurement, <strong>and</strong> multiplying by <strong>the</strong> estimated component<br />
uncertainty derived in (a).<br />
c) Combine in quadrature all of <strong>the</strong> identified st<strong>and</strong>ard uncertainties to produce a combined<br />
st<strong>and</strong>ard uncertainty. This will again be at a 68% confidence level.<br />
d) Calculate <strong>the</strong> exp<strong>and</strong>ed uncertainty quoted on <strong>the</strong> final measurement. This is <strong>the</strong> combined<br />
st<strong>and</strong>ard uncertainty multiplied by a coverage factor, k. A particular value of k gives a<br />
particular confidence level <strong>for</strong> <strong>the</strong> exp<strong>and</strong>ed uncertainty. Usually a value of k = 2 is used,<br />
which corresponds approximately to a 95% confidence level.<br />
The methods of estimation of uncertainties are classified as ei<strong>the</strong>r Type A, those determined by<br />
statistical means, or Type B, those determined by o<strong>the</strong>r means. The distinction between <strong>the</strong>se two<br />
types of uncertainty is important in that <strong>the</strong> Type A estimate will normally have a finite number of<br />
degrees of freedom associated with it <strong>and</strong> have a normal distribution whilst Type B uncertainties<br />
normally have an infinite number of degrees of freedom <strong>and</strong> may also have a non-normal<br />
distribution (e.g. rectangular, bi-modal, etc). Each of <strong>the</strong>se factors may cause <strong>the</strong> coverage factor,<br />
k, to be different from 2. This, however, tends to be <strong>the</strong> exception ra<strong>the</strong>r than <strong>the</strong> rule <strong>and</strong> GUM<br />
provides relevant guidance in <strong>the</strong>se cases.<br />
It is important to note that it should not be necessary to make estimates of each individual<br />
uncertainty <strong>for</strong> every measurement. If a generic approach is taken, it should be possible to<br />
determine a set of operating limits <strong>for</strong> a particular calibrator whereby <strong>the</strong> individual components of<br />
uncertainty are ei<strong>the</strong>r maintained below a known (insignificant) level or remain at a constant
Chapter 2 Good Practice Guide 93 15<br />
(known) level <strong>for</strong> a reasonable period of time. This will allow <strong>the</strong> same overall uncertainty to be<br />
attributed to all measurements of a particular radionuclide.<br />
Table 2.1 below identifies <strong>and</strong> describes <strong>the</strong> major sources of uncertainty in calibrator<br />
measurements <strong>and</strong> states whe<strong>the</strong>r <strong>the</strong>y are dependent on <strong>the</strong> level of activity being measured, <strong>the</strong><br />
particular radionuclide being measured or <strong>the</strong> properties of <strong>the</strong> calibrator. The following sections<br />
examine in turn each of <strong>the</strong>se sources of uncertainty.<br />
Table 2.1<br />
Principal Sources of Uncertainty<br />
Source of<br />
Uncertainty<br />
<strong>Calibration</strong><br />
Electronics<br />
Description Dependency Chapter 2<br />
Reference<br />
Traceability, accuracy,<br />
variation between chambers<br />
Accuracy, linearity, range<br />
changing<br />
Activity Nuclide Calibrator<br />
N Y Y 2.2<br />
Y N Y 2.3<br />
Statistical Repeatability Y Y Y 2.4<br />
High activity Recombination effects Y Y Y 2.5.1<br />
Low activity Short counting period,<br />
background uncertainty<br />
Y Y Y 2.5.2<br />
Shielding<br />
Shielding backscatter<br />
effects<br />
N Y Y 2.6<br />
Container - I Wall thickness variations N Y N 2.7.1<br />
Container - II Differences between N Y N 2.7.2<br />
container types<br />
Volume Volume correction factors N Y Y 2.7.3<br />
Position Reproducibility of sample N N Y 2.7.4<br />
position<br />
Density<br />
Homogeneity<br />
Adsorption<br />
Purity<br />
Nuclear data<br />
Simulators<br />
Different carrier/chemical<br />
compositions<br />
Variations throughout<br />
source<br />
Adherence of activity to<br />
surfaces<br />
Response differences from<br />
main nuclide<br />
Half-lives, interpolation of<br />
calibration factors<br />
Use of simulated sources<br />
<strong>for</strong> calibration<br />
N Y N 2.7.5<br />
N Y N 2.7.6<br />
N Y N 2.7.7<br />
N Y Y 2.8<br />
N Y Y 2.9<br />
N Y Y 2.10
16 Good Practice Guide 93 Chapter 2<br />
2.2 <strong>Calibration</strong><br />
2.2.1 <strong>Calibration</strong> factor<br />
The uncertainty on <strong>the</strong> calibration factor <strong>for</strong> a particular radionuclide is initially outside <strong>the</strong> control<br />
of <strong>the</strong> user. <strong>Calibration</strong> factors (in terms of current output per unit activity, pA/MBq) are<br />
determined by <strong>the</strong> supplier of <strong>the</strong> calibrator <strong>and</strong> should be traceable to national st<strong>and</strong>ards of<br />
radioactivity. For medical radionuclides, <strong>the</strong> uncertainty of <strong>the</strong> national st<strong>and</strong>ards range is typically<br />
between 1.0 <strong>and</strong> 3.0 % (at k=2 level). For <strong>the</strong> calibration factor, additional uncertainties should<br />
have been added to take into account <strong>the</strong> uncertainties associated with <strong>the</strong> process of transferring<br />
<strong>the</strong> value of <strong>the</strong> primary st<strong>and</strong>ard to <strong>the</strong> calibrator measurements. These may be particularly large<br />
<strong>for</strong> pure beta emitters <strong>and</strong> low-energy photon emitters. The associated uncertainty associated with<br />
<strong>the</strong> calibration factor will, <strong>the</strong>re<strong>for</strong>e, be larger than that of <strong>the</strong> primary st<strong>and</strong>ard.<br />
The calibration factor <strong>and</strong> associated uncertainty stated by <strong>the</strong> supplier <strong>for</strong> a specific radionuclide<br />
will be <strong>for</strong> <strong>the</strong> supplier’s master chamber <strong>and</strong> <strong>for</strong> a particular container <strong>and</strong> volume of solution.<br />
Typical uncertainties <strong>for</strong> st<strong>and</strong>ards from national metrology institutes are shown in Table 2.2.<br />
Table 2.2<br />
Typical state-of-<strong>the</strong>-art uncertainties <strong>for</strong> primary st<strong>and</strong>ards<br />
Nuclide Uncertainty (%)<br />
(k=2)<br />
32 P* 1.50<br />
51 Cr 1.0<br />
57 Co 2.0<br />
67 Ga 2.5<br />
89 Sr* 1.0<br />
90 Y* 1.0<br />
* Pure beta emitter<br />
**Low-energy photon<br />
Nuclide Uncertainty (%)<br />
(k=2)<br />
99m Tc 2.0<br />
111 In 1.5<br />
123 I** 1.5<br />
125 I** 3.0<br />
131 I 1.0<br />
201 Tl 1.50<br />
2.2.2 Chamber wall thickness<br />
As stated in 2.2.1, <strong>the</strong> calibration factor supplied <strong>for</strong> a particular calibrator model is that <strong>for</strong> <strong>the</strong><br />
master chamber held by <strong>the</strong> supplier. Factory adjustments may have been made to compensate <strong>for</strong><br />
some manufacturing differences between production chambers <strong>and</strong> <strong>the</strong> master but <strong>the</strong>se adjustments<br />
cannot always ensure that <strong>the</strong>ir responses are identical. These differences may result, <strong>for</strong> example,<br />
from differences in gas pressure, chamber inner wall thickness or trace impurities in <strong>the</strong> wall<br />
materials. It is <strong>the</strong> inner wall material differences (thickness <strong>and</strong> trace impurities) that tend to<br />
produce <strong>the</strong> most significant differences.<br />
Most ionisation chambers are constructed from aluminium <strong>and</strong> <strong>the</strong> inner wall typically has a<br />
thickness of a few mm. The possible variations in wall thickness will vary depending on <strong>the</strong><br />
manufacturer <strong>and</strong> manufacturing tolerances. Measurements have been made with some medical<br />
radionuclides to indicate <strong>the</strong> change in response with inner wall thickness of an aluminium<br />
chamber. These are shown in Table 2.3.
Chapter 2 Good Practice Guide 93 17<br />
Table 2.3 Change in response of an aluminium-wall ionization chamber with<br />
an additional aluminium layer between <strong>the</strong> source <strong>and</strong> chamber<br />
Reduction in response with<br />
increase in wall thickness<br />
0.05 mm 0.2 mm<br />
125 I 3 % 14 %<br />
123 I 1 % 4%<br />
111 In 0.5 % 1.8 %<br />
131 I 0.1 % 0.5 %<br />
These variations in response are more significant <strong>for</strong> low-energy, photon-emitting radionuclides <strong>and</strong><br />
may contribute to <strong>the</strong> greater variability observed between chambers <strong>for</strong> <strong>the</strong>se radionuclides (see<br />
Table 1.3).<br />
2.3 Electronics<br />
The accuracy of <strong>the</strong> electrometer is ano<strong>the</strong>r source of uncertainty over which <strong>the</strong> user may have<br />
little control. Generally, <strong>the</strong> electrometer measures <strong>the</strong> current output (pA) of <strong>the</strong> ionisation<br />
chamber <strong>and</strong>, via <strong>the</strong> application of a calibration factor (pA/MBq), converts this measure into an<br />
indication of <strong>the</strong> activity (MBq). The three principal sources of uncertainty related to <strong>the</strong><br />
electronics may be defined as <strong>the</strong> inherent accuracy, <strong>the</strong> linearity <strong>and</strong> <strong>the</strong> consistency of <strong>the</strong> range<br />
change.<br />
2.3.1 Inherent accuracy<br />
Inherent accuracy depends on <strong>the</strong> ability of <strong>the</strong> supplier to adjust <strong>the</strong> gain of <strong>the</strong> electrometer so that<br />
its measurement of current is traceable to primary st<strong>and</strong>ards. The adjustment is normally achieved<br />
by measuring <strong>the</strong> response of <strong>the</strong> system to a long-lived st<strong>and</strong>ard reference source <strong>and</strong> adjusting <strong>the</strong><br />
electrometer gain until it indicates <strong>the</strong> true activity within <strong>the</strong> manufacturing tolerance.<br />
The gain of <strong>the</strong> system, however, will change with time <strong>and</strong> environment. This results from normal<br />
ageing effects of electrical components, such as resistors <strong>and</strong> capacitors, as well as <strong>the</strong> temperature,<br />
humidity <strong>and</strong> radiation exposure dependence of <strong>the</strong>se components. If a reference source is supplied<br />
with <strong>the</strong> chamber, this allows <strong>the</strong> user <strong>the</strong> facility to produce a benchmark reading when it is first<br />
supplied <strong>and</strong> to <strong>the</strong>n adjust <strong>the</strong> electrometer gain if it changes with time.<br />
2.3.2 Linearity<br />
The electrometer response is regarded as linear if <strong>the</strong> ratio of <strong>the</strong> measured response to <strong>the</strong> true<br />
response remains constant over <strong>the</strong> range of current inputs <strong>for</strong> which <strong>the</strong> calibrator is designed.<br />
Electrometers are expected to measure currents ranging from 10’s of femtoamperes (fA) up to<br />
perhaps microamperes (μA) – a dynamic range of 10 8 , <strong>and</strong> it is not unreasonable to expect that<br />
<strong>the</strong>re will be a deviation from linearity but, provided this is contained within reasonable limits, it<br />
may not be a significant problem.<br />
2.3.3 Range changing<br />
As mentioned in <strong>the</strong> section on electrometer linearity (section 2.3.2), electrometers may be expected<br />
to cover a very wide dynamic range. To accommodate this, some incorporate a range changing<br />
facility which is triggered automatically i.e. without operator intervention. As well as <strong>the</strong> potential
18 Good Practice Guide 93 Chapter 2<br />
<strong>for</strong> different linearity characteristics in each range, <strong>the</strong> individual ranges may also have separate<br />
gain adjustments. If <strong>the</strong>se are not properly matched, this will result in a step in <strong>the</strong> response as <strong>the</strong><br />
electrometer switches between adjacent ranges.<br />
The preceding three electronics effects are illustrated graphically in Figure 2.1.<br />
Figure 2.1<br />
Effects of inherent accuracy, linearity <strong>and</strong> range changing in electrometers<br />
10 6<br />
10 5<br />
measured response<br />
"ideal" response<br />
Indicated response<br />
10 4<br />
10 3<br />
10 2<br />
10 1<br />
inaccuracy<br />
{<br />
range change<br />
effect<br />
10 0 10 0 10 1 10 2 10 3 10 4 10 5 10 6<br />
non-linearity<br />
Expected response<br />
Generally, <strong>the</strong> supplier will quote a level of uncertainty, which encompasses each of <strong>the</strong>se three<br />
components <strong>and</strong> 1 to 2% uncertainty is common. However, <strong>the</strong> level of confidence is often not<br />
quoted <strong>and</strong> it is normally prudent to assume that <strong>the</strong> quoted uncertainty is at a 68% level of<br />
confidence, k = 1.<br />
2.4 Statistical<br />
Repeatability defines <strong>the</strong> precision with which a single measurement is made. Because of <strong>the</strong><br />
r<strong>and</strong>om nature of radioactive decay, within two separate but equal measurement periods, <strong>the</strong>re will<br />
be a difference between <strong>the</strong> number of events that occur as well as <strong>the</strong> number of interactions per<br />
event in <strong>the</strong> gas <strong>and</strong> <strong>the</strong> number of ion pairs produced. This will result in two different<br />
measurement results <strong>for</strong>, effectively, <strong>the</strong> same measurement (this of course assumes that <strong>the</strong>re is no<br />
significant decay between <strong>the</strong> two measurement periods). If a series of n sequential identical<br />
measurements (x i ) are made, it is possible to determine <strong>the</strong> uncertainty on a single measurement by<br />
calculating <strong>the</strong> mean <strong>and</strong> st<strong>and</strong>ard deviation of that series. The normal equations are used:<br />
mean, x =<br />
n<br />
∑<br />
i=<br />
1<br />
n<br />
x<br />
i<br />
st<strong>and</strong>ard deviation, s(x) =<br />
n<br />
∑ ( xi<br />
− x)<br />
i=<br />
1<br />
( n − 1)<br />
2<br />
(1)
Chapter 2 Good Practice Guide 93 19<br />
The st<strong>and</strong>ard deviation will depend on <strong>the</strong> total number of ion pairs produced during <strong>the</strong><br />
measurement period <strong>and</strong>, <strong>the</strong>re<strong>for</strong>e, will depend on <strong>the</strong> activity of <strong>the</strong> source <strong>and</strong> <strong>the</strong> length of <strong>the</strong><br />
measurement period.<br />
If <strong>the</strong> measurement period remains constant <strong>the</strong>n <strong>the</strong> st<strong>and</strong>ard deviation would normally be<br />
inversely proportional to <strong>the</strong> square root of <strong>the</strong> activity. For example, if a single measurement on a<br />
1 MBq source gives a st<strong>and</strong>ard deviation of 1 %, <strong>the</strong>n a 100 MBq source would have a<br />
measurement st<strong>and</strong>ard deviation of 0.1 % <strong>for</strong> <strong>the</strong> same measurement period.<br />
As a rule of thumb <strong>for</strong> ionisation chambers, if a source produces a current of 1 pA <strong>and</strong> it is<br />
measured over a period of 1 second, <strong>the</strong>n <strong>the</strong> st<strong>and</strong>ard deviation of a single measurement will be of<br />
<strong>the</strong> order of 5 %. If a series of measurements is made, <strong>the</strong>n <strong>the</strong> mean of <strong>the</strong>se will have a lower<br />
uncertainty (st<strong>and</strong>ard deviation of <strong>the</strong> mean) equal to <strong>the</strong> st<strong>and</strong>ard deviation divided by <strong>the</strong> square<br />
root of <strong>the</strong> number of measurements, viz:<br />
st<strong>and</strong>ard deviation of<br />
<strong>the</strong> mean, s(x) =<br />
n<br />
∑ ( xi<br />
− x)<br />
i=<br />
1<br />
n<br />
2<br />
s(x)<br />
=<br />
( n − 1) n<br />
(2)<br />
Given <strong>the</strong> above example, where <strong>the</strong> st<strong>and</strong>ard deviation of a single measurement (as % of mean)<br />
was 5 %, if a series of 9 measurements is made, <strong>the</strong> st<strong>and</strong>ard deviation of <strong>the</strong> mean becomes 1.7 %.<br />
Many calibrators now have <strong>the</strong> facility, ei<strong>the</strong>r automatically or by user intervention, to adjust <strong>the</strong><br />
measurement period <strong>and</strong> that period may vary from a fraction of one second to several tens of<br />
seconds. It is important <strong>the</strong>re<strong>for</strong>e to characterise <strong>the</strong> repeatability of <strong>the</strong> calibrator system at several<br />
levels of current output. If this is done using one radionuclide, <strong>the</strong>se results can be extrapolated to<br />
o<strong>the</strong>r nuclides. These repeatability measurements need to be confirmed on a regular basis to ensure<br />
that <strong>the</strong> electronics has not become noisy.<br />
2.5 Activity<br />
O<strong>the</strong>r uncertainties <strong>and</strong> errors can be introduced into <strong>the</strong> measurement due to <strong>the</strong> level of activity of<br />
<strong>the</strong> source <strong>and</strong> also due to <strong>the</strong> presence of background.<br />
2.5.1 High Activity<br />
The current output of <strong>the</strong> chamber depends on <strong>the</strong> number of positive ions (or electrons), which<br />
reach <strong>the</strong> collecting electrode. As <strong>the</strong> activity of <strong>the</strong> source increases, so does <strong>the</strong> rate of production<br />
of ion pairs within <strong>the</strong> sensitive volume of <strong>the</strong> gas <strong>and</strong> <strong>the</strong> probability of recombination of <strong>the</strong><br />
positive ions with electrons increases. The polarising voltage of <strong>the</strong> ionisation chamber is a<br />
compromise between <strong>the</strong> need to maintain a high electric field, which reduces recombination, <strong>and</strong><br />
<strong>the</strong> need to avoid electrical discharges <strong>and</strong> o<strong>the</strong>r safety issues. The point will be reached where, as<br />
<strong>the</strong> ion production rate increases, <strong>the</strong> rate of recombination becomes significant <strong>and</strong> some of <strong>the</strong><br />
expected current is lost. Some typical recombination curves are shown in Figure 2.2. Again, it<br />
should be noted that this is a current effect <strong>and</strong> hence <strong>the</strong> degree of recombination at a particular<br />
level of current will correspond to different levels of activity <strong>for</strong> different radionuclides.
20 Good Practice Guide 93 Chapter 2<br />
Figure 2.2<br />
Effects of recombination.<br />
Indicated activity/true activity<br />
1.01<br />
1<br />
0.99<br />
0.98<br />
0.97<br />
0.96<br />
0.95<br />
0.94<br />
Calibrator A<br />
Calibrator B<br />
0.01 0.1 1 10 100<br />
Ideal<br />
True activity (GBq)<br />
For most modern calibrators, <strong>the</strong> effects of recombination should be less than 1% when assaying<br />
100 GBq of Tc-99m. The examples shown in Figure 2.2, A <strong>and</strong> B, are, however, real cases that<br />
have previously been observed [18]. Users should check <strong>the</strong> characteristics of <strong>the</strong>ir own system <strong>for</strong><br />
each radionuclide used. The measurement of linearity (Section 1.3.9) can be used to check both this<br />
uncertainty <strong>and</strong> <strong>the</strong> uncertainty due to electronics.<br />
2.5.2 Low activity <strong>and</strong> background<br />
Background radiation levels become important when low activity levels are being assayed. The<br />
background current arises from two sources: natural background, which remains relatively constant,<br />
<strong>and</strong> that due to radioactive sources in <strong>the</strong> local environment. A typical natural background current<br />
<strong>for</strong> an ionisation chamber is of <strong>the</strong> order of 0.1 pA. Taking 51 Cr as a radionuclide which has a<br />
relatively low current response per unit activity, natural background could contribute as much as<br />
8% of <strong>the</strong> chamber current when assaying an activity level of 4 MBq. For <strong>the</strong> same chamber, it can<br />
be shown that a 0.37 MBq 60 Co source at 1 m from an unshielded chamber will cause a current flow<br />
of almost 0.1 pA. In this example <strong>the</strong> combined sources of background radiation would contribute<br />
some 15% of <strong>the</strong> assay reading.<br />
Many radionuclide calibrators are provided with a background compensation facility. Whilst<br />
simplifying <strong>the</strong> user’s task when properly adjusted, this feature can lead to erroneous results if <strong>the</strong><br />
radiation level in <strong>the</strong> local environment changes between background measurements. It is essential<br />
<strong>the</strong>re<strong>for</strong>e to make regular checks on <strong>the</strong> background radiation level.<br />
As pointed out in section 2.4, <strong>the</strong> time period <strong>for</strong> a single measurement may vary depending on <strong>the</strong><br />
current output. There<strong>for</strong>e, if <strong>the</strong> background constitutes a significant proportion of <strong>the</strong> sample<br />
response, it is important to know <strong>the</strong> uncertainty of <strong>the</strong> background measurement. The simplest<br />
means of doing this is to take a series of background measurements at <strong>the</strong> installation stage <strong>and</strong> to<br />
determine <strong>the</strong> st<strong>and</strong>ard deviation of a single measurement. Obviously, if <strong>the</strong> sample being<br />
measured has a low activity, <strong>the</strong> uncertainty arising from <strong>the</strong> background can be reduced by taking<br />
<strong>the</strong> mean of a number of sequential background measurements.
Chapter 2 Good Practice Guide 93 21<br />
2.6 Shielding<br />
The effects of background radiation were discussed in section 2.5.2. An effective way of reducing<br />
<strong>the</strong> effects of local environment radiation is to shield <strong>the</strong> ionisation chamber, usually with lead.<br />
Shielding will produce differences in calibration factors between <strong>the</strong> shielded <strong>and</strong> un-shielded states<br />
due to <strong>the</strong> backscattering of photons. The magnitude of this effect will depend on <strong>the</strong> type <strong>and</strong><br />
proximity of <strong>the</strong> shielding. This effect will also occur if <strong>the</strong> chamber is placed in close proximity to<br />
a backscattering medium, <strong>for</strong> example, a solid wall.<br />
Many chambers are now provided with an integral shield but this may not be of sufficient thickness<br />
to absorb all of <strong>the</strong> backscattered radiation be<strong>for</strong>e it re-enters <strong>the</strong> chamber. So, if additional<br />
shielding is provided or <strong>the</strong> chamber is positioned close to a wall, users should determine whe<strong>the</strong>r<br />
new calibration factors need to be derived. For lead shielding, <strong>the</strong> difference between shielded <strong>and</strong><br />
un-shielded calibration factors is most pronounced <strong>for</strong> nuclides that emit photons just above <strong>the</strong> K<br />
X-ray energy of lead (∼ 80 keV). Nuclides such as 99m Tc will, <strong>the</strong>re<strong>for</strong>e, be affected.<br />
Some typical data are given in Table 2.4 <strong>and</strong> show <strong>the</strong> magnitude of this effect [19]. Users should<br />
determine <strong>the</strong> magnitude of this effect <strong>for</strong> <strong>the</strong>ir own calibrator at <strong>the</strong>ir normal operating position.<br />
Table 2.4<br />
Variation of radionuclide calibrator response with<br />
shielding/backscatter<br />
Shielding/backscatter conditions<br />
Increase in indicated 99m Tc activity<br />
No shielding -<br />
Chamber 9” (23 cm) from dry wall 2 %<br />
Chamber 6” (15 cm) from 70 kg person 2.5 %<br />
1” (2.5 cm) Pb in contact with exterior of chamber 19 %<br />
2.7 Container <strong>and</strong> Source Effects<br />
2.7.1 Container wall thickness<br />
In <strong>the</strong> same way that responses will depend on variations in <strong>the</strong> wall thickness of <strong>the</strong> inner wall of<br />
<strong>the</strong> chamber, variations in <strong>the</strong> wall thickness of <strong>the</strong> sample container will also have an impact. The<br />
sample would normally be delivered from <strong>the</strong> supplier in a glass container. The dimensions <strong>and</strong><br />
wall thickness variations of typical containers used in <strong>the</strong> U.K. are shown in Table 2.5.
22 Good Practice Guide 93 Chapter 2<br />
Table 2.5<br />
Typical glass vials (All dimensions in mm)<br />
Schott<br />
P6<br />
Height 45.0 ± 0.5 54.00 ± 0.75<br />
Diameter 24.0 ± 0.2 21.75 ± 0.25<br />
Wall 1.00 ± 0.04 1.2 ± 0.1<br />
Experimental measurements with some medical radionuclides are shown in Table 2.6 <strong>and</strong> are<br />
indicative of <strong>the</strong> level of measurement variation that may be seen due to <strong>the</strong> vial manufacturing<br />
tolerances that are given in Figure 2.5.<br />
Table 2.6<br />
Change in response of an <strong>NPL</strong> ionization chamber with variation<br />
in wall thickness of glass vials<br />
Reduction in response with increase in<br />
wall (glass) thickness<br />
0.08 mm 0.2 mm<br />
125 I 3 % 7 %<br />
123 I 0.6 % 1.5 %<br />
111 In 0.2 % 0.4 %<br />
131 I 0.1 % 0.25 %<br />
For thinner-walled chambers, <strong>the</strong> variations <strong>for</strong> radionuclides that emit a mixture of high <strong>and</strong> lowenergy<br />
photons may be significantly higher.<br />
Similar effects will be seen when using syringes but, as <strong>the</strong>se are normally constructed from plastic<br />
<strong>and</strong> comprise relatively low-density materials, <strong>the</strong> magnitude of <strong>the</strong> effects will be somewhat lower.<br />
2.7.2 Container Types<br />
Different containers <strong>and</strong> volumes will produce different geometry <strong>and</strong> attenuation effects. Hence,<br />
differences between container types, volumes <strong>and</strong> construction materials will result in different<br />
calibration factors <strong>for</strong> individual radionuclides from those <strong>for</strong> <strong>the</strong> st<strong>and</strong>ard container <strong>for</strong> which <strong>the</strong><br />
published calibration factors apply. These effects will be most noticeable <strong>for</strong> low-energy, gamma<br />
emitters <strong>and</strong> pure beta emitters.<br />
Some suppliers provide factors <strong>for</strong> different containers <strong>and</strong> volumes (e.g. P6 vials, Schott vials,<br />
various syringe types, etc). O<strong>the</strong>rs provide “suggested” correction factors <strong>for</strong> containers o<strong>the</strong>r than<br />
<strong>the</strong> st<strong>and</strong>ard whilst some provide no advice at all. It is important that <strong>for</strong> any calibrator <strong>the</strong>se effects
Chapter 2 Good Practice Guide 93 23<br />
are quantified across <strong>the</strong> range of containers <strong>and</strong> volumes that will be used in practice. Tables 2.7<br />
<strong>and</strong> 2.8 illustrate <strong>the</strong> wide variations possible due to different container types.<br />
Table 2.7 Differences between calibration factors <strong>for</strong> <strong>NPL</strong> Secondary<br />
St<strong>and</strong>ard Radionuclide Calibrator <strong>for</strong> different containers, relative to 10R<br />
Schott vials<br />
Ratio of calibration factor <strong>for</strong> given container to that <strong>for</strong> a 10R Schott vial<br />
containing 4 ml of solution [20, 21]<br />
Nuclide 2 ml<br />
ampoule<br />
(1 ml<br />
P6 vial<br />
(4 ml<br />
solution)<br />
1 ml syr.<br />
(0.5 ml<br />
solution)<br />
3 ml syr.<br />
(1.5 ml<br />
solution)<br />
5 ml syr.<br />
(2.5 ml<br />
solution)<br />
10 ml syr.<br />
(5 ml<br />
solution)<br />
solution)<br />
125 I 1.27 0.91 1.56 1.47 1.35 1.34<br />
123 I 1.04 0.98 1.06 1.05 1.01 1.01<br />
99m Tc 1.01 1.00 - 0.99 0.98 0.94<br />
131 I 1.01 0.98 0.98 0.98 0.97 0.93<br />
32 P 1.05 0.97 - - - -<br />
90 Y 1.97 0.94 - - - -<br />
Note: Syringe factors depend on <strong>the</strong> manufacture type, volume of solution as well as <strong>the</strong> needle<br />
type <strong>and</strong> length. The examples shown above are based on Becton Dickinson Luer slip syringes<br />
fitted with <strong>the</strong> green needle <strong>and</strong> containing <strong>the</strong> nominal volume of solution as shown.<br />
The variation, again, is larger <strong>for</strong> thinner-walled chambers, in particular <strong>for</strong> 123 I <strong>and</strong> 111 In. This is<br />
due to <strong>the</strong> low energy emissions from <strong>the</strong>se radionuclides. For some calibrators over 60% of <strong>the</strong><br />
response <strong>for</strong> 123 I is due to <strong>the</strong> low-energy x-ray emissions at 27-28 keV. Some indicative<br />
measurements carried out by <strong>NPL</strong> on a Capintec CRC120 chamber are shown in Table 2.8.<br />
Table 2.8<br />
Indicative differences between responses <strong>for</strong> Capintec CRC120 <strong>for</strong><br />
syringes relative to P6 vials<br />
Typical ratio of response to that <strong>for</strong> a 10ml P6 vial<br />
containing 4 ml of solution [7, 10, 21]<br />
Nuclide 1 ml syr.<br />
(1 ml<br />
solution)<br />
2 ml syr.<br />
(2 ml<br />
solution)<br />
5 ml syr.<br />
(5 ml<br />
solution)<br />
10 ml syr.<br />
(10 ml<br />
solution)<br />
111 In 1.2 1.25 1.25 1.15<br />
123 I 1.4 - 1.6 1.25<br />
These results show that <strong>the</strong> response <strong>for</strong> 123 I activity in a syringe can be up to 60% higher than that<br />
<strong>for</strong> a P6 vial. This has clear implications <strong>for</strong> being able to accurately measure <strong>the</strong> injection dose <strong>for</strong><br />
a patient. It is possible to derive tables of calibration factors <strong>for</strong> <strong>the</strong> vials <strong>and</strong> syringes used<br />
routinely. However, a simpler process employs a copper filter to eliminate <strong>the</strong> variations due to <strong>the</strong>
24 Good Practice Guide 93 Chapter 2<br />
low energy emissions. The copper filter [22] essentially eliminates <strong>the</strong> low energy emissions but<br />
only reduces <strong>the</strong> high-energy gamma emissions by a small factor (
Chapter 2 Good Practice Guide 93 25<br />
The coefficients a 1 <strong>and</strong> a 2 may be calculated <strong>and</strong> also applied in practice using an Excel<br />
spreadsheet.<br />
In many cases, it may be possible to set limits on <strong>the</strong> volume that can be measured without <strong>the</strong> need<br />
to apply a correction factor, provided <strong>the</strong> magnitude of <strong>the</strong> correction is much less than <strong>the</strong> overall<br />
uncertainty of <strong>the</strong> measurement. For example, in <strong>the</strong> case of 99m Tc, <strong>the</strong> correction is no greater than<br />
1.0 % <strong>for</strong> all volumes between 1 <strong>and</strong> 10 ml in this vial. If <strong>the</strong> combined uncertainty from all o<strong>the</strong>r<br />
sources is say 3 %, it might be reasonable to ignore <strong>the</strong> volume correction <strong>for</strong> all volumes between<br />
1 <strong>and</strong> 10 ml.<br />
2.7.4 Position<br />
When a source is measured, removed from <strong>the</strong> chamber, replaced <strong>and</strong> measured again, <strong>the</strong>re will be<br />
a possible difference in <strong>the</strong> two measurements arising from <strong>the</strong> inability to replace <strong>the</strong> source in an<br />
identical position. The response of <strong>the</strong> calibrator depends on both <strong>the</strong> horizontal <strong>and</strong> vertical<br />
position of <strong>the</strong> source relative to <strong>the</strong> ionisation chamber. With most systems, <strong>the</strong> source is placed at<br />
<strong>the</strong> point of maximum response on <strong>the</strong> vertical axis of <strong>the</strong> chamber using a dedicated sample holder<br />
<strong>and</strong> <strong>the</strong> change in response <strong>for</strong> a change in vertical height of a few millimetres is usually negligible.<br />
For horizontal displacement from <strong>the</strong> vertical axis of symmetry, <strong>the</strong> effect is usually also small.<br />
The spatial sensitivity of a typical ionisation chamber, mapped using a 99m Tc point source, is<br />
illustrated in Figure 2.4 [22].<br />
Figure 2.4<br />
The spatial sensitivity of a typical ionisation chamber to a point source.<br />
In practice, calibrators are generally used to assay a finite volume of solution in a container but <strong>the</strong><br />
effects are very similar to those <strong>for</strong> a point source. Figure 2.5 shows <strong>the</strong> variations in response <strong>for</strong><br />
<strong>the</strong> ionisation chamber of <strong>the</strong> <strong>NPL</strong> secondary st<strong>and</strong>ard radionuclide calibrator when <strong>the</strong> radial <strong>and</strong><br />
axial positions are changed <strong>for</strong> a 5 ml ampoule containing 3 ml of solution.
26 Good Practice Guide 93 Chapter 2<br />
Figure 2.5<br />
Variation in response <strong>for</strong> radial <strong>and</strong> axial displacements of 3 ml solution in 5 ml<br />
ampoule <strong>for</strong> <strong>NPL</strong> secondary st<strong>and</strong>ard radionuclide calibrator [23]<br />
Change in response (%)<br />
2<br />
1<br />
0<br />
0 0.5 1<br />
Radial displacement from central<br />
measurement position (cm)<br />
Change in response (%)<br />
0<br />
-0.05<br />
-0.1<br />
0 0.5 1<br />
Axial displacement from central<br />
measurement position (cm)<br />
The combined uncertainty arising from <strong>the</strong>se effects can be estimated simply by making a series of<br />
measurements, say 20, on a long-lived source. Firstly <strong>the</strong> source should not be removed from <strong>the</strong><br />
chamber between each measurement <strong>and</strong> <strong>the</strong> st<strong>and</strong>ard deviation, S 1 of this set of measurements<br />
should be determined. A similar series of measurements should <strong>the</strong>n be taken this time removing<br />
<strong>the</strong> source <strong>and</strong> replacing between each measurement. Again, <strong>the</strong> st<strong>and</strong>ard deviation, S 2 , should be<br />
determined. The square root of <strong>the</strong> difference between <strong>the</strong> squares of <strong>the</strong> two st<strong>and</strong>ard deviations<br />
should provide an estimate of <strong>the</strong> uncertainty that should be included in any measurement <strong>for</strong> <strong>the</strong><br />
effect of sample position, i.e. S position = (S 2 2 - S 1 2 ) ½ . If S 2 is close to S 1 , <strong>the</strong>n <strong>the</strong> positioning<br />
uncertainty may be regarded as negligible; a st<strong>and</strong>ard deviation value of less than 0.1% of <strong>the</strong><br />
measurement value is typical.<br />
2.7.5 Density<br />
<strong>Calibration</strong> factors are normally determined <strong>for</strong> aqueous solutions with a density very close to 1<br />
g/cm 3 <strong>and</strong> <strong>the</strong>re is very little work that has been reported which deals with <strong>the</strong> effect of densities<br />
that vary greatly from this. It is not possible now to give any definitive advice on this effect. For<br />
typical measurements made in Nuclear Medicine departments <strong>the</strong> sample density should not be<br />
much different from one.<br />
2.7.6 Homogeneity<br />
Given that <strong>the</strong> vast majority of sources are liquids, homogeneity should not be a problem provided<br />
<strong>the</strong> source is well mixed. For situations where <strong>the</strong>re is a potential <strong>for</strong> activity to settle, <strong>for</strong> example<br />
in <strong>the</strong> case of colloids or macroaggregated albumin <strong>for</strong> lung perfusion imaging, it is a relatively<br />
simple task to ensure <strong>the</strong> source is well mixed <strong>and</strong> <strong>the</strong>n monitor <strong>the</strong> chamber response over a period<br />
of time which is greater than <strong>the</strong> normal time between source preparation <strong>and</strong> measurement. This<br />
should provide an indication of <strong>the</strong> magnitude of <strong>the</strong> effect that might be expected in normal<br />
situations. It is more sensible in routine practice, however, to ensure that <strong>the</strong> liquid is well mixed<br />
be<strong>for</strong>e measurement.<br />
2.7.7 Adsorption<br />
The possibility exists that active material may be adsorbed (plate-out) onto <strong>the</strong> surface of <strong>the</strong><br />
sample container. This is most likely when <strong>the</strong> solution is essentially carrier-free. Such effects<br />
have been observed in <strong>the</strong> past with 201 Tl (up to 30% of <strong>the</strong> activity being absorbed onto <strong>the</strong> glass<br />
surface), 67 Ga (up to 10%) <strong>and</strong> 111 In in P6 vials. The replacement of P6 vials with 10R Schott,<br />
Type+1 vials has virtually eliminated this effect. However, caution should be used particularly<br />
when new <strong>for</strong>mulations are used. It is advisable to re-measure vials after <strong>the</strong> active solution has<br />
been withdrawn <strong>and</strong> to conduct an activity balance calculation. Any residual activity observed in
Chapter 2 Good Practice Guide 93 27<br />
<strong>the</strong> emptied vial should be at a level which equates to <strong>the</strong> volume of solution that has not been<br />
extracted. If higher than expected levels are detected, more detailed investigations should be<br />
conducted to determine <strong>the</strong> cause.<br />
Some radiopharmaceuticals, e.g. tetrofosmin, are likely to adsorb onto <strong>the</strong> inner surface of syringes<br />
<strong>and</strong> it is necessary <strong>for</strong> <strong>the</strong> magnitude of this effect to be quantified when preparing doses <strong>for</strong> patient<br />
administration. It has been reported that with some types of syringe more than 19% of <strong>the</strong> activity<br />
of tetrofosmin may be retained on <strong>the</strong> walls <strong>and</strong> plunger of <strong>the</strong> syringe [24].<br />
2.8 Radionuclide Purity<br />
For some radionuclides, <strong>the</strong> production route means that inevitably <strong>the</strong>re will be some degree of<br />
impurity. For example, 201 Tl regularly contains 200 Tl <strong>and</strong> 202 Tl, medical quantities of 89 Sr include<br />
85 Sr whilst 126 I may be present in supplies of 125 I. Although <strong>the</strong> levels of <strong>the</strong>se impurities may be<br />
small in terms of impurity activity per unit activity of <strong>the</strong> principal radionuclide, <strong>the</strong>y may have a<br />
disproportionate effect on <strong>the</strong> activity measurement because of <strong>the</strong> difference in <strong>the</strong> sensitivity of<br />
<strong>the</strong> calibrator to <strong>the</strong> impurity <strong>and</strong> <strong>the</strong> principal nuclide.<br />
When assaying a source with known impurities <strong>the</strong> source can be considered <strong>the</strong> same as a mixed<br />
radionuclide source:<br />
A<br />
0<br />
=<br />
1 +<br />
AM<br />
n ⎛ R<br />
∑ xi<br />
⎜<br />
i = 1 ⎝ R<br />
0<br />
i<br />
⎟ ⎞<br />
⎠<br />
(4) <strong>and</strong> Ai<br />
= xi<br />
⋅ A0<br />
(5)<br />
where A 0 = <strong>the</strong> activity of <strong>the</strong> principal nuclide in <strong>the</strong> mixture<br />
A M = <strong>the</strong> indicated, displayed activity using calibration factor C 0<br />
A i = <strong>the</strong> activity of i th impurity nuclide<br />
x i = fraction of <strong>the</strong> i th impurity nuclide; x i = A i /A 0<br />
R 0 = calibrator response with calibrator factor C 0<br />
R i = calibrator response with calibrator factor C i<br />
C 0 = calibration factor <strong>for</strong> assaying a pure sample of <strong>the</strong> principal nuclide<br />
= calibration factor <strong>for</strong> assaying a pure sample of nuclide i<br />
C i<br />
(R 0 /R i ) is a property of <strong>the</strong> calibrator. For Vinten <strong>and</strong> <strong>NPL</strong> calibrators, it is simply <strong>the</strong> inverse ratio<br />
of <strong>the</strong> calibration factors C 0 <strong>and</strong> C i . For o<strong>the</strong>r calibrators/electrometers <strong>the</strong> ratio can be determined<br />
from <strong>the</strong> calibrator readings of a long-lived source, of appropriate activity, with factor C 0 <strong>and</strong> C i .<br />
This correction procedure is illustrated below <strong>for</strong> <strong>the</strong> assay of 89 Sr using <strong>the</strong> factors that have been<br />
determined at <strong>NPL</strong> <strong>for</strong> <strong>the</strong> <strong>NPL</strong> <strong>and</strong> Capintec calibrators [13]. It is important to note that impurity<br />
levels in radiopharmaceutical supplies change with time because of improvements in nuclide<br />
production techniques <strong>and</strong> that <strong>the</strong> activity quoted on <strong>the</strong> supply may only be a nominal value <strong>and</strong><br />
could be up to 10% in error. It is dangerous <strong>the</strong>re<strong>for</strong>e to attempt to produce “artificial” calibration<br />
settings which apply to a particular impurity level. The results of <strong>the</strong> 89 Sr comparison [13] illustrate<br />
<strong>the</strong> magnitude of <strong>the</strong> errors that this can produce.
28 Good Practice Guide 93 Chapter 2<br />
EXAMPLE 1.<br />
<strong>NPL</strong> calibrator: 89 Sr containing a 85 Sr impurity in a 10R Schott vial<br />
The vial containing <strong>the</strong> 89 Sr was measured in <strong>the</strong> calibrator using <strong>the</strong> 89 Sr setting, C 0 :<br />
A M = 180 MBq ; <strong>the</strong> reading be<strong>for</strong>e impurity correction<br />
For this calibrator we know that [13]:<br />
C 0 = C Sr-89 = 0.0284 pA/MBq; <strong>the</strong> calibration factor <strong>for</strong> 89 Sr<br />
C 1 = C Sr-85 = 5.286 pA/MBq; <strong>the</strong> calibration factor <strong>for</strong> 85 Sr<br />
(R 0 /R 1 ) = (R Sr-89 /R Sr-85 ) = (C Sr-85 /C Sr-89 ) = 186<br />
Any source measured with calibration factor C Sr-89 , in this calibrator, will give a reading 186 times<br />
<strong>the</strong> reading obtained when <strong>the</strong> same source is measured with calibration factor source C Sr-89.<br />
The percentage impurity at <strong>the</strong> time of <strong>the</strong> assay is calculated to be 0.1%. This value will have been<br />
calculated from <strong>the</strong> percentage impurity figure provided by <strong>the</strong> radiopharmaceutical supplier <strong>and</strong><br />
corrected to <strong>the</strong> time of <strong>the</strong> assay. Where <strong>the</strong> half-life of <strong>the</strong> radionuclides is not <strong>the</strong> same, <strong>the</strong><br />
percentage impurity will be time-dependent.<br />
x Sr-85 = fraction of 85 Sr (by activity) = 0.001<br />
A Sr-89 = <strong>the</strong> activity of 89 Sr<br />
The impurity corrected assay of 89 Sr is:<br />
A<br />
Sr −89<br />
=<br />
1 + x<br />
A<br />
Sr −85<br />
M<br />
⎛ R<br />
⎜<br />
⎝ R<br />
Sr −89<br />
Sr −85<br />
⎞<br />
⎟<br />
⎠<br />
(6)<br />
=<br />
1 +<br />
180<br />
( 0.<br />
001 x 186)<br />
=<br />
152 MBq<br />
EXAMPLE 2.<br />
Capintec calibrator: 89 Sr containing a 85 Sr impurity in a 10R Schott vial<br />
The vial containing <strong>the</strong> 89 Sr was measured in <strong>the</strong> calibrator using <strong>the</strong> 89 Sr setting, C 0 :<br />
A M = 158 MBq ; <strong>the</strong> reading be<strong>for</strong>e impurity correction<br />
For this calibrator we know that [13]:<br />
C 0 = C Sr-89 = 565 x 100; <strong>the</strong> calibration setting <strong>for</strong> 89 Sr<br />
(R 0 /R 1 ) = (R Sr-89 /R Sr-85 ) = 40.0<br />
The calibration settings <strong>for</strong> Capintec chambers are not related in a directly proportionate manner<br />
so that (R Sr-89 /R Sr-85 ) is not equal to (C Sr-89 /C Sr-85 ). The ratio (R Sr-89 /R Sr-85 ) was determined<br />
experimentally.<br />
The percentage impurity at <strong>the</strong> time of <strong>the</strong> assay is calculated to be 0.1%. This value will have been<br />
calculated from <strong>the</strong> percentage impurity figure provided by <strong>the</strong> radiopharmaceutical supplier <strong>and</strong><br />
corrected to <strong>the</strong> time of <strong>the</strong> assay. (Remember that, where <strong>the</strong> half-life of all <strong>the</strong> radionuclides is<br />
not <strong>the</strong> same, <strong>the</strong> percentage impurity will be time dependent.)<br />
x Sr-85 = fraction of 85 Sr (by activity) = 0.001<br />
A Sr-89 = <strong>the</strong> activity of 89 Sr
Chapter 2 Good Practice Guide 93 29<br />
The impurity corrected assay of 89 Sr is:<br />
A<br />
Sr −89<br />
=<br />
1 + x<br />
A<br />
Sr −85<br />
M<br />
⎛ R<br />
⎜<br />
⎝ R<br />
Sr −89<br />
Sr −85<br />
⎞<br />
⎟<br />
⎠<br />
=<br />
1 +<br />
158<br />
( 0.<br />
001 x 40.<br />
0)<br />
=<br />
152 MBq<br />
2.9 Nuclear Data<br />
For medical nuclides in common use, <strong>the</strong> relevant calibration factors should be well-established<br />
with traceability to national or international st<strong>and</strong>ards. This is <strong>the</strong> responsibility of <strong>the</strong> supplier.<br />
Where new calibration factors are required, <strong>for</strong> example, because of a change in container, this can<br />
be achieved without any detailed knowledge of <strong>the</strong> decay scheme characteristics of <strong>the</strong> nuclide.<br />
The only exception to this is that <strong>the</strong> half-life needs to be known to allow <strong>for</strong> decay between related<br />
measurements. For those medical nuclides in common use, half-lives are known to a sufficient<br />
accuracy that <strong>the</strong>y should not introduce any significant contribution to <strong>the</strong> overall uncertainty of a<br />
measurement. Advice on <strong>the</strong> latest reliable half-life evaluations should be available from <strong>NPL</strong>.<br />
Where a new nuclide is to be assayed <strong>and</strong> a calibration factor is not available, it is possible to<br />
interpolate a calibration factor provided <strong>the</strong>re is an accurate knowledge of both <strong>the</strong> ionisation<br />
chamber energy response characteristic <strong>and</strong> <strong>the</strong> decay scheme of <strong>the</strong> radionuclide in question.<br />
However, <strong>the</strong> response characteristic may not be available (or even measured) <strong>and</strong> <strong>the</strong> decay<br />
scheme details may not be known sufficiently well. It is strongly recommended that advice is<br />
sought from expert centres (generally a national metrology institute with experience in this area)<br />
be<strong>for</strong>e this is undertaken.<br />
2.10 Simulated Sources<br />
The use of simulated sources has been shown to be a major cause of problems. A simulated source<br />
can never exactly mirror <strong>the</strong> characteristics of <strong>the</strong> radionuclide it is simulating. The ratio of its<br />
response to that of <strong>the</strong> simulated radionuclide will vary according to chamber type. Consider <strong>the</strong><br />
example of 57 Co used to simulate 99m Tc. Three different ionisation chambers were found to have<br />
ratios of 99m Tc: 57 Co calibration figures of 0.937, 0.863 <strong>and</strong> 1.098 respectively. It can be seen that,<br />
in <strong>the</strong> worst case, a simulated source that is “calibrated” using <strong>the</strong> second chamber <strong>and</strong> is <strong>the</strong>n used<br />
to calibrate <strong>the</strong> third chamber will produce an error of almost 28% in any subsequent assays of<br />
99m Tc using <strong>the</strong> third chamber.<br />
Although simulated sources may be used <strong>for</strong> long-term reproducibility measurements, it cannot be<br />
emphasised too strongly that <strong>the</strong>y must not be used <strong>for</strong> calibration. Any calibrations must be<br />
achieved with <strong>the</strong> nuclide under investigation, using sources having activities which are directly<br />
traceable to national or international st<strong>and</strong>ards.
30 Good Practice Guide 93 Chapter 2<br />
2.11 Specific Problem of Assaying Pure Beta Emitters<br />
Any list of radionuclides used clinically includes pure beta emitters, such as 90 Y, 32 P <strong>and</strong> 90 Sr. The<br />
conventional radionuclide calibrator, incorporating an ionisation chamber, is designed principally<br />
<strong>for</strong> <strong>the</strong> measurement of radioactivity when <strong>the</strong> spectrum of <strong>the</strong> radionuclide includes photon<br />
emissions. However, <strong>the</strong> sensitivity of such a device is low <strong>for</strong> beta radiations as most or all of <strong>the</strong><br />
beta particles are absorbed in or attenuated by <strong>the</strong> material of <strong>the</strong> source (e.g. <strong>the</strong> solution itself <strong>and</strong><br />
<strong>the</strong> container walls) <strong>and</strong> <strong>the</strong> walls of <strong>the</strong> ionisation chamber.<br />
The response from beta particles arises from bremsstrahlung radiation. As beta particles decelerate<br />
in an attenuating medium, a continuous spectrum of X-rays is produced. This bremsstrahlung<br />
(braking) radiation has intensity proportional to <strong>the</strong> square of <strong>the</strong> atomic number of <strong>the</strong> absorbing<br />
material <strong>and</strong> contributes to <strong>the</strong> current produced within <strong>the</strong> ionisation chamber. There<strong>for</strong>e, during<br />
assay of a radionuclide where <strong>the</strong> spectrum includes both beta <strong>and</strong> gamma radiations, most of <strong>the</strong><br />
current produced in <strong>the</strong> ionisation chamber is due to <strong>the</strong> interactions of <strong>the</strong> gamma photons with a<br />
much lower contribution from <strong>the</strong> beta particles. As an example, <strong>the</strong> current produced per MBq of<br />
131 I might be 30 times greater than that produced per MBq of 32 P.<br />
Pure beta emitting radionuclides are used generally <strong>for</strong> <strong>the</strong>rapeutic purposes <strong>and</strong> ‘it has been<br />
customary to dispense <strong>the</strong>rapeutic activities to within 5 per cent of that prescribed’ [25]. The source<br />
geometry <strong>and</strong> o<strong>the</strong>r factors affecting a measurement have been discussed in detail in this chapter.<br />
These factors are particularly important in <strong>the</strong> assay of pure beta emitters <strong>and</strong> particular attention<br />
must be paid to any corrections necessary due, <strong>for</strong> instance, to volume or container changes, in<br />
order to meet this more stringent accuracy requirement.<br />
At least one device is available, which uses a sodium iodide detector optimised <strong>for</strong> bremsstrahlung<br />
(Capintec Inc., Beta-C). The greater sensitivity of <strong>the</strong> sodium iodide detector results in a greater<br />
signal <strong>for</strong> <strong>the</strong> electrometer to measure. Improving <strong>the</strong> signal reduces <strong>the</strong> errors in <strong>the</strong> measurement.<br />
The accuracy of <strong>the</strong> Capintec instrument is stated to be ±5%, ‘relative to <strong>the</strong> st<strong>and</strong>ard sample used<br />
to calibrate <strong>the</strong> system’. The greater accuracy in a reading does not exclude <strong>the</strong> necessity <strong>for</strong><br />
scrupulous attention to <strong>the</strong> geometry <strong>and</strong> o<strong>the</strong>r corrections <strong>and</strong> <strong>the</strong> system must be calibrated <strong>for</strong> <strong>the</strong><br />
containers <strong>and</strong> volumes to be used clinically.
References<br />
3
32<br />
Good Practice Guide 93 Chapter 3<br />
References<br />
1 The Ionising Radiations Regulations 1999, HMSO, 1999.<br />
2 The Ionising Radiations (Medical Exposures) Regulations 2000, HMSO, 2000.<br />
3 A Parkin, J P Sephton, E G A Aird, J Hannan, A E Simpson, M J Woods.<br />
<strong>Protocol</strong> <strong>for</strong> <strong>Establishing</strong> <strong>and</strong> <strong>Maintaining</strong> <strong>the</strong> <strong>Calibration</strong> of Medical Radionuclide<br />
Calibrators <strong>and</strong> <strong>the</strong>ir Quality Control.<br />
Proceedings of <strong>the</strong> joint IPSM/BIR Meeting on Quality St<strong>and</strong>ards in Nuclear Medicine,<br />
BIR, London, February 1992. Institute <strong>for</strong> Physical Sciences in Medicine Report No.65,<br />
1992.<br />
4 VIM<br />
International vocabulary of basic <strong>and</strong> general terms in metrology, 1993<br />
ISO, Geneva, Switzerl<strong>and</strong>. Second edition 1993.<br />
5 M J Woods.<br />
Intercomparison of 57 Co <strong>and</strong> 125 I in U.K. Hospitals 1980/81.<br />
<strong>NPL</strong> Report RS56, National Physical Laboratory, Teddington, 1981.<br />
6 M J Woods, M Ciocanel, J D Keightley.<br />
Intercomparison of 123 I Solution Sources in UK Hospitals, 1996.<br />
<strong>NPL</strong> Report CIRA(EXT)017, National Physical Laboratory, Teddington, 1997.<br />
7 M Baker, M J Woods.<br />
Intercomparison of 123 I Solution Sources in UK Hospitals, 2000.<br />
<strong>NPL</strong> Report CIRM 38, National Physical Laboratory, Teddington, 2000.<br />
8 M Baker, M J Woods.<br />
Intercomparison of 201 Tl Solution Sources in UK Hospitals, 2001.<br />
<strong>NPL</strong> Report CIRM 47, National Physical Laboratory, Teddington, 2001.<br />
9 M J Woods,<br />
Intercomparison of 99m Tc <strong>and</strong> 131 I by Radionuclide Calibrators in UK Hospitals, 1986.<br />
<strong>NPL</strong> Report RS(EXT)88, National Physical Laboratory, Teddington, 1987.<br />
10 M J Woods, M Ciocanel, J D Keightley.<br />
Intercomparison of 111 In Solution Sources in UK Hospitals, 1997.<br />
<strong>NPL</strong> Report CIRM 001, National Physical Laboratory, Teddington, 1997.<br />
11 M J Woods, J D Keightley, M Ciocanel.<br />
Intercomparison of 67 Ga Solution Sources in UK Hospitals, 1996.<br />
<strong>NPL</strong> Report CIRA(EXT)012, National Physical Laboratory, Teddington, 1996.<br />
12 M Ciocanel, J D Keightley, C J Scott, M J Woods.<br />
Intercomparisons of 131 I Solution <strong>and</strong> Capsule Sources in UK Hospitals, 1999.<br />
<strong>NPL</strong> Report CIRM 31, National Physical Laboratory, Teddington, 1999.
Chapter 3 Good Practice Guide 93 33<br />
13 D K Tyler, M I Baker, M J Woods<br />
Comparison of Strontium-89 Solution Sources in UK Hospitals, 2003.<br />
<strong>NPL</strong> Report DQL-RN 012, National Physical Laboratory, Teddington, 2005.<br />
14 ISO/IEC 17205:2005<br />
General requirements <strong>for</strong> <strong>the</strong> competence of testing <strong>and</strong> calibration laboratories.<br />
15 BIPM, IEC, IFCC, ISO, IUPAC, IUPAP, OIML.<br />
Guide to <strong>the</strong> Expression of Uncertainty in Measurement.<br />
ISO, Geneva, Switzerl<strong>and</strong>. ISBN 92-67-10188-9, First Edition 1993, corrected <strong>and</strong><br />
reprinted 1995.<br />
16 UKAS Publication M 3003.<br />
The Expression of Uncertainty <strong>and</strong> Confidence in Measurement.<br />
Edition 1, December 1997.<br />
17 A Beginner’s Guide to Uncertainty of Measurement<br />
<strong>NPL</strong> Measurement Good Practice Guide No. 11, 1999<br />
18 R J Kowalsky, R E Johnston, F H Chan.<br />
Journal of Nuclear Medicine Technology 5, 35-40, 1977.<br />
19 Proceedings ICRM Life Sciences Working Group Seminar (Paris, 1982).<br />
International Journal of Nuclear Medicine <strong>and</strong> Biology 10, 65-68, 1983<br />
20 M Baker.<br />
<strong>Calibration</strong> of <strong>the</strong> <strong>NPL</strong> secondary st<strong>and</strong>ard radionuclide calibrator <strong>for</strong> <strong>the</strong> new 10R Schott,<br />
Type 1+ vials.<br />
Journal of Applied Radiation <strong>and</strong> Isotopes, (in press), 2005.<br />
21 D K Tyler, M J Woods.<br />
Syringe calibration factors <strong>and</strong> volume correction factors <strong>for</strong> <strong>the</strong> <strong>NPL</strong> secondary st<strong>and</strong>ard<br />
radionuclide calibrator.<br />
<strong>NPL</strong> Report CIRM 56, National Physical Laboratory, Teddington, 2002.<br />
22 W Thomson<br />
Private communication<br />
23 M J Woods, W J Callow, P Christmas<br />
The <strong>NPL</strong> Radionuclide Calibrator – Type 271<br />
Int. J. Nucl. Med. Biol. 10, 127-132, 1983<br />
24 R D Gunasekera, A B Mostafa, A Notghi, L K Harding<br />
Tetrofosmin absorption onto syringes: is it significant?<br />
European Journal of Nuclear Medicine: 23; PMo873. p1250,1996<br />
25 IPEM<br />
Medical <strong>and</strong> Dental Guidance Notes (paragraph 12.7, p113)<br />
ISBN 1 903613 09 4 , York, 2002.


