Public Transport Model Calibration and Validation Report
Public Transport Model Calibration and Validation Report
Public Transport Model Calibration and Validation Report

Create successful ePaper yourself
Turn your PDF publications into a flip-book with our unique Google optimized e-Paper software.
2 Assignment <strong>Model</strong><br />
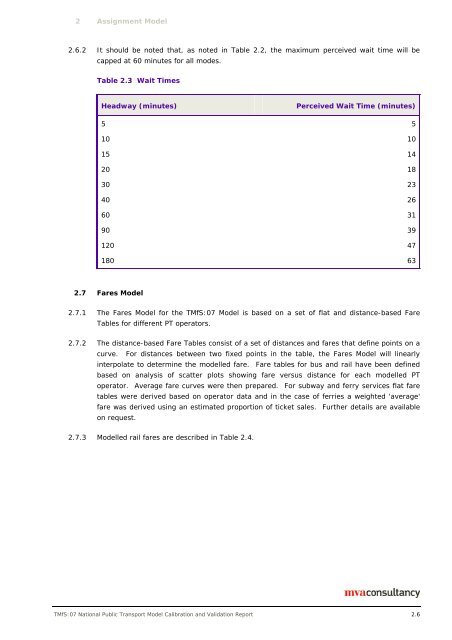
2.6.2 It should be noted that, as noted in Table 2.2, the maximum perceived wait time will be<br />
capped at 60 minutes for all modes.<br />
Table 2.3 Wait Times<br />
Headway (minutes)<br />
Perceived Wait Time (minutes)<br />
5 5<br />
10 10<br />
15 14<br />
20 18<br />
30 23<br />
40 26<br />
60 31<br />
90 39<br />
120 47<br />
180 63<br />
2.7 Fares <strong>Model</strong><br />
2.7.1 The Fares <strong>Model</strong> for the TMfS:07 <strong>Model</strong> is based on a set of flat <strong>and</strong> distance-based Fare<br />
Tables for different PT operators.<br />
2.7.2 The distance-based Fare Tables consist of a set of distances <strong>and</strong> fares that define points on a<br />
curve. For distances between two fixed points in the table, the Fares <strong>Model</strong> will linearly<br />
interpolate to determine the modelled fare. Fare tables for bus <strong>and</strong> rail have been defined<br />
based on analysis of scatter plots showing fare versus distance for each modelled PT<br />
operator. Average fare curves were then prepared. For subway <strong>and</strong> ferry services flat fare<br />
tables were derived based on operator data <strong>and</strong> in the case of ferries a weighted 'average'<br />
fare was derived using an estimated proportion of ticket sales. Further details are available<br />
on request.<br />
2.7.3 <strong>Model</strong>led rail fares are described in Table 2.4.<br />
TMfS:07 National <strong>Public</strong> <strong>Transport</strong> <strong>Model</strong> <strong>Calibration</strong> <strong>and</strong> <strong>Validation</strong> <strong>Report</strong> 2.6