Good Practice Guide to Phase Noise Measurement ... - Sequanux
Good Practice Guide to Phase Noise Measurement ... - Sequanux
Good Practice Guide to Phase Noise Measurement ... - Sequanux

Create successful ePaper yourself
Turn your PDF publications into a flip-book with our unique Google optimized e-Paper software.
<strong>Measurement</strong> <strong>Good</strong> <strong>Practice</strong> <strong>Guide</strong> No. 68<br />
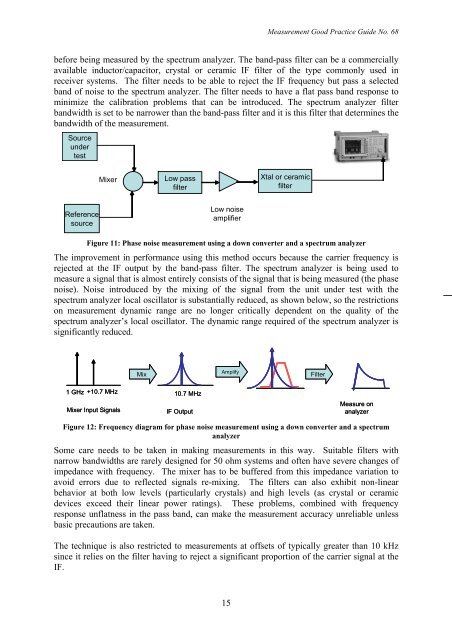
before being measured by the spectrum analyzer. The band-pass filter can be a commercially<br />
available induc<strong>to</strong>r/capaci<strong>to</strong>r, crystal or ceramic IF filter of the type commonly used in<br />
receiver systems. The filter needs <strong>to</strong> be able <strong>to</strong> reject the IF frequency but pass a selected<br />
band of noise <strong>to</strong> the spectrum analyzer. The filter needs <strong>to</strong> have a flat pass band response <strong>to</strong><br />
minimize the calibration problems that can be introduced. The spectrum analyzer filter<br />
bandwidth is set <strong>to</strong> be narrower than the band-pass filter and it is this filter that determines the<br />
bandwidth of the measurement.<br />
Source<br />
under<br />
test<br />
Mixer<br />
Low pass<br />
filter<br />
Xtal or ceramic<br />
filter<br />
Reference<br />
source<br />
Low noise<br />
amplifier<br />
Figure 11: <strong>Phase</strong> noise measurement using a down converter and a spectrum analyzer<br />
The improvement in performance using this method occurs because the carrier frequency is<br />
rejected at the IF output by the band-pass filter. The spectrum analyzer is being used <strong>to</strong><br />
measure a signal that is almost entirely consists of the signal that is being measured (the phase<br />
noise). <strong>Noise</strong> introduced by the mixing of the signal from the unit under test with the<br />
spectrum analyzer local oscilla<strong>to</strong>r is substantially reduced, as shown below, so the restrictions<br />
on measurement dynamic range are no longer critically dependent on the quality of the<br />
spectrum analyzer’s local oscilla<strong>to</strong>r. The dynamic range required of the spectrum analyzer is<br />
significantly reduced.<br />
Mix<br />
Amplify<br />
Filter<br />
1 GHz +10.7 MHz<br />
Mixer Input Signals<br />
10.7 MHz<br />
IF Output<br />
Measure on<br />
analyzer<br />
Figure 12: Frequency diagram for phase noise measurement using a down converter and a spectrum<br />
analyzer<br />
Some care needs <strong>to</strong> be taken in making measurements in this way. Suitable filters with<br />
narrow bandwidths are rarely designed for 50 ohm systems and often have severe changes of<br />
impedance with frequency. The mixer has <strong>to</strong> be buffered from this impedance variation <strong>to</strong><br />
avoid errors due <strong>to</strong> reflected signals re-mixing. The filters can also exhibit non-linear<br />
behavior at both low levels (particularly crystals) and high levels (as crystal or ceramic<br />
devices exceed their linear power ratings). These problems, combined with frequency<br />
response unflatness in the pass band, can make the measurement accuracy unreliable unless<br />
basic precautions are taken.<br />
The technique is also restricted <strong>to</strong> measurements at offsets of typically greater than 10 kHz<br />
since it relies on the filter having <strong>to</strong> reject a significant proportion of the carrier signal at the<br />
IF.<br />
15