Macquarie Equities Research - Discovery Metals Limited
Macquarie Equities Research - Discovery Metals Limited
Macquarie Equities Research - Discovery Metals Limited

Create successful ePaper yourself
Turn your PDF publications into a flip-book with our unique Google optimized e-Paper software.
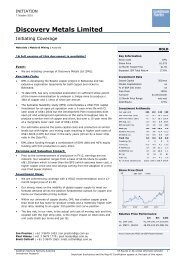
AUSTRALIA<br />
DML AU<br />
Price 2 Jun 10<br />
Outperform<br />
A$0.76<br />
Relative to ex 100<br />
Volatility index<br />
12-month target A$ 1.00<br />
12-month TSR % +31.6<br />
Valuation A$<br />
- DCF (WACC 12.0%, beta 2.0, ERP 5.5%, RFR 6.0%)<br />
0.99<br />
GICS sector<br />
Materials<br />
Market cap A$m 227<br />
30-day avg turnover A$m 0.8<br />
Number shares on issue m 298.6<br />
Investment fundamentals<br />
Year end 30 Jun<br />
2009A 2010E 2011E 2012E<br />
Sales revenue m 0.0 0.0 0.0 88.7<br />
EBIT m -5.0 -7.5 -11.0 18.4<br />
Reported profit m -4.4 -5.4 -9.5 8.3<br />
Adjusted profit m -4.4 -5.4 -9.5 8.3<br />
Gross cashflow m -3.7 -2.9 -4.5 24.7<br />
CFPS ¢ -1.9 -1.0 -1.0 5.8<br />
CFPS growth % 28.5 48.2 -6.8 nmf<br />
PGCFPS x nmf nmf nmf 13.2<br />
PGCFPS rel x nmf nmf nmf nmf<br />
EPS adj ¢ -2.3 -1.7 -2.2 1.9<br />
EPS adj growth % 14.5 27.9 -31.7 nmf<br />
PER adj x nmf nmf nmf 39.1<br />
PER rel x nmf nmf nmf nmf<br />
Total DPS ¢ 0.0 0.0 0.0 0.0<br />
Total div yield % 0.0 0.0 0.0 0.0<br />
Franking % nmf nmf nmf nmf<br />
ROA % -20.8 -15.4 -6.8 7.0<br />
ROE % -19.7 -11.6 -8.7 5.4<br />
EV/EBITDA x -34.1 -52.7 -51.4 8.9<br />
Net debt/equity % -28.2 -45.9 53.1 54.0<br />
P/BV x 5.2 4.4 2.1 2.2<br />
Source: FactSet, <strong>Macquarie</strong> <strong>Research</strong>, June 2010<br />
(all figures in AUD unless noted)<br />
Len Eldridge<br />
61 8 9224 0838 Len.Eldridge@macquarie.com<br />
Martin Stulpner, CFA<br />
61 8 9224 0866 Martin.Stulpner@macquarie.com<br />
<strong>Discovery</strong> <strong>Metals</strong> Ltd.<br />
A copper producer in the making<br />
<strong>Discovery</strong> <strong>Metals</strong> (DML) is an emerging copper producer focused on developing<br />
the Boseto copper project in Botswana. DML acquired its tenement package in<br />
Botswana in 2005 and has delineated an aggregate resource of 102mt at 1.4%<br />
copper for 1.42mt contained copper.<br />
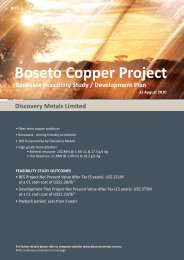
Boseto to generate early cashflow. DML is due to deliver the Boseto BFS in<br />
July 2010, based on a 3mpta plant. The parameters for the Boseto project have<br />
evolved from the initial 2mtpa plant study following significant exploration<br />
success in the drilling campaign over the past 12 months. We have assumed<br />
project capex of US$185m for construction of the Boseto project and we forecast<br />
average production of 36ktpa copper at cash costs of US$1.56/lb (real $2010,<br />
including royalties) over a 13 year LOM. We have modelled 3mtpa mine<br />
production exclusively from an open pit in years 1-4 with 1mtpa of underground<br />
ore to supplement 2mtpa open pit material from year five.<br />
Our base case 13 year LOM assumption appears to be conservative as we have<br />
modelled the open pit on M&I resources only and not included the ~50mt of open<br />
pit material in the inferred category. Subject to the prevailing copper price<br />
environment (given the grade and high strip ratio of deposits at Boseto) we see<br />
significant upside to our LOM forecast.<br />
A significant exploration footprint. DML has an extensive tenement package<br />
in Northern Botswana, which runs ~300km to the Botswana and Namibian<br />
border targeting the Kalahari copper belt. The Kalahari copper belt is interpreted<br />
to be part of the Pan African mobile belt, which contains well known and prolific<br />
copper belts in Zambia and the DRC. DML has indicated it has indentified<br />
1,300km of potential strike length, with Boseto resources covering only 30km of<br />
the prospective strike length. The focus of exploration over the past 12 months<br />
has been infill drilling at Boseto; now the resources are in place to underpin the<br />
BFS we expect the focus to begin to shift to regional targets.<br />
Risks. Taking a project from the exploration phase through funding, construction<br />
and ultimately production is inherently challenging. DML is set to complete the<br />
Boseto BFS in July, which will then see DML move to secure project funding (we<br />
have assumed 50:50 debt to equity mix). The construction phase of the project<br />
does not appear to present many technical challenges with major sealed<br />
highways providing site access; however, the risk of equipment delivery delays<br />
and capex over-runs is ever present. Once operational, project specific risks<br />
include the floating of oxide copper which is prevalent in the upper parts of the<br />
ore body (though makes up only 5% of mined material over LOM) and a narrow<br />
ore body leading to a high strip ratio.<br />
Action and recommendation. We initiate coverage with an Outperform<br />
recommendation and A$1.00ps price target. DML is well positioned to progress<br />
Boseto from an exploration project to production over the coming 18 months.<br />
Given the extensive tenement package and first mover advantage in the Kalahari<br />
Copper Belt, we view the Boseto project as a starter project and believe there is<br />
potential for a significant increase in the resource base and a material increase<br />
to our base case 13 year LOM assumption.<br />
3 June 2010<br />
Please refer to the important disclosures and analyst certification on page 2 and the inside back cover of this<br />
document, or on our website www.macquarie.com.au/research/disclosures.
<strong>Macquarie</strong> <strong>Research</strong><br />
<strong>Discovery</strong> <strong>Metals</strong> Ltd.<br />
Inside<br />
A copper producer in the making 3<br />
Financials 10<br />
Risks 12<br />
Boseto overview 13<br />
Mining in Botswana 26<br />
Botswana country profile 30<br />
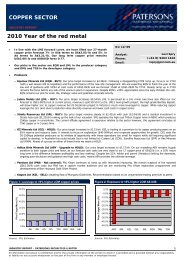
Copper 31<br />
Board & Management 34<br />
<strong>Discovery</strong> <strong>Metals</strong><br />
Company profile<br />
• <strong>Discovery</strong> <strong>Metals</strong> (DML) is an emerging copper producer focused on<br />
developing the Boseto copper project in Botswana. DML acquired its<br />
tenement package in Botswana in 2005 and has delineated an aggregate<br />
resource of 102mt at 1.4% copper for 1.42mt contained copper.<br />
• The Boseto Copper project is located in the northwest corner of Botswana,<br />
~80km from the town of Maun. DML acquired a seven tenement package from<br />
the Government of Botswana in 2005, and the tenement package was<br />
renewed in 2008. DML secured a further seven tenements to the southwest of<br />
the original package in 2008. DML‟s tenement package covers 10,100km 2 ,<br />
starting ~60km southeast of Maun and stretching ~300km to the Namibian<br />
boarder.<br />
• DML is due to deliver the Boseto BFS in July 2010, based on a 3mpta plant<br />
footprint. The parameters for the Boseto project have evolved from the initial<br />
2mtpa plant study following significant exploration success in the drilling<br />
campaign over the past 12 months. We have assumed project capex of<br />
US$185m for construction of the Boseto project and we forecast average<br />
production of 36ktpa copper at cash costs of US$1.56/lb (real $2010,<br />
including royalties) over a 13 year LOM. We have modelled 3mtpa mine<br />
production exclusively from an open pit in years 1- 4 with 1mtpa of<br />
underground ore to supplement 2mtpa open pit material from year five.<br />
• Now that the initial Boseto project has sufficient resources to underpin a 13<br />
year LOM, DML will begin to refocus its exploration efforts on regional<br />
exploration targets in an attempt to define a “Boseto 2” project, now that<br />
sufficient resources have been indentified to underpin at least a 13 year LOM<br />
at Boseto. At present only 328km of the prospective 1,300km of indentified<br />
strike length has been explored by a soil sampling program, with only 67km of<br />
the 1,300km drilled to date. DML collected soil samples covering 108km of<br />
prospective strike in the March quarter with the results undergoing quality<br />
control checks prior to release.<br />
Fig 1<br />
DML AU vs Small Ordinaries<br />
Source: FactSet, <strong>Macquarie</strong> <strong>Research</strong>, June 2010<br />
(all figures in AUD unless noted)<br />
3 June 2010 2
<strong>Macquarie</strong> <strong>Research</strong><br />
<strong>Discovery</strong> <strong>Metals</strong> Ltd.<br />
A copper producer in the making<br />
We have assumed a<br />
50:50 debt:equity<br />
funding package<br />
We initiate coverage of <strong>Discovery</strong> <strong>Metals</strong> (DML) with an Outperform recommendation and<br />
A$1.00ps price target. Our price target is based on our funded DCF valuation, assuming<br />
50:50 debt/equity funding, with equity raised at the current share price of A$0.77ps; however,<br />
we have considered a number of ranges (-20% to +30%) for the pricing of an equity raising.<br />
Fig 2 Unfunded <strong>Discovery</strong> <strong>Metals</strong> NPV valuation<br />
Segment A$m A$ps<br />
Boseto 233 0.78<br />
Exploration 60 0.17<br />
G&A -32 -0.11<br />
Net cash/(debt) 34 0.12<br />
DML NPV 295 0.99<br />
Shares on issue ($m) 299<br />
Source: <strong>Macquarie</strong> <strong>Research</strong>, June 2010<br />
Our Boseto project valuation is based on a 3mtpa plant as guided by the BFS update<br />
released in May 2010. The Boseto project has been upgraded from the initial scope of the<br />
BFS which was based on a 2mtpa plant. The BFS for the 3mtpa project is due to be released<br />
in July. DML has not provided formal production, capex or cost guidance for the 3mtpa<br />
project, which is understandable as work is ongoing to determine appropriate mine schedules<br />
and fleet configuration for the accelerated open pit mining rate.<br />
Boseto modelling<br />
based on 3mtpa<br />
plant over an initial<br />
13 year LOM<br />
We have based our project modelling on the open pit M&I resource base as of April 2010 and<br />
the underground mining inventory used in the underground scoping study released in March<br />
2010. Based on the key mine parameters set out in Fig 3 we are forecasting average copper<br />
production of 36ktpa and silver of 1,054moz at US$1.56/lb (real $2010) over a 13 year LOM.<br />
Fig 3 Key Boseto mine assumptions<br />
Parameter Year 1-4 Years 4-13<br />
Open pit mined tonnes mt 3.0 2.0<br />
Strip ratio X 10 10<br />
Underground mined tonnes mt 0.0 1.0<br />
Milled tonnes mt 3.0 3.0<br />
Copper grade % 1.4 1.5<br />
Copper recoveries % 81.0 86.0<br />
Copper production kt 27.1 35.7<br />
Silver grade g/t 18.7 18.7<br />
Silver recoveries % 60 60<br />
Silver production koz 945.6 1097<br />
Copper/silver revenue % 93 94<br />
Concentrate grade Cu % 40 40<br />
Concentrate produced kt 67 82<br />
Cash costs (real $2010) US$/lb 1.35 1.68<br />
Source: <strong>Macquarie</strong> <strong>Research</strong>, June 2010<br />
Our base case 13 year LOM assumption appears to be conservative as we have modelled<br />
the open pit on M&I resources only and not included the ~50mt of open pitable material in the<br />
inferred resource category. Subject to the prevailing copper price environment (given the<br />
grade and high strip ratio of deposits at Boseto), we see significant upside to our LOM<br />
forecast and subsequent asset valuation.<br />
3 June 2010 3
<strong>Macquarie</strong> <strong>Research</strong><br />
<strong>Discovery</strong> <strong>Metals</strong> Ltd.<br />
Fig 4<br />
Boseto base case production profile (FY’s)<br />
Copper (kt)<br />
40<br />
35<br />
30<br />
25<br />
20<br />
15<br />
10<br />
5<br />
(US$/lb)<br />
2.50<br />
2.00<br />
1.50<br />
1.00<br />
0.50<br />
0<br />
2011 2012 2013 2014 2015 2016 2017 2018 2019 2020 2021 2022 2023 2024 2025 2026<br />
Copper Total costs (inc credits real 2010$)<br />
0.00<br />
Source: <strong>Macquarie</strong> <strong>Research</strong>, June 2010<br />
Copper is our<br />
preferred base<br />
metals exposure<br />
We are bullish on the outlook for the copper market and foresee a deficit in 2011. We find it<br />
difficult, even in a poorer than expected European and Chinese growth scenario, to model<br />
copper in anything other than deficit in 2011. Currently our forecast is for a 570kt deficit next<br />
year (downside with poor Europe scenario and slow Chinese growth is balance / very small<br />
deficit). All of the main end use markets in China still look set to grow in line with our forecasts<br />
in 2010 and 2011 and our ex-China numbers still look moderate.<br />
Fig 5 Our price deck<br />
Spot 2010 2011 2012 2013 2014 2015<br />
LT<br />
(real<br />
2010$)<br />
Copper (US$/lb) 3.13 3.40 3.50 3.00 2.70 2.70 2.60 2.20<br />
Silver (US$/oz) 18.53 17.30 16.90 15.40 14.60 13.80 14.20 14.00<br />
AUD/USD 0.85 0.91 0.86 0.80 0.80 0.80 0.80 0.80<br />
Source: <strong>Macquarie</strong> <strong>Research</strong>, June 2010<br />
Valuation is highly<br />
leveraged to our<br />
copper price<br />
assumption<br />
With copper accounting for ~94% of our forecast DML revenue, our DCF valuation is<br />
particularly sensitive to our copper price assumption. Operating costs also have the potential<br />
to have a material impact on project economics, as with cash costs of US$1.56/lb, we expect<br />
Boseto to be in the top half of the cost curve. Given the relatively low capital intensity of the<br />
Boseto project (~US$5,000/t) our valuation is not overly sensitive to capex.<br />
Fig 6 DML unfunded valuation sensitivity<br />
$ps<br />
2.50<br />
2.00<br />
1.50<br />
1.00<br />
0.50<br />
0.00<br />
-0.50<br />
-30% -20% -10% 0% 10% 20% 30%<br />
Copper price Opex Capex Discount rate Share price<br />
Source: <strong>Macquarie</strong> <strong>Research</strong>, June 2010<br />
3 June 2010 4
C1 Cash Cost (c/lb Cu)<br />
C1 Cash Cost (c/lb Cu)<br />
<strong>Macquarie</strong> <strong>Research</strong><br />
<strong>Discovery</strong> <strong>Metals</strong> Ltd.<br />
Boseto will not be a<br />
low cost producer…<br />
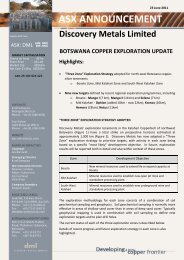
Average LOM cash costs of US$1.56/lb have DML straddling the boundary between the 3rd<br />
and 4th quartile of the 2010 copper cost curve. However, we note that Boseto costs in the<br />
first four years will be below the LOM average as ore will be sourced solely from the open pit.<br />
Fig 7 2010 Brook Hunt copper cost curve<br />
250<br />
2010 C1 Composite Cost Curve For Copper Mines - By Minesite<br />
225<br />
200<br />
175<br />
Boseto LOM<br />
average position<br />
150<br />
125<br />
100<br />
75<br />
50<br />
25<br />
0<br />
0 4000 8000 12000 16000 20000 24000 28000 32000<br />
Cumulative Production (Paid Mlbs Cu)<br />
Source Brook Hunt - A Wood M ackenzie Company<br />
Source: Brook Hunt, <strong>Macquarie</strong> <strong>Research</strong>, June 2010<br />
However, Boseto is<br />
likely to become<br />
more competitive<br />
as the cost curve<br />
shifts upwards<br />
Looking forward, we expect the Boseto project to increase in competitiveness, as the cost<br />
curve shifts upwards over the next 3-5 years. The upwards shift in the copper cost curve<br />
reflects our (and many in the market‟s) bullish view on copper, with costs to be driven higher<br />
by declining grade profiles, the start-up of lower grade mines with large capex requirements<br />
and the increasing percentage of greenfield projects in countries with a higher level of<br />
geopolitical risk which will a higher returns on capital to justify investment.<br />
Fig 8 2015 Brook Hunt copper cost curve<br />
250<br />
2015 C1 Composite Cost Curve For Copper Mines - By Minesite<br />
225<br />
200<br />
175<br />
150<br />
125<br />
Boseto LOM<br />
average position<br />
100<br />
75<br />
50<br />
25<br />
0<br />
0 4000 8000 12000 16000 20000 24000 28000 32000 36000 40000<br />
Cumulative Production (Paid Mlbs Cu)<br />
Source Brook Hunt - A Wood M ackenzie Company<br />
Source: Brook Hunt, <strong>Macquarie</strong> <strong>Research</strong>, June 2010<br />
3 June 2010 5
<strong>Macquarie</strong> <strong>Research</strong><br />
<strong>Discovery</strong> <strong>Metals</strong> Ltd.<br />
The peer group comparisons<br />
Potential for a re<br />
rating as DML<br />
becomes a producer<br />
First mover<br />
exploration upside<br />
in Northern<br />
Botswana<br />
DML is the fifth pure copper play under our coverage; of the five, three are producers and two<br />
are developers.<br />
Fig 9 ASX copper producers and near term developers<br />
Company Code<br />
Price<br />
(A$ps)<br />
Market<br />
cap<br />
(A$ps)<br />
Net<br />
cash/(debt)<br />
(A$m)<br />
EV<br />
(A$m) Status Project Location<br />
<strong>Discovery</strong> DML 0.77 229 34 195 E&D Boseto Botswana<br />
OZ<br />
Minerals OZL 1.06 3,308 971 2,337 Producer<br />
Prominent<br />
Hill Australia<br />
Equinox EQN 4.13 2,920 -430 3,350 Producer Lumwana Zambia<br />
PanAust PNA 0.48 1,418 -38 1,456 Producer Phu Kham Laos<br />
Indophil IRN 1.14 480 27 453 E&D Tampakan Philippines<br />
Citadel* CGG 0.32 468 26 442 E&D<br />
Jabal<br />
Sayid Saudi Arabia<br />
Sandfire* SFR 3.26 421 52 369 E&D Degrussa Australia<br />
*CGG & SFR not under research coverage<br />
Price as at 1 June 2010<br />
Source: IRESS, Company Data, <strong>Macquarie</strong> <strong>Research</strong>, June 2010<br />
On the current Boseto project resource, DML lacks the scale of the three pure copper<br />
producers on the ASX. However, DML has an exciting exploration program which appears to<br />
be at least the equal of the three producers‟. Given the potential for near mine resource<br />
conversion (to add material tonnes to our base case Boseto LOM assumption) and the<br />
regional potential of the largely unexplored tenement package, we believe DML has the<br />
potential to add significant value through the drill as well as the potential for a re-rating as it<br />
progresses from explorer to producer.<br />
Fig 10 Relative investment metrics for our ASX pure copper universe<br />
Share price<br />
(A$ps)<br />
NPV<br />
($ps)<br />
PER<br />
EV/EBITDA<br />
P/NPV 2010 2011 2012 2013 2010 2011 2012 2013<br />
<strong>Discovery</strong>* 0.77 0.98 0.79 nmf nmf 39.50 6.00 nmf nmf 13.8 2.9<br />
OZ<br />
Minerals** 1.06 1.32 0.80 8.54 7.85 8.69 12.21 2.72 1.87 1.71 1.73<br />
Equinox 4.13 4.37 0.95 6.97 6.04 7.78 10.34 6.35 3.29 3.25 3.51<br />
PanAust 0.48 0.47 1.02 5.98 6.43 7.33 9.99 3.49 2.50 2.16 2.19<br />
Indophil 1.14 0.94 1.21 nmf nmf nmf nmf nmf nmf nmf nmf<br />
*DML has a June year end, **OZL valuation is not adjusted for potential Australian RSPT impact<br />
Price as at 1 June 2010<br />
Source: IRESS, <strong>Macquarie</strong> <strong>Research</strong>, June 2010<br />
With the exception of EQN, our pure play copper universe is largely at steady state<br />
production rates and we do not forecast material increases in mine production between now<br />
and 2014. In addition to DML, we see the potential for two other ASX explorers to join the<br />
ranks of pure copper producers over the next 18-24 months - Citadel Resource Group and<br />
Sandfire Resources.<br />
3 June 2010 6
Equniox<br />
Indophil<br />
PacMag<br />
Ivanhoe<br />
OZ Minerals<br />
Marengo<br />
Pan Aust<br />
Aditya Birla<br />
<strong>Discovery</strong><br />
Anvil Mining<br />
Universal<br />
Blackthorn<br />
Citadel<br />
Tiger<br />
Cudeco<br />
Avalon<br />
Exco<br />
Sandfire<br />
Havilah<br />
Hillgrove<br />
Finders<br />
<strong>Macquarie</strong> <strong>Research</strong><br />
<strong>Discovery</strong> <strong>Metals</strong> Ltd.<br />
Fig 11 <strong>Macquarie</strong>’s ASX copper universe production profile<br />
kt copper<br />
180<br />
160<br />
140<br />
120<br />
100<br />
80<br />
60<br />
40<br />
20<br />
0<br />
Equinox OZ Minerals PanAust <strong>Discovery</strong> Kagara Straits<br />
2010 2011 2012 2013 2014<br />
Source: <strong>Macquarie</strong> <strong>Research</strong>, June 2010<br />
Citadel Resource Group (CGG.AU)<br />
CGG is focused on the Jabal Sayid project in Saudi Arabia, in which it currently has a 70%<br />
interest. Jabal Sayid is an underground project with a reserve of 24.4mt at 2.2% copper and<br />
0.25g/t gold to support production of ~57ktpa copper at cash costs of US$0.97/lb over an<br />
initial ten year LOM. CGG has recently received the mining licence for the Jabal Sayid and<br />
expects to commence construction of the US$280m project immediately with a target of<br />
project commissioning in 3Q11.<br />
Sandfire Resources (SFR.AU)<br />
SFR is focused on the Doolgunna project in Western Australia. The Degrussa deposit (7.13mt<br />
at 5.2% copper & 1.9g/t gold) is arguably the most exciting discovery by an ASX listed copper<br />
producer in recent times. Degrussa is a VMS style system and SFR is understandably excited<br />
by the potential for further discoveries at the broader Doolgunna project. SFR is currently<br />
completing a pre-feasibility study with a target of first production in mid 2012. SFR‟s major<br />
shareholder is POSCO which has a 17% interest.<br />
Fig 12 ASX copper resource bases<br />
kt copper<br />
7,000<br />
6,000<br />
5,000<br />
4,000<br />
3,000<br />
2,000<br />
1,000<br />
0<br />
Source: Company data, <strong>Macquarie</strong> <strong>Research</strong>, June 2010<br />
3 June 2010 7
Sandfire<br />
OZ Minerals<br />
Cudeco<br />
Pan Aust<br />
Equinox<br />
Citadel<br />
Straits<br />
Anvil<br />
Ivanhoe<br />
Finders<br />
<strong>Discovery</strong><br />
Aditya Birla<br />
Tiger<br />
Hillgrove<br />
Exco<br />
Blackthorn<br />
Indophil<br />
Havilah<br />
Redbank<br />
Avalon<br />
PacMag<br />
Universal<br />
Marengo<br />
<strong>Macquarie</strong> <strong>Research</strong><br />
<strong>Discovery</strong> <strong>Metals</strong> Ltd.<br />
Fig 13 EV/Resource metrics<br />
A$/t copper<br />
1200<br />
1000<br />
800<br />
600<br />
400<br />
200<br />
0<br />
Source: IRESS, Company data, <strong>Macquarie</strong> <strong>Research</strong>, June 2010<br />
3 June 2010 8
<strong>Macquarie</strong> <strong>Research</strong><br />
<strong>Discovery</strong> <strong>Metals</strong> Ltd.<br />
Share register<br />
The DML share register is relatively concentrated with the six largest shareholders accounting<br />
for ~47% of register.<br />
Fig 14 DML share register<br />
Shareholder %<br />
<strong>Macquarie</strong> Bank 11.5<br />
Taurus Fund 11.1<br />
Transamine 8.3<br />
Citi Group Global Markets 7.1<br />
Investec (Botswana) 5.2<br />
BIFM (Botswana) 3.6<br />
Source: DML, <strong>Macquarie</strong> <strong>Research</strong>, June 2010<br />
<strong>Macquarie</strong> Bank. The <strong>Macquarie</strong> Bank holding is held by the <strong>Metals</strong> and Energy Capital<br />
division which specialises in early stage resource project funding. <strong>Macquarie</strong>‟s initial<br />
investment was a placement of 5m shares at A$0.23ps in August 2006.<br />
Taurus Fund. Taurus is an Australian based investment fund manager which<br />
specialises in investment products based on the natural resources industry.<br />
Transamine. In March 2010, DML entered into an offtake agreement with metals trader<br />
Transamine for 100% of Boseto concentrate for a minimum of five years. As part of the<br />
offtake agreement DML placed 25m shares (9.8% of DML shares) to Transamine at A$0.76ps<br />
(to raise A$19m) which was an 11% premium to the four week VWAP at the time of<br />
placement.<br />
Investec Asset Management & Fleming Asset Management Botswana. DML placed<br />
8.89m shares to Investec and Fleming in March 2007<br />
Citi Group Global Markets. This holding represents the shareholding sold by Resource<br />
Capital Funds to Soros in April 2010.<br />
3 June 2010 9
<strong>Macquarie</strong> <strong>Research</strong><br />
<strong>Discovery</strong> <strong>Metals</strong> Ltd.<br />
Financials<br />
The historical DML financial statements are reflective of a metals exploration company in the<br />
feasibility study phase of its initial project. The last reported cash balance was A$34m as at<br />
31 March with ~A$10m of cash inflows expected during the June quarter due to option<br />
exercises.<br />
Exploration budget<br />
of A$10m over the<br />
coming 8 months<br />
The current cash balance will see DML through to completion of the BFS in July and is likely<br />
to allow DML to place orders for long lead time items prior to the completion of debt/equity<br />
finance. The exploration budget for the coming eight months is A$10m.<br />
Capital raising history<br />
DML listed on the ASX in December 2003 with an A$8m IPO. The most recent capital raising<br />
was the placement to Transamine as part of the offtake agreement for the first five years of<br />
Boseto production.<br />
Fig 15 DML capital raising history<br />
Placement month Price (A$ps) Shares issued (m) Net proceeds (A$m)<br />
Jun-07 $0.26 3.5 $0.90<br />
Aug-07 $0.36 34.3 $11.30<br />
Aug-08 $0.42 20.0 $8.00<br />
Feb-09 $0.18 12.8 $2.30<br />
Apr-09 $0.18 9.0 $1.50<br />
Jun-09 $0.18 22.2 $4.00<br />
Oct-09 $0.45 29.1 $13.10<br />
Nov-09 $0.45 5.9 $2.68<br />
Mar-10 $0.76 25.0 $19.00<br />
Source: DML, <strong>Macquarie</strong> <strong>Research</strong>, June 2010<br />
Project funding scenarios<br />
We have assumed<br />
capex of US$185m<br />
with 50:50<br />
debt:equity funding<br />
A formal capex forecast for the 3mtpa project is yet to be released. The capex forecast for the<br />
2mtpa was US$150m, which was last updated in October 2009. With the release of the<br />
decision to upgrade the project scope to 3mtpa, DML awarded the EPC contract for plant<br />
construction to Sedgman <strong>Limited</strong> for a „maximum price‟ of US$85m. The plant capex for a<br />
2mtpa plant was estimated at A$70m, meaning the US$19m contingency estimate for plant<br />
capex in the US$150m for the 2mtpa project has essentially been consumed by the increase<br />
in plant capacity.<br />
The final structure of a finance package is yet to be determined; however, with the first five<br />
years production sold to Transamine the project appears to lend itself to traditional project<br />
debt and equity financing.<br />
To get a feel for how a funded and operational DML valuation looks we have assumed a<br />
target debt to equity funding ratio of 50:50. We have included a number of equity raising<br />
scenarios in order to provide a conceptual per share valuation once Boseto is developed. The<br />
table below is broken out into our project valuation at 1 July 2011, a net debt balance equal to<br />
a project finance facility and number of shares dependent on a range of equity raising<br />
scenarios. We have then discounted this valuation back to today at a rate of 10% pa to reflect<br />
the opportunity cost of capital. We have not taken into account any potential hedging<br />
requirements as part of a project debt facility.<br />
Fig 16<br />
DML funded valuation scenarios under various equity raising pricing<br />
$m -20% -10% 0.77 10% 20% 30%<br />
Shares on issue 297 297 297 297 297 297<br />
Shares issued for equity fudning 152 135 121 110 101 93<br />
Shares on issue post funding 449 432 419 408 398 391<br />
Boseto at 1 July 2011 517 1.15 1.20 1.24 1.27 1.30 1.32<br />
G&A -32 -0.07 -0.07 -0.08 -0.08 -0.08 -0.08<br />
Exploration 60 0.13 0.14 0.14 0.15 0.15 0.15<br />
Net Debt -78 -0.17 -0.18 -0.19 -0.19 -0.19 -0.20<br />
NPV at 1 July 2011 1.04 1.08 1.12 1.15 1.17 1.20<br />
Discount factor 1.10 1.10 1.10 1.10 1.10 1.10<br />
NPV discount back to today 0.95 0.98 1.02 1.04 1.07 1.09<br />
Source: <strong>Macquarie</strong> <strong>Research</strong>, June 2010<br />
3 June 2010 10
<strong>Macquarie</strong> <strong>Research</strong><br />
<strong>Discovery</strong> <strong>Metals</strong> Ltd.<br />
Fig 17 <strong>Discovery</strong> financial summary<br />
<strong>Discovery</strong> <strong>Metals</strong> (DML) Share price 0.77<br />
Y/E 30 June<br />
Profit & Loss 2010 2011 2012 2013 2014 2015 Production and price assumptions<br />
Total revenue A$m 0 0 89 250 276 271 Production 2010 2011 2012 2013 2014 2015<br />
Mine costs A$m 0 0 -48 -131 -150 -177 Copper (kt) 0.0 0.0 10.2 30.7 35.7 35.7<br />
Corporate cost A$m -5 -6 -6 -6 -6 -6 Silver (koz)<br />
Exploration A$m -3 -5 -5 -10 -8 -5 Costs 2010 2011 2012 2013 2014 2015<br />
EBITDA A$m -7 -11 30 102 112 83 Cash costs (US$/lb) 0.00 0.00 1.45 1.27 1.22 1.44<br />
Depreciation A$m 0 0 -11 -29 -29 -29<br />
Underlying EBIT A$m -7 -11 18 73 83 54 Prices 2010 2011 2012 2013 2014 2015<br />
Non recurring EBIT A$m 0 0 0 0 0 0 Copper (US$/lb) 3.13 3.55 3.15 2.85 2.70 2.65<br />
Total EBIT A$m -7 -11 18 73 83 54 Silver (US/oz) 0.17 0.17 0.16 0.15 0.14 0.14<br />
Net interest A$m 0 -3 -7 -5 -3 0 AUD:USD 0.89 0.92 0.82 0.80 0.80 0.80<br />
Pre-tax profit A$m -7 -14 12 68 81 54<br />
Underlying tax expense A$m 2 4 -4 -20 -24 -16<br />
Non recurring tax expense A$m 0 0 0 0 0 0<br />
Minority Interest A$m 0 0 0 0 0 0 Net Present Value @ 12% A$m A$ps<br />
Reported profit A$m -5 -9 8 47 56 38 Boseto 233 0.78<br />
Adjusted profit A$m -5 -9 8 47 56 38 G & A -32 -0.11<br />
EPS adjusted Acps -2.2 -2.4 1.9 11.0 13.2 8.8 Net cash/(debt) 34 0.11<br />
EPS growth % nmf 10% -181% 468% 19% -33% Exploration 60 0.17<br />
DPS Acps 0 0 0 0 0 0 Shares on issue 299<br />
Payout ratio % 0% 0% 0% 0% 0% 0% Ungeared NPV 295 0.99<br />
Weighted average diluted shares m 238 396 429 429 429 429<br />
Cashflow 2010 2011 2012 2013 2014 2015<br />
Net cash inflow from operating activities A$m -8 -11 30 102 112 83 Key investment ratios 2010 2011 2012 2013 2014 2015<br />
Net interest A$m 0 -3 -7 -5 -3 0 Adjusted PER -35.5 -32.2 39.6 7.0 5.8 8.7<br />
Tax paid A$m 0 0 0 0 0 -25 EV/EBITA -21.6 -35.2 13.8 3.4 2.9 4.0<br />
Other A$m 0 0 0 0 0 0 P/FCF -10.45 -1.43 24.69 4.03 3.39 9.85<br />
Net operating cashflow A$m -8 -14 23 97 110 58<br />
Capital expenditure A$m 0 -195 -5 -5 -5 -20 Balance sheet 2010 2011 2012 2013 2014<br />
Exploration A$m -10 -5 -5 -10 -8 -5 Cash A$m 29 17 31 98 173<br />
Proceeds from sale of PP&E A$m 0 0 0 0 0 0 Other current assets A$m 1 1 1 1 1<br />
Net cashflow from investing A$m -10 -200 -10 -15 -13 -25 P,P & E A$m 1 196 189 165 141<br />
Debt drawdown/(repayment) A$m 0 98 0 0 0 0 Other non-current assets A$m 34 43 50 60 67<br />
Dividends paid A$m 0 0 0 0 0 0 Total assets A$m 64 257 271 324 382<br />
Share capital A$m 34 104 0 0 0 0 Current liabilities A$m 2 2 2 2 2<br />
Net financing cashflow A$m 34 202 0 0 0 0 Total liabilities A$m 2 102 119 125 127<br />
Net cashflow A$m 17 -11 13 82 97 33 Shareholder equity A$m 62 155 151 199 255<br />
Free cashflow A$m -18 -214 13 82 97 33 Total debt A$m 0 100 113 113 113<br />
FCFPS Acps -7.4 -54.0 3.1 19.1 22.7 7.8 Net debt A$m 29 -83 -82 -15 60<br />
Source: <strong>Macquarie</strong> <strong>Research</strong>, June 2010<br />
3 June 2010 11
<strong>Macquarie</strong> <strong>Research</strong><br />
<strong>Discovery</strong> <strong>Metals</strong> Ltd.<br />
Taking a project<br />
from exploration to<br />
production carries<br />
inherent risks<br />
Risks<br />
Permitting. DML is in the process of applying for a mining licence for Boseto. DML has<br />
submitted the Environmental Impact Assessment and the public consultation period has been<br />
completed. Other than the approval of the EIA, the completion of the BFS is the major<br />
outstanding item required prior to the granting of a mining licence. We note that in 2008 DML<br />
renewed its initial tenement package and was granted a further seven tenements.<br />
Capital & timing. As with all greenfield mining projects DML is exposed to the challenges<br />
associated with progressing a project from the exploration to development phase. Risks to<br />
project timing include availability of capital items and skilled labour. Feasibility studies<br />
typically are based on an accuracy of +/-10%.<br />
Funding. DML is yet to complete a BFS into the Boseto project and subsequently yet to<br />
secure project funding. The BFS is due to be completed in July. While recent BFS updates<br />
point to a bankable project, there is no guarantee or a commitment to provide debt funding;<br />
such an agreement will be dependent on a number of factors, including the results of the BFS<br />
and the prevailing state of capital markets.<br />
Commodity forecasts. The forecasting of commodity prices carries inherent risk, material<br />
changes to our view on industry structure and price drivers have the potential to materially<br />
alter our commodity forecasts.<br />
Single asset risk. Boseto will be DML‟s sole operating asset under its control once in<br />
production. Any disruptions to the mine plan have the potential to materially affect DML‟s<br />
financial position and its ability to meet any potential project funding obligations.<br />
Operational risk. The ramp-up and operation of any mining project carries an inherent level<br />
of risk, including building sufficient ROM stocks in both grade and ore types to maintain a<br />
consistent feed to mill. Major operational risks to Boseto are recoveries, particularly in the<br />
upper sections of the deposit where oxidised ore is prevalent and the narrow nature of the ore<br />
body results in a high strip ratio. Looking to the potential underground development at Zeta,<br />
the grade is relatively low for underground mining outside of bulk underground mining<br />
operations.<br />
Exploration risk. By nature, exploration is inherently uncertain and while the current project<br />
resource appears to confirm economic mineralisation to support a ~35kt pa copper operation<br />
for 10-15 year LOM there is no guarantee DML will discover further economic resources in its<br />
tenement package.<br />
Regulatory risk. Mining in all jurisdictions in both developing and developed economies is<br />
subject to regulatory risks. Typical regulatory risks include: changes to tax and royalty<br />
regimes, tenure of assets and environment issues such as the implementation of a carbon<br />
tax/emission trading scheme.<br />
Power. Botswana is a net importer of power and has traditionally relied on Eskom as a main<br />
source of power supply. To mitigate the risk of a potentially unreliable power supply from the<br />
grid, DML will use heavy fuel oil generators during the construction phase and will construct<br />
an onsite coal fired power station. DML had initially considered putting in place an 80km<br />
transmission line to link the site to Maun and link into the grid.<br />
3 June 2010 12
<strong>Macquarie</strong> <strong>Research</strong><br />
<strong>Discovery</strong> <strong>Metals</strong> Ltd.<br />
An extensive<br />
tenement package<br />
in Northern<br />
Botswana<br />
Boseto overview<br />
The Boseto Copper project is located in the northwest corner of Botswana, ~80km from the<br />
town of Maun. DML acquired a seven tenement package from the Government of Botswana<br />
in 2005, the tenement package was renewed in 2008. DML secured a further seven<br />
tenements to the southwest of the original package in 2008. DML‟s tenement package<br />
covers 10,100km 2 , starting ~60km southeast of Maun and stretching ~300km to the Namibian<br />
border.<br />
Fig 18 Boseto project location<br />
Source: DML, June 2010<br />
Geology and resources<br />
The Boseto project is hosted in the Kalahari Copper Belt. The Kalahari Copper Belt forms part<br />
of the late Proterozic Pan African Mobile Belt which contains well-known and prolific copper<br />
belts in Zambia and the DRC. The Kalahari copper belt extends south-westwards into<br />
Namibia and north-eastwards into Zambia, with known deposits sediment hosted.<br />
The Kalahari Copper<br />
Belt is interpreted<br />
as an extension of<br />
the Pan African<br />
Mobile Belt<br />
Mineralisation at Boseto typically outcrops or is covered by a thin layer of sand, which<br />
extends to 10m below surface at the deepest point. The majority of the Boseto copper occurs<br />
in sulphide mineralisation (90%); the dominant sulphide is chalcoite with minor amounts of<br />
bornite. Oxide ore is dominant in the top 20m of the ore body with copper hosted in malachite<br />
and chrysocolla; smaller amounts of oxide material are found along fractures of the ore body.<br />
3 June 2010 13
<strong>Macquarie</strong> <strong>Research</strong><br />
<strong>Discovery</strong> <strong>Metals</strong> Ltd.<br />
Fig 19<br />
The Pan African Mobile Belt<br />
Source: GeoLogix, Hana Mining, September 2007<br />
Boseto project has<br />
1.42mt of contained<br />
copper in resources<br />
DML published an updated resource estimate for Boseto in April 2010. The drilling program<br />
between the previous resource estimate published in October 2009 and April 2010 resulted in<br />
a 68% increase in contained copper to 1.42mt.<br />
Fig 20 Boseto resource as at April 2010<br />
M&I Inferred M&I + I<br />
tonnes<br />
(mt)<br />
Copper<br />
(%)<br />
Silver<br />
(g/t)<br />
tonnes<br />
(mt)<br />
Copper<br />
(%)<br />
Silver<br />
(g/t)<br />
tonnes<br />
(mt)<br />
Copper<br />
(%)<br />
Silver<br />
(g/t)<br />
Petra 3.6 1.3 14.2 9.1 1.3 15.4 12.7 1.3 15.1<br />
Southwest<br />
Petra 17.2 1.4 15.4 17.2 1.4 15.4<br />
Northeast<br />
Plutus 14.9 1.2 12.5 14.9 1.2 12.5<br />
Plutus 8 1.4 14 14.6 1.5 16.1 22.6 1.5 15.4<br />
Zeta 10.9 1.6 23.5 24.5 1.4 21.8 35.4 1.5 22.3<br />
Total 22.5 1.5 18.6 80.3 1.4 16.9 102.8 1.4 17.3<br />
Source: DML, <strong>Macquarie</strong> <strong>Research</strong>, June 2010<br />
The initial open pit operation will focus on mining on the Zeta and Plutus areas. The<br />
measured and indicated portion of the resource represents open pitable material under a<br />
2mtpa mining rate at a 10:1 strip ratio. DML has engaged Snowden to remodel the mine<br />
schedule to allow for accelerated open pit mining to support the 3mtpa. The combined Plutus<br />
and Petra resource (inc Northeast Plutus and Southwest Petra extensions) now stretches<br />
over a continuous 25km strike length and remains open to the North East.<br />
The inferred resources at Southwest Petra and Northeast Plutus are only drilled to a depth of<br />
160m at wide spacing of 1,000m. DML has conducted infill drilling at 500m spacing. As DML<br />
completes further infill drilling it should provide confidence in the ability of Southwest Petra<br />
and Northeast Plutus to extend the open pit LOM.<br />
The inferred portion of the Zeta resource (24.5mt @ 1.4% copper) is below 160m, extending<br />
to 360mbs, and formed the basis of the underground scoping study released in April 2010.<br />
The resource remains open below 360m and DML continues to progress exploration to<br />
confirm the continuation of mineralisation to a depth of 650m.<br />
3 June 2010 14
<strong>Macquarie</strong> <strong>Research</strong><br />
<strong>Discovery</strong> <strong>Metals</strong> Ltd.<br />
Near mine exploration<br />
Near mine<br />
exploration target<br />
has potential for a<br />
material LOM<br />
extension<br />
The focus of the near mine exploration program will be on upgrading the Zeta underground<br />
resource and delineating an initial underground resource at Plutus. DML will also begin to drill<br />
targets (Nexus, Nyx, Quirinus and Plutus extensions) that have the potential to provide open<br />
pitable resources within trucking distance of the concentrator<br />
Plutus and Petra<br />
The combined Plutus and Petra resource covers a continuous strike length of 25km and is<br />
open to the northeast and at depth over the entire strike length. At Northeast Plutus a series<br />
of diamond drill holes were completed in April to infill the existing data which underpins the<br />
current 14.9mt @ 1.2% copper inferred resource. The results of these holes are yet to be<br />
released.<br />
The Southwest Petra resource appears to join up with the Nexus prospect at a fold nose.<br />
There is 3m of strike between the boundary of the Southwest Petra resource and the<br />
indentified fold nose, where a fault zone has vertically displaced mineralisation.<br />
Zeta underground<br />
At Zeta DML has completed a series of five drill holes to test the down dip extension of the<br />
Zeta deposit. The current Zeta inferred resource includes mineralisation to a depth of<br />
360mbs, the five hole program was designed to test for mineralisation to a depth of 650mbs.<br />
While these holes were completed in late 2009 the data has not been released and is being<br />
reviewed and quality assured.<br />
Nexus<br />
The Nexus prospect is an 11km copper anomaly running parallel to (~2km west of) the Zeta<br />
deposit. Drilling at Nexus has not been a priority of the drilling to sure up the initial resource<br />
base to underpin the BFS. Looking forward DML will carry out drilling on the Nexus target to<br />
examine the potential for economic mineralisation at Nexus. We note initial drill results point<br />
to relatively thin copper mineralisation at Nexus. We understand this is not a high priority<br />
target and is likely to be followed up once the initial project is up and running as the current<br />
M&I resource supports at least a ten year LOM.<br />
Nyx<br />
Nyx is a geochemical anomaly located ~10km south-southeast of the Zeta deposit. The<br />
prospect is positioned on the northwest dipping limb of a synclinal structure trending in the<br />
same direction as Zeta and Plutus. Initial recognisance work using a Niton XRF machine<br />
confirmed the presence of the anomaly and nine holes (550m) were completed in March<br />
2010, with six holes spaced on a 1km line spacing. Assay results are expected in the June<br />
quarter with DML indicating that the holes intersected similar stratigraphy.<br />
Quirinus<br />
The Quirinus prospect is located 15km from the proposed Boseto concentrator site. Three<br />
anomalous copper zones were initially defined by soil geochemistry, with the anomalies<br />
stretching over a 13.4km strike length. Seven drill holes have been completed which have<br />
confirmed the presence of copper mineralisation. No drilling was conducted as part of Boseto<br />
BFS, with further drilling to be carried out in 2Q10 as part of a broader regional exploration<br />
program.<br />
3 June 2010 15
<strong>Macquarie</strong> <strong>Research</strong><br />
<strong>Discovery</strong> <strong>Metals</strong> Ltd.<br />
Fig 21 Boseto resource areas<br />
Source: DML, June 2010<br />
Regional exploration<br />
With sufficient<br />
resources in place<br />
to underpin 13 years<br />
of production, the<br />
focus will shift to<br />
regional targets to<br />
find a Boseto 2 style<br />
project<br />
DML will begin to refocus its exploration efforts on regional exploration targets in an attempt<br />
to define a “Boseto 2” project, now that sufficient resources have been indentified to underpin<br />
at least a 13 year LOM at Boseto. At present only 328km of the prospective 1,300km of<br />
indentified strike length has been explored by a soil sampling program, with only 67km of the<br />
1,300km drilled to date. DML collected soil samples covering a108km of prospective strike in<br />
the March quarter with the results undergoing quality control checks prior to release.<br />
The initial regional soil sampling work will utilise a Niton XRF machine to indentify soil<br />
geochemical anomalies. Work during 1Q10 focused on the Gaia and Notus targets which are<br />
located southwest of the Boseto plant site along the same structures which host the Zeta and<br />
Plutus deposits. Notus is the closest of the two targets located 48km from Boseto with Gaia<br />
located 100km away. DML has also begun sampling at Maia, an area located 44km north of<br />
the plant site.<br />
3 June 2010 16
<strong>Macquarie</strong> <strong>Research</strong><br />
<strong>Discovery</strong> <strong>Metals</strong> Ltd.<br />
Fig 22 Regional targets<br />
Source: DML, June 2010<br />
Permitting<br />
Mining licence<br />
expected post BFS<br />
DML has submitted the Environmental Impact Assessment and the public consultation period<br />
has been completed. Other than the approval of the EIA, the completion of the BFS is the<br />
major outstanding item required prior to the granting of a mining licence.<br />
Mining<br />
The initial focus of the feasibility study was for a 2mtpa open pit mining operation; however,<br />
the large increase in the resource base and the definition of significant resources below the<br />
160m open pit floor (depth of pit floor at a 10:1 strip) has led to DML pursuing an increased<br />
mining rate of 3mtpa. The mining schedules are being revised as part of the BFS due in July.<br />
Conceptually the first three years of mining will see the open pit mining rates accelerated with<br />
ore exclusively from open, underground mining expected to commence in 2014 and we have<br />
modelled 1mtpa from the Zeta underground commencing 2014 to 2025.<br />
Our mine model assumes 27mt of open pit ore mined over a 13 year period, which is<br />
moderately above the 22.5mt measured and indicated resource for Zeta, Plutus and Petra. In<br />
our view this is relatively conservative as it does not include any ore from Southwest Petra<br />
and Northeast Plutus (32mt at 1.31% copper), which has the potential to materially increase<br />
the LOM.<br />
In terms of underground ore production we have assumed ore production of 1mpta over a<br />
nine year LOM for total ore production of 9mt. Our underground ore mined assumptions are<br />
marginally below the 9.5mtpa mining inventory used in the underground scoping study<br />
released in April 2010. As the deposit is open at depth once the underground infrastructure is<br />
in place our LOM may prove to be conservative (albeit subject to the prevailing copper price<br />
environment)<br />
3 June 2010 17
<strong>Macquarie</strong> <strong>Research</strong><br />
<strong>Discovery</strong> <strong>Metals</strong> Ltd.<br />
Fig 23 <strong>Macquarie</strong>’s ore source assumptions (FY’s)<br />
kt<br />
3500<br />
3000<br />
2500<br />
2000<br />
1500<br />
1000<br />
500<br />
0<br />
2011 2012 2013 2014 2015 2016 2017 2018 2019 2020 2021 2022 2023 2024 2025 2026 2027 2028<br />
Open pit<br />
Underground<br />
Source: <strong>Macquarie</strong> <strong>Research</strong>, June 2010<br />
Open pit<br />
Mining at Boseto will be by traditional open pit drill and blast methods. The sand cover to a<br />
depth of up to 10m will be free dig. The relatively narrow widths (average 6m) and steeply<br />
dipping geometry of the ore body results in a strip ratio of around 10:1. DML has indicated<br />
that the current economics of the pit under an US$2.00/lb copper price want to push the pit to<br />
higher strip ratios.<br />
Owner operator<br />
mining at Boseto<br />
Total material movements are not of the scale we would consider to be a large earth moving<br />
operation, with average LOM material movements of 30 to 33mtpa. Under the initial 2mtpa<br />
mine schedule the 10:1 strip ratio included 1.8mt of low grade ore, which is classed as waste<br />
and will be expensed through the P&L, however, will be separately stockpiled and maybe<br />
treated subject to the prevailing copper price environment. DML has engaged Snowden to<br />
review the mine schedule to allow for accelerated open pit mining to support the 3mtpa.<br />
The 3mtpa feasibility study will be based on owner operator mining fleet. The initial 2mtpa<br />
feasibility study assumed a fleet of 2 * 250t excavator s and 12*100t trucks for waste<br />
movement movements and 1*120 excavator and 9*100t trucks for ore mining. We have<br />
assumed mining costs of US$2.20/t material in our modelling (including an equipment finance<br />
charge).<br />
3 June 2010 18
<strong>Macquarie</strong> <strong>Research</strong><br />
<strong>Discovery</strong> <strong>Metals</strong> Ltd.<br />
Fig 24 Zeta and Plutus cross sections<br />
Source: DML, June 2010<br />
Underground<br />
In April, DML released the results of a scoping study carried out by Snowden into an<br />
underground operation below the Zeta open pit. The study was based on the inferred<br />
resource below the Zeta open pit from a depth of 160mbs to 360mbs and allowed for a 10m<br />
crown pillar. The Zeta resource below 160m is 25mt @ 1.4% copper and the scoping study<br />
assumed a recoverable mining inventory of 9.5mt @ 1.4% copper. The mining inventory is<br />
based on an uphole retreat stoping mining method. The study considered a backfill stoping<br />
mining method however; the costs outweighed the increase in recoverable ore.<br />
Shallow<br />
underground mining<br />
potential at Zeta<br />
The mining inventory is defined over 2km and was divided into two separate areas accessed<br />
by separate declines, with a maximum rate of 0.8mtpa. Development capex for the<br />
underground was estimated at US$10m or US$5m per area, based on decline development<br />
capex of US$3,200/m (a quick back of envelope calculation assuming a 7:1 decline leads to<br />
decline development of capex of US$3.5m per area to reach the top of the underground<br />
mining area, leaving ~US$1.5m per area for ventilation). Mining costs used in the study were<br />
US$37/t ore (we have assumed US$46/t for underground mining costs).<br />
3 June 2010 19
<strong>Macquarie</strong> <strong>Research</strong><br />
<strong>Discovery</strong> <strong>Metals</strong> Ltd.<br />
Fig 25 Zeta open pit and underground<br />
Source: DML, June 2010<br />
Processing<br />
The 3mtpa Boseto process plant will be based on a conventional copper flotation circuit. The<br />
initial project study was focused on a 2mtpa process plant, and the study was formally<br />
upgraded to 3mtpa in May 2010 following material exploration success in 1H10.<br />
Recoveries to be<br />
lower in early stage<br />
of the pit due to<br />
higher levels of<br />
oxide ore<br />
While the majority of the Boseto resource (90%) is sulphide ore, recoveries in the early parts<br />
of the ore body will be impacted by the presence of oxide ore from surface to around 35mbs.<br />
Once below 35 metres the ore body is predominantly chalcoite with minor amount of bornite.<br />
While the presence of oxide ore will impact recoveries (oxide ore is typically recovered via a<br />
leaching process), a number of operations with small amounts of oxide in proportion to<br />
sulphides use flotation to recover copper from oxide ore. DML has indicated targeted average<br />
recoveries of 82.5% over the open pit LOM.<br />
Initial work on a standalone underground ore has indicated recoveries of 92% based on the<br />
assumption that all material is sulphide with no oxide material. Under a blended open<br />
pit/underground ore feed post year four, we would expect recoveries to be above the 82.5%<br />
open pit average and closer to the 92% underground target as DML will be through the<br />
heavily oxidised zones.<br />
The front-end of the Boseto plant ore will incorporate a three stage crushing and ball mill<br />
circuit. The plant will have two flotation circuits. Sulphide mineralisation will be separated first<br />
with tailings from the sulphide roughers sent to an oxide circuit. Concentrates are filtered to<br />
recover excess process water, as are tailings.<br />
Tailings will be dry stacked. Water recovered in the dewatering stages will be recycled to the<br />
various parts of the plant as process water.<br />
3 June 2010 20
<strong>Macquarie</strong> <strong>Research</strong><br />
<strong>Discovery</strong> <strong>Metals</strong> Ltd.<br />
Fig 26 Boseto flowsheet<br />
Source: DML, June 2010<br />
Production and cost targets<br />
Formal targets due<br />
with the release of<br />
the BFS in July<br />
The increase in the mineral resources at Boseto has led to DML announcing an increase in<br />
the scope of the BFS to support a 3mtpa plant throughput rate in May. No formal production<br />
and cost targets for the 3mtpa project have been released. We have based our underlying<br />
mine and plant assumptions from the 2mtpa study and have set out our physical parameters<br />
in Fig 27.<br />
3 June 2010 21
<strong>Macquarie</strong> <strong>Research</strong><br />
<strong>Discovery</strong> <strong>Metals</strong> Ltd.<br />
Fig 27 Boseto mine and plant physical assumptions<br />
Operational parameters 2011 2012 2013 2014 2015 2016 2017 2018 2019 2020<br />
Open pit ore mined - 950 2,700 3,000 2,500 2,000 2,000 2,000 2,000 2,000<br />
Strip ratio N/A 10 10 10 10 10 10 10 10 10<br />
Waste mined 0 10,450 29,700 33,000 27,500 22,000 22,000 22,000 22,000 22,000<br />
Total open pit material movements 0 11,400 32,400 36,000 30,000 24,000 24,000 24,000 24,000 24,000<br />
Underground ore mined 0 - - - 500 1,000 1,000 1,000 1,000 1,000<br />
Ore milled - 950 2,700 3,000 3,000 3,000 3,000 3,000 3,000 3,000<br />
Copper grade 0.0% 1.4% 1.4% 1.4% 1.4% 1.4% 1.4% 1.4% 1.4% 1.4%<br />
Copper recovery 0.0% 74.0% 81.0% 85.0% 85.0% 85.0% 86.0% 87.0% 87.0% 87.0%<br />
Silver grade 0.0 18.7 18.7 18.7 18.7 18.7 18.7 18.7 18.7 18.7<br />
Silver recovery 0% 65% 65% 65% 65% 65% 65% 65% 65% 65%<br />
Copper production 0 10 31 36 36 36 36 37 37 37<br />
Silver production 0 372 1058 1176 1176 1176 1176 1176 1176 1176<br />
Copper concentrate grade 0% 40% 40% 40% 40% 40% 40% 40% 40% 40%<br />
Concentrate produced 0 25 74 86 86 86 87 88 88 88<br />
Copper payability 0% 97% 97% 97% 97% 97% 97% 97% 97% 97%<br />
Pricing<br />
Copper price (US$/lb) 3.55 3.15 2.85 2.70 2.65 2.61 2.69 2.81 2.85 2.94<br />
Silver price (US$/oz) 17.12 16.15 15.00 14.23 14.02 14.27 14.66 15.33 15.55 16.02<br />
AUD/USD 0.92 0.82 0.80 0.80 0.80 0.80 0.80 0.80 0.80 0.80<br />
Cost base<br />
Open pit mining (US$/t) 2.3 2.7 2.3 2.4 2.5 2.6 2.6 2.8 2.8 2.9<br />
Underground mining (US$/t) 46.0 47.4 48.8 50.2 51.7 53.3 54.9 57.4 58.2 60.0<br />
Processing (US$/t) 6.5 8.4 6.9 7.2 7.4 7.6 7.8 8.2 8.3 8.5<br />
Administration costs 1.1 2.1 1.2 1.3 3.4 5.6 5.8 6.1 6.1 6.3<br />
Cash cost (US$/lb) 0 1.69 1.51 1.49 1.77 2.07 2.11 2.17 2.20 2.27<br />
Silver credits (US$/lb) 0 0.25 0.23 0.20 0.20 0.21 0.21 0.21 0.22 0.23<br />
Royalities (US$/lb) 0 0.10 0.10 0.09 0.09 0.09 0.09 0.09 0.10 0.10<br />
Cash costs inc royalties (US$/lb, real 2010$) 0 1.45 1.27 1.22 1.44 1.64 1.62 1.63 1.60 1.60<br />
Capex (US$m)<br />
Plant capex 85 0 0 0 0 0 0 0 0 0<br />
Site capex 100 0 0 0 0 0 0 0 0 0<br />
Underground development capex 0 0 0 0 12 4 4 4 4 4<br />
Sustaining plant capex 0 4 4 4 4 4 4 4 4 4<br />
Mining fleet 45 0 0 0 20 0 0 0 0 0<br />
*material movements exclude pre production stripping<br />
Source: <strong>Macquarie</strong> <strong>Research</strong>, June 2010<br />
We have assumed<br />
capex of US$185m<br />
<strong>Metals</strong> trader<br />
Transamine will take<br />
100% of production<br />
for the first five<br />
years<br />
A formal capex forecast for the 3mtpa project is yet to be released. The capex forecast for the<br />
2mtpa was US$150m, which was last updated in October 2009. With the release of the<br />
decision to upgrade the project scope to 3mtpa, DML awarded the EPC contract for plant<br />
construction to Sedgman <strong>Limited</strong> for a „maximum price‟ of US$85m. The plant capex for a<br />
2mtpa plant was estimated at US$70m, meaning the US$19m contingency estimate in the<br />
US$150m for the 2mtpa project has essentially been exhausted. Other areas of movement in<br />
capex estimate are likely to be the mine fleet (not included in the US$185m capex and is<br />
likely to be part of equipment lease), which was previously estimated in the range of US$35-<br />
US$40m and the construction of an onsite coal fired power station (the initial study included<br />
US$10m for a transmission line to Maun compared to the preliminary cost estimate of<br />
~US$25m for an onsite plant).<br />
Offtake<br />
In March 2010, DML entered into an offtake agreement with metals trader Transamine for<br />
100% of Boseto concentrate for a minimum of five years. As part of the offtake agreement<br />
DML placed 25m shares (9.8% of DML shares) to Transamine at A$0.76ps (to raise A$19m)<br />
which was an 11% premium to the four week VWAP at the time of placement.<br />
3 June 2010 22
<strong>Macquarie</strong> <strong>Research</strong><br />
<strong>Discovery</strong> <strong>Metals</strong> Ltd.<br />
The terms of the off take agreement have not been released. DML has guided to a shorter<br />
quotational period than the industry standard (which appears reasonable given the customer<br />
is a trader not an end user), with product to be sold on a landed basis. The export route for<br />
Boseto concentrate will be a truck haul to Gobabis (520km) then railed to Walvis Bay<br />
(650km).<br />
Transamine has been an active player in the ASX base metals universe and has equity<br />
investments and offtake agreements with Kagara and Citadel.<br />
Transamine has<br />
been an active<br />
investor in the<br />
Australian resource<br />
sector<br />
In August 2009, Transamine subscribed for A$25m in Citadel equity (5% of CCG<br />
equity) with an offtake agreement to purchase 50ktpa concentrate (~20% of forecast<br />
production) for the first five years of production from the Jabal Sayid project in Saudi<br />
Arabia.<br />
Transamine subscribed for A$10m of Kagara equity in February 2009; the placement<br />
represented 11.5% of Kagara shares at the time of placement. Transamine‟s current<br />
holding in KZL is 3.5%.<br />
Fig 28 Boseto to Walvis Bay route (presentation dated 6 October 2009)<br />
Source: DML, June 2010<br />
Botswana tax structure<br />
Botswana mining<br />
tax is based on ad<br />
valorem royalty with<br />
a sliding tax rate<br />
The principals of the Botswana mining tax system are based on ad valorem royalty with a<br />
sliding tax rate. For royalty purposes, gross revenue is defined as the „sale value receivable<br />
at the mine gate in an arm‟s length transaction without discounts, commissions or deductions<br />
for the mineral or mineral product on disposal‟.<br />
Under our production, costs and copper price assumptions, we expect DML‟s tax rate to vary<br />
between 30-35% and we expect the capital shield to give DML a tax holiday of two years<br />
Key features of the tax regime are listed below<br />
100% deductibility of capex & pre-production spend before tax is payable<br />
200% employee training cost deduction<br />
3% ad valorem copper royalty<br />
5% ad valorem silver royalty<br />
Mining companies are taxed in accordance with the provisions of the Twelfth Schedule<br />
to the Income Tax Act. The tax rate is determined by the formula<br />
Annual tax rate = 70 – (1,500/X)<br />
Where “X” is the profitability ratio defined as taxable income as a percentage of gross<br />
income, provided that the tax rate is not less than the company tax rate of 25%.<br />
3 June 2010 23
<strong>Macquarie</strong> <strong>Research</strong><br />
<strong>Discovery</strong> <strong>Metals</strong> Ltd.<br />
Botswana is a net<br />
importer of power<br />
Infrastructure<br />
Power<br />
Botswana is a net importer of power. Internal power generation comes from the Morupule<br />
coal fired power station, which generates 120MW. Electricity is imported from Eskom; 350MW<br />
was imported in 2009, with this figure expected to decline to ~150MW by 2012.<br />
Fig 29 Botswana Power Corporation forecast supply/demand balance<br />
Source: Botswana Power Corporation, June 2009<br />
DML is planning to<br />
construct an onsite<br />
coal fired power<br />
plant<br />
DML is planning to use diesel power for the construction phase and first year of operation,<br />
through a mixture of purchased and rented gen sets. The longer term power solution at<br />
Boseto is the construction of an onsite coal fired power station. A full feasibility study into the<br />
cost of the onsite power station is yet to be completed, with preliminary work indicating capex<br />
of US$25m. The alternative to an onsite power station is the installation of a transmission line<br />
to Maun, which would cost ~ US$12m and provide access to the national gird.<br />
Fig 30 Botswana Power consumption<br />
Source: Botswana Power Corporation, June 2009<br />
3 June 2010 24
<strong>Macquarie</strong> <strong>Research</strong><br />
<strong>Discovery</strong> <strong>Metals</strong> Ltd.<br />
Water<br />
DML has defined<br />
sufficient water<br />
resources to<br />
support the Boseto<br />
project<br />
DML intends to tap into ground water resources, through the Ecca Aquifer located ~15km<br />
from Boseto. Five ground water resource areas within the Ecca Aquifer have been identified,<br />
with two areas “GRA 5” and “GRA 1” to be tapped for the initial project. The water from the<br />
aquifer has a relatively high saline content and is currently not being utilised. DML has<br />
indicated that it expects the “GRA 5” and “GRA 1” areas can provide 12ml pa of water over a<br />
15 year period. This is well in excess of the expected 2.5ml pa requirement for a 2mtpa<br />
flotation plant. DML has used water from the Ecca Aquifer in its metallurgical test work.<br />
Fig 31 Boseto site layout<br />
Source: DML, June 2010<br />
Project timeline<br />
DML is targeting<br />
first production in<br />
4Q11<br />
The next project milestone for DML at Boseto is the delivery of the BFS in July 2010. The<br />
delivery of the BFS is a key milestone as it is a requirement for the granting of a mining<br />
licence and will also be required for the securing of project finance. The construction timeline<br />
is expected to be 12-15 months with first production targeted in 4Q CY11.<br />
Fig 32 Boseto project timeline<br />
Source: DML, June 2010<br />
3 June 2010 25
<strong>Macquarie</strong> <strong>Research</strong><br />
<strong>Discovery</strong> <strong>Metals</strong> Ltd.<br />
Diamond mining is<br />
the mainstay of the<br />
Botswana economy<br />
Mining in Botswana<br />
Mining activities in Botswana are governed by the Ministry of Minerals, Energy and Water<br />
Resources (MMEWR), with the Department of Mines the responsible department. A<br />
presentation given by MMEWR in June 2009 commented that “mining contributes more than<br />
a third of GDP and about half of government revenues”.<br />
Fig 33 Breakup of Botswana mineral revenue 2008/2009<br />
Source: Botswana Department of Mines, 2008<br />
Debswana is a 50:50<br />
JV between<br />
DeBeers and the<br />
Government of<br />
Botswana<br />
The mining sector employed 18,830 people in 2008 which represents ~2.7% of the estimated<br />
labour force (based on CIA World Factbook estimates). Expatriate employment in the mining<br />
sector represented ~4.77% of mining employees at the end of 2008.<br />
Fig 34 Employment trends in the Botswana mining industry<br />
Source: Botswana Department of Mines, 2008<br />
Mining in Botswana is dominated by diamond mining with Debswana the dominant player.<br />
Debswana was founded in 1969 as a 50:50 JV between DeBeers and the Government of<br />
Botswana. Debswana operates four mines in Botswana (Jwaneng, Orapa, Letlhakane and<br />
Damtshaa).<br />
3 June 2010 26
<strong>Macquarie</strong> <strong>Research</strong><br />
<strong>Discovery</strong> <strong>Metals</strong> Ltd.<br />
Fig 35<br />
Global rough diamond supply<br />
Source: Allan Hochreiter, Capital Resources Botswana, June 2009<br />
Tati Nickel is the<br />
main nickel<br />
producer<br />
Base metal mining in Botswana has been relatively consistent with Tati Nickel the mainstay.<br />
Norilsk Nickel acquired an 85% interest in Tati Nickel as a result of the takeover of LionOre in<br />
2007, and the Botswana Government owns the remaining 15% interest in Tati Nickel. Tati<br />
Nickel owns the Phoenix open pit sulphide mine in northeast Botswana, which has a 5mtpa<br />
onsite concentrator.<br />
Fig 36 Historical Botswana nickel/copper production<br />
kt metal<br />
35<br />
30<br />
25<br />
20<br />
15<br />
10<br />
5<br />
0<br />
1990 1992 1994 1996 1998 2000 2002 2004 2006 2008<br />
Nickel Copper<br />
Source: Botswana Department of Mines, 2008<br />
Traditionally mining and exploration hve focused on the eastern parts of Bostwana and not<br />
the northwest part of the country. This has provided DML and Hana Mining with a first mover<br />
advantage in the Kalahari copper belt.<br />
3 June 2010 27
<strong>Macquarie</strong> <strong>Research</strong><br />
<strong>Discovery</strong> <strong>Metals</strong> Ltd.<br />
Fig 37 Botswana mines and infrastructure<br />
Source: Hana Mining, May 2010<br />
Hana Mining<br />
Hana Mining has<br />
ground adjacent to<br />
the south of DML<br />
Hana Mining is<br />
targeting a resource<br />
increase before<br />
progressing project<br />
studies<br />
Hana Mining (HMG) is a TSX-V listed explorer focused on the Ghanzi Copper-Silver project in<br />
Botswana. The Ghanzi project is located to the south of DML‟s tenement package. HMG<br />
currently owns 70% of the Ghanzi project and can acquire a further 20% for US$9m following<br />
the completion of a BFS, the final 10% (for a 100% interest) may be acquired through the<br />
issue of 4m warrants exercisable at C$2.00ps (share price at 1 June: C$1.40ps).<br />
HMG has indicated the project has 600km of potential strike length, and the current focus is<br />
the Banana Zone which covers 64km of strike. The Ghanzi copper project (100%) has a<br />
resource of 93mt grading 1.51% copper and 17.5g/t silver for 1.4mt and 52.5moz contained<br />
copper and silver respectively (under a 0.75% copper cut-off and excluding the low grade<br />
zone).<br />
HMG is around 18-24 months behind DML in terms of bringing their respective projects into<br />
production. HMG‟s strategy appears to differ from DML, in that DML is targeting an initial<br />
3mpta project in order to generate cashflow, while it continues to drill out Boseto and its<br />
broader tenement holding. HMG on the other hand is pursing an aggressive drilling program<br />
over 2010 to increase the resource base, with a follow-up program in 2011 to increase the<br />
confidence in the resource base and a BFS to be completed by 2012 for targeted first<br />
production in 2H 2014.<br />
3 June 2010 28
<strong>Macquarie</strong> <strong>Research</strong><br />
<strong>Discovery</strong> <strong>Metals</strong> Ltd.<br />
Fig 38 Ghanzi project location relative to Boseto<br />
Source: Hana Mining, June 2010<br />
African Copper<br />
African Copper (ACU) is an AIM listed copper play focused on restarting Mowana. The<br />
Mowana mine was commissioned in 2008; however, was placed on care and maintenance in<br />
February 2009 and restarted in January 2010.<br />
Mining and<br />
exploration activity<br />
in Botswana<br />
increasing<br />
ACU‟s major shareholder is JSE listed Zambia Copper Investments (ZCI), which owns ~82%<br />
of ACU, following the recapitalisation of ACU in 2009. The ACU shareholding is ZCI‟s sole<br />
material asset. KCI was suspended from trading on the JSE following the sale of its remaining<br />
interest (28.4%) in Konkola Copper mines to Vedanta for US$213m in May 2009. ZCI relisted<br />
on the JSE in January 2010 following shareholder approval for the acquisition of the interest<br />
in ACU which ended ZCI‟s classification as a listed cash shell.<br />
The Mowana operation was negatively impacted by low availability of the tertiary crushing<br />
plant in 1Q10.<br />
A Cap Resources<br />
A Cap Resources (ACB) is an ASX listed uranium explorer focusing on the Letlhakane<br />
Uranium project in west Botswana. The project has a resource of 463mt grading 154ppm<br />
uranium for 158m contained pounds of uranium. A scoping study in 2009 (conducted by SRK)<br />
indicated potential for production of 2.2mlbs pa of uranium over a 7-11 year LOM with cash<br />
costs of US$33/lb and capex of US$170m. ACB is currently completing a feasibility study into<br />
the Letlhakane project.<br />
Aviva Corporation<br />
ASX listed Aviva Corporation (AVA) announced an 895 thermal coal reserve at its<br />
Mmamantswe Coal project, located on the Botswana and South African border. A scoping<br />
study completed by SRK indicated the reserve has the potential to support 2000MW of power<br />
generation for 40 years. AVA plans to submit an application to register the Mmamantswe<br />
project as a sub project of the Botswana Power Corporation - this is required for access to the<br />
Southern African Power Pool.<br />
3 June 2010 29
<strong>Macquarie</strong> <strong>Research</strong><br />
<strong>Discovery</strong> <strong>Metals</strong> Ltd.<br />
Botswana is<br />
regarded by many<br />
as the most stable<br />
country in Africa<br />
Botswana country profile<br />
Botswana is a landlocked country in southern Africa. Botswana was granted independence in<br />
1966 (prior to independence Botswana was a British protectorate called Bechuanaland) and<br />
the government today operates in three parts: the executive, legislature and judiciary. The<br />
head of state is the president, who is appointed by the National Assembly and can serve a<br />
maximum of two five-year terms. The last election was held in October 2009 and was classed<br />
as free and fair, with the Botswana Democratic Party (which has held government for 43<br />
years) winning 45 of the 57 seats.<br />
Fig 39 Botswana GDP per capita growth<br />
Source: DeBeers, June 2010<br />
Diamond mining has<br />
driven GDP growth<br />
Botswana has maintained one of the world's highest economic growth rates since<br />
independence in 1966, though growth fell below 5% in 2007-08, and turned sharply<br />
negative in 2009, with industry falling nearly 30%. Through fiscal discipline and sound<br />
management, Botswana transformed itself from one of the poorest countries in the world<br />
to a middle-income country with a per capita GDP of $14,100 in 2008.<br />
Two major investment services rank Botswana as the best credit risk in Africa. Diamond<br />
mining has fuelled much of the economic expansion and currently accounts for more<br />
than one-third of GDP, 70-80% of export earnings, and about half of the government's<br />
revenues. Botswana's heavy reliance on a single luxury export was a critical factor in the<br />
sharp economic contraction of 2009. Tourism, financial services, subsistence farming,<br />
and cattle raising are other key sectors. Although unemployment was 7.5% in 2007<br />
according to official reports, unofficial estimates place it closer to 40%.<br />
Fig 40 Botswana at a glance<br />
Population m 2.00 Unemployment % 7.5<br />
GDP (PPP) US$bn 26 Inflation % 7.3<br />
GDP growth<br />
% -5.2 (2009) Interest Rate % 15<br />
2.9% (2008) Urban population % 60<br />
GDP per capita US$m 13,100<br />
GDP sectors<br />
Language English (official), Setswana Industry % 52.6<br />
Capital city Gaborone Services % 45.8<br />
Currency Pula Agriculture % 1.6<br />
Source: CIA World Fact Book, June 2010<br />
3 June 2010 30
1975<br />
1978<br />
1981<br />
1984<br />
1987<br />
1990<br />
1993<br />
1996<br />
1999<br />
2002<br />
2005<br />
2008<br />
2011<br />
Copper price, c/lb<br />
Copper price, c/lb<br />
Copper stocks - weeks global consumption<br />
<strong>Macquarie</strong> <strong>Research</strong><br />
<strong>Discovery</strong> <strong>Metals</strong> Ltd.<br />
Copper Large view deficit – very<br />
bullish expected medium in 2011 term<br />
outlook<br />
Price Copper outlook trading for<br />
ahead 2012/13 of today’s in the<br />
fundamentals balance<br />
Copper<br />
Fundamentals to drive prices to new record highs by 2011<br />
We see the copper market tightening sharply over the next two to three years. We are<br />
forecasting that copper will average US$7,522/t (US$3.40/lb) in 2010 and US$7,716/t<br />
(US$3.50/lb) in 2011, peaking at an average of US$8,378/t (US$3.80/lb). We recommend<br />
clients own a core position of copper, and look to add into any dips over the coming year. We<br />
forecast that the copper market will move into a small deficit of ~100,000t in 2010 and then<br />
register a sizeable deficit of 560,000t in 2011. These deficits would take copper stocks down<br />
to less than 3.5 weeks of global consumption by end 2011. This could easily result in copper<br />
revisiting its previous peak of over US$4/lb (we anticipate this is more likely to occur in 1H11).<br />
While we are bullish on the outlook over the next two to three years, there is no debating that,<br />
by historical standards at least, copper is overvalued based on today‟s level of stock in terms<br />
of weeks of consumption (fig 41). Copper has recently been trading up around US$3.50/lb<br />
relative to costs of US$1.70-US$2/lb for the highest cost producers, indicating that the market<br />
is very tight. However, physical premiums are not as high as they were in the previous boom<br />
period and stocks are almost double in terms of weeks of global consumption. The chart<br />
below left illustrates the uncharted territory that copper is in at present.<br />
Fig 41<br />
Fundamentals set to catch up, but right now the copper price is ‘out there’<br />
450<br />
400<br />
Real Copper Price & Global Stocks<br />
450<br />
400<br />
Real Copper Price and Global Stocks<br />
Real Cu Price (LHS)<br />
Global Stocks (RHS)<br />
(f)<br />
14<br />
12<br />
350<br />
300<br />
250<br />
All<br />
2010<br />
2009<br />
2008<br />
2007<br />
350<br />
300<br />
250<br />
10<br />
8<br />
200<br />
200<br />
6<br />
150<br />
100<br />
150<br />
100<br />
4<br />
50<br />
50<br />
2<br />
0<br />
1 2 3 4 5 6 7 8 9 10 11 12 13 14<br />
Global stocks in weeks of demand<br />
0<br />
0<br />
Source: ICSG, CRU, <strong>Macquarie</strong> <strong>Research</strong>, May 2010<br />
We have lowered<br />
our mine disruption<br />
allowance for 2010,<br />
and across the<br />
forecast period<br />
Copper is trading here because the market is taking the view that the copper fundamentals<br />
will tighten up on the back of improving demand and limited supply growth, but the view that<br />
supply growth will not be able to respond is key – and is something that has been cemented<br />
following five years of underperformance relative to plan (owing to a myriad of supply<br />
„disruptions‟). Over the past three years, copper mine supply disruptions have represented<br />
around 6-8% of (pre-disruption) copper mine supply forecasts. Disruptions over this period<br />
have come from technical issues (~23% on average), slower than expected ramp-ups (21%),<br />
strikes (16%), pit problems (12%), weather related issues (7%), and other problems (21%). In<br />
the short and medium term production growth looks limited.<br />
3 June 2010 31
1995<br />
1996<br />
1997<br />
1998<br />
1999<br />
2000<br />
2001<br />
2002<br />
2003<br />
2004<br />
2005<br />
2006<br />
2007<br />
2008<br />
2009<br />
2010<br />
YoY chg %pt<br />
% YoY Chg, 3MMA<br />
'000 tonnes<br />
<strong>Macquarie</strong> <strong>Research</strong><br />
<strong>Discovery</strong> <strong>Metals</strong> Ltd.<br />
Medium-term supply<br />
growth has issues<br />
Fig 42<br />
Global copper supply and demand balance<br />
Over the medium term, 85% of copper mine supply growth is projected to come from Latin<br />
America and Africa, specifically, Chile, Peru, Mexico, the DRC and Zambia. However, each of<br />
these countries faces its own challenges in bringing on new copper supply. In Chile, water<br />
availability and ageing mines are potential constraints to supply growth, meaning desalination<br />
plants are needed for new mines and head grade declines, longer hauls and lower availability<br />
of secondary ores are features of older mines. In Peru energy availability is set to be an issue<br />
while in the DRC there are well publicised infrastructure and political issues and in Zambia<br />
there are infrastructure constraints.<br />
Our long-term copper price forecast is US$2.20/lb in $2010 terms and US$2.63/lb in $2016<br />
terms.<br />
'000 tonnes 2008 2009f 2010f 2011f 2012f 2013f 2014f 2015f<br />
World Consumption 18163 17722 18720 19908 20710 21385 22087 22820<br />
% Change Y-o-Y -0.7 -2.4 5.6 6.3 4.0 3.3 3.3 3.3<br />
World Production 18382 18540 18633 19347 20471 21350 22103 22847<br />
% Change Y-o-Y 2.4 0.9 0.5 3.8 5.8 4.3 3.5 3.4<br />
Balance 219 818 -87 -561 -240 -35 16 27<br />
World stocks (all) 1192 1975 1888 1327 1087 1052 1068 1095<br />
Stocks (Weeks global) 3.4 5.8 5.2 3.5 2.7 2.6 2.5 2.5<br />
LME Cash Price (c/lb) 316 234 341 350 300 270 270 260<br />
LME Cash Price ($/t) 6968 5152 7522 7716 6614 5952 5952 5732<br />
Source: <strong>Macquarie</strong> <strong>Research</strong>, May 2010<br />
Fig 43<br />
Copper mine supply has underperformed<br />
Fig 44 Even solid forecast output growth is not<br />
enough<br />
200%<br />
180%<br />
160%<br />
140%<br />
120%<br />
100%<br />
80%<br />
60%<br />
40%<br />
20%<br />
0%<br />
-20%<br />
-40%<br />
-60%<br />
Margin (12mths fwd, lhs)<br />
Mine supply (rhs)<br />
20%<br />
18%<br />
16%<br />
14%<br />
12%<br />
10%<br />
8%<br />
6%<br />
4%<br />
2%<br />
0%<br />
-2%<br />
-4%<br />
-6%<br />
Copper Mine Supply Changes<br />
1000<br />
900<br />
800<br />
700<br />
600<br />
500<br />
400<br />
300<br />
200<br />
100<br />
0<br />
-100<br />
-200<br />
1985 1990 1995 2000 2005 2010f 2015f<br />
Source: <strong>Macquarie</strong> <strong>Research</strong>, May 2010 Source: <strong>Macquarie</strong> <strong>Research</strong>, May 2010<br />
3 June 2010 32
Jan<br />
Feb<br />
Mar<br />
Apr<br />
May<br />
Jun<br />
Jul<br />
Aug<br />
Sep<br />
Oct<br />
Nov<br />
Dec<br />
'000 tonnes<br />
<strong>Macquarie</strong> <strong>Research</strong><br />
<strong>Discovery</strong> <strong>Metals</strong> Ltd.<br />
Fig 45 Ex-Chinese demand is recovering Fig 46 Our refined copper demand forecasts<br />
1250<br />
1200<br />
1150<br />
1100<br />
2004 2005<br />
2006 2007<br />
2008 2009<br />
'000 tonnes 2008 2009 2010f 2011f 2012f 2013f 2014f 2015f<br />
USA 1952 1650 1700 1784 1820 1838 1857 1875<br />
Europe 4623 3567 3745 4045 4126 4167 4209 4251<br />
Japan 1199 838 872 924 942 952 961 971<br />
China 5180 6669 7269 7778 8245 8657 9090 9544<br />
Other Asia 3672 3628 3737 3923 4080 4244 4413 4590<br />
Other 1537 1370 1397 1453 1497 1527 1557 1589<br />
World 18163 17722 18720 19908 20710 21385 22087 22820<br />
World ex China 12983 11053 11450 12130 12466 12728 12997 13275<br />
1050<br />
1000<br />
950<br />
900<br />
850<br />
% Change Y-o-Y 2008 2009 2010f 2011f 2012f 2013f 2014f 2015f<br />
USA -8.8 -15.5 3.0 5.0 2.0 1.0 1.0 1.0<br />
Europe -5.8 -22.9 5.0 8.0 2.0 1.0 1.0 1.0<br />
Japan -4.1 -30.1 4.0 6.0 2.0 1.0 1.0 1.0<br />
China 7.9 28.7 9.0 7.0 6.0 5.0 5.0 5.0<br />
Other Asia -1.3 -1.2 3.0 5.0 4.0 4.0 4.0 4.0<br />
Other 4.4 -10.8 2.0 4.0 3.0 2.0 2.0 2.0<br />
World -0.7 -2.4 5.6 6.3 4.0 3.3 3.3 3.3<br />
World ex China -3.8 -14.9 3.6 5.9 2.8 2.1 2.1 2.1<br />
800<br />
Source: <strong>Macquarie</strong> <strong>Research</strong>, May 2010 Source: <strong>Macquarie</strong> <strong>Research</strong>, May 2010<br />
3 June 2010 33
<strong>Macquarie</strong> <strong>Research</strong><br />
<strong>Discovery</strong> <strong>Metals</strong> Ltd.<br />
Board & Management<br />
Gordon Galt – Chairman<br />
Gordon Galt is a senior mineral resources executive and an experienced director with<br />
international mineral industry experience. During his career, Mr Galt has worked in senior<br />
management, technical and operational roles across a wide range of commodities, primarily<br />
in gold, coal, magnesium and copper/lead/zinc. Mr Galt is by training, a mining engineer, with<br />
post-graduate qualifications in finance. Both degrees are from the University of Queensland.<br />
Brad Sampson – Managing Director<br />
Brad Sampson has over 20 years‟ Australian and International experience as a mining<br />
engineer. He has worked extensively in open cut and underground mine operations and<br />
developments in Southern Africa, Australia and the Pacific. He previously held an executive<br />
role in Thiess Ltd and has been in General Management roles with Gold Fields <strong>Limited</strong> at St<br />
Ives gold mine in Western Australia and at the Kloof operation in South Africa. He has also<br />
held the position of General Manager-PNG for Emperor Mines <strong>Limited</strong>. He has also held<br />
positions with Anglo American, Ross Mining NL and Comalco. Mr Sampson is also the<br />
managing director of all <strong>Discovery</strong> <strong>Metals</strong> subsidiaries registered in Botswana.<br />
Morrice Cordiner – Non Executive Director<br />
Mr Cordiner is a corporate lawyer by training and has in excess of 15 years‟ experience in the<br />
finance and resources industries. He is a founding Director of <strong>Discovery</strong> <strong>Metals</strong>, and was<br />
instrumental in identifying the original projects and strategic alliance with Falconbridge Inc<br />
that formed the original assets of the Company in 2003. Over the last six years Mr Cordiner<br />
has been involved in the successful development and financing of a number of junior listed<br />
resource companies with projects in gold, nickel, copper and zinc.<br />
John Shaw - Non Executive Director<br />
John Shaw has over 40 years‟ experience in exploration, development and operations of<br />
open cut and underground mines. He previously was Vice President of the Australian<br />
Operations of Placer Dome Asia Pacific <strong>Limited</strong> and Managing Director of Kidston Gold<br />
Mines. Mr Shaw is a former Chairman of Gallery Gold <strong>Limited</strong>, Zimbabwe Platinum Mines<br />
<strong>Limited</strong>, Tri Origin Minerals <strong>Limited</strong>, Albidon <strong>Limited</strong> and Lodestone Exploration <strong>Limited</strong>. He<br />
was also involved with the development of the Mupane Gold Mine in NE Botswana.<br />
Jeremy Read - Non Executive Director<br />
Jeremy Read has 22 years‟ domestic and international minerals exploration experience and<br />
was previously the Manager of BHP Minerals Australian Exploration Team. He has extensive<br />
exploration experience for gold, nickel sulphides and base metals. Mr. Read played a critical<br />
role in the discovery of the Kabanga North Nickel deposit, in Tanzania which is currently<br />
undergoing feasibility studies. He is skilled in developing new technical teams, management<br />
of technical/specialist service groups, project generation activities, risk management, multicommodity<br />
mineral exploration, company listings and capital raisings. During his employment<br />
with BHP Mr Read participated in the development of several significant strategic exploration<br />
alliances. Mr Read was the founding managing director of <strong>Discovery</strong> <strong>Metals</strong> from its<br />
incorporation in May 2003 until his appointment as a non-executive director on 1 February<br />
2008. He is also the founding managing director of Meridian Minerals <strong>Limited</strong>.<br />
Ribson Gabonowe<br />
Ribson Gabonowe is a well-known Mining Engineer with over 25 years of experience in the<br />
mining industry. For twelve years to Dec 2006, Ribson was the Director of Mines of<br />
Botswana, responsible for administering the legal and fiscal framework governing mineral<br />
exploitation. In this role Ribson was involved in negotiations of mineral agreements for<br />
copper, nickel, diamonds, coal and soda ash. Ribson is currently a director of Kukama Mining<br />
and Exploration, African Coal (Pty) Ltd, Atlas Minerals (Pty) Ltd and Gabor Consulting (Pty)<br />
Ltd. Mr Gabonowe is also the director of all <strong>Discovery</strong> <strong>Metals</strong>‟ subsidiaries registered in<br />
Botswana.<br />
3 June 2010 34
<strong>Macquarie</strong> <strong>Research</strong><br />
<strong>Discovery</strong> <strong>Metals</strong> Ltd.<br />
Notes<br />
3 June 2010 35
<strong>Macquarie</strong> <strong>Research</strong><br />
<strong>Discovery</strong> <strong>Metals</strong> Ltd.<br />
Notes<br />
3 June 2010 36
<strong>Macquarie</strong> <strong>Research</strong><br />
<strong>Discovery</strong> <strong>Metals</strong> Ltd.<br />
Notes<br />
3 June 2010 37
<strong>Macquarie</strong> <strong>Research</strong><br />
Important disclosures:<br />
Recommendation definitions<br />
<strong>Macquarie</strong> - Australia/New Zealand<br />
Outperform – return >5% in excess of benchmark return<br />
Neutral – return within 5% of benchmark return<br />
Underperform – return >5% below benchmark return<br />
<strong>Macquarie</strong> – Asia/Europe<br />
Outperform – expected return >+10%<br />
Neutral – expected return from -10% to +10%<br />
Underperform – expected return +10%<br />
Neutral – expected return from -10% to +10%<br />
Underperform – expected return 5% in excess of benchmark return<br />
Neutral – return within 5% of benchmark return<br />
Underperform – return >5% below benchmark return<br />
<strong>Macquarie</strong> - USA<br />
Outperform (Buy) – return >5% in excess of Russell<br />
3000 index return<br />
Neutral (Hold) – return within 5% of Russell 3000 index<br />
return<br />
Underperform (Sell)– return >5% below Russell 3000<br />
index return<br />
Recommendations – 12 months<br />
Note: Quant recommendations may differ from<br />
Fundamental Analyst recommendations<br />
Volatility index definition*<br />
This is calculated from the volatility of historical<br />
price movements.<br />
Very high–highest risk – Stock should be<br />
expected to move up or down 60–100% in a year<br />
– investors should be aware this stock is highly<br />
speculative.<br />
High – stock should be expected to move up or<br />
down at least 40–60% in a year – investors should<br />
be aware this stock could be speculative.<br />
Medium – stock should be expected to move up<br />
or down at least 30–40% in a year.<br />
Low–medium – stock should be expected to<br />
move up or down at least 25–30% in a year.<br />
Low – stock should be expected to move up or<br />
down at least 15–25% in a year.<br />
* Applicable to Australian/NZ/Canada stocks only<br />
Financial definitions<br />
<strong>Discovery</strong> <strong>Metals</strong> Ltd.<br />
All "Adjusted" data items have had the following<br />
adjustments made:<br />
Added back: goodwill amortisation, provision for<br />
catastrophe reserves, IFRS derivatives & hedging,<br />
IFRS impairments & IFRS interest expense<br />
Excluded: non recurring items, asset revals, property<br />
revals, appraisal value uplift, preference dividends &<br />
minority interests<br />
EPS = adjusted net profit / efpowa*<br />
ROA = adjusted ebit / average total assets<br />
ROA Banks/Insurance = adjusted net profit /average<br />
total assets<br />
ROE = adjusted net profit / average shareholders funds<br />
Gross cashflow = adjusted net profit + depreciation<br />
*equivalent fully paid ordinary weighted average<br />
number of shares<br />
All Reported numbers for Australian/NZ listed stocks<br />
are modelled under IFRS (International Financial<br />
Reporting Standards).<br />
Recommendation proportions – For quarter ending 31 March 2010<br />
AU/NZ Asia RSA USA CA EUR<br />
Outperform 50.55% 62.20% 42.25% 42.39% 62.16% 46.74% (for US coverage by MCUSA, 6.53% of stocks covered are investment banking clients)<br />
Neutral 36.63% 19.02% 47.89% 50.35% 31.89% 34.78% (for US coverage by MCUSA, 9.62% of stocks covered are investment banking clients)<br />
Underperform 12.82% 18.78% 9.86% 7.27% 5.95% 18.48% (for US coverage by MCUSA, 0.00% of stocks covered are investment banking clients)<br />
Company Specific Disclosures:<br />
The <strong>Macquarie</strong> Group is a substantial securities holder in <strong>Discovery</strong> Metal <strong>Limited</strong> (DML:ASX).<br />
Important disclosure information regarding the subject companies covered in this report is available at www.macquarie.com/research/disclosures.<br />
Analyst Certification:<br />
The views expressed in this research accurately reflect the personal views of the analyst(s) about the subject securities or issuers and no part of the<br />
compensation of the analyst(s) was, is, or will be directly or indirectly related to the inclusion of specific recommendations or views in this research. The<br />
analyst principally responsible for the preparation of this research receives compensation based on overall revenues of <strong>Macquarie</strong> Group Ltd ABN 94<br />
122 169 279 (AFSL No. 318062) (MGL) and its related entities (the <strong>Macquarie</strong> Group) and has taken reasonable care to achieve and maintain<br />
independence and objectivity in making any recommendations.<br />
General Disclaimers:<br />
<strong>Macquarie</strong> Securities (Australia) Ltd; <strong>Macquarie</strong> Capital (Europe) Ltd; <strong>Macquarie</strong> Capital Markets Canada Ltd; <strong>Macquarie</strong> Capital Markets North America<br />
Ltd; <strong>Macquarie</strong> Capital (USA) Inc; <strong>Macquarie</strong> Capital Securities Ltd and its Taiwan branch; <strong>Macquarie</strong> Capital Securities (Singapore) Pte Ltd;<br />
<strong>Macquarie</strong> Securities (NZ) Ltd; <strong>Macquarie</strong> First South Securities (Pty) <strong>Limited</strong>; <strong>Macquarie</strong> Capital Securities (India) Pvt Ltd; <strong>Macquarie</strong> Capital Securities<br />
(Malaysia) Sdn Bhd; and <strong>Macquarie</strong> Securities (Thailand) Ltd are not authorized deposit-taking institutions for the purposes of the Banking Act 1959<br />
(Commonwealth of Australia), and their obligations do not represent deposits or other liabilities of <strong>Macquarie</strong> Bank <strong>Limited</strong> ABN 46 008 583 542 (MBL)<br />
or MGL. MBL does not guarantee or otherwise provide assurance in respect of the obligations of any of the above mentioned entities. MGL provides a<br />
guarantee to the Monetary Authority of Singapore in respect of the obligations and liabilities of <strong>Macquarie</strong> Capital Securities (Singapore) Pte Ltd for up<br />
to SGD 35 million. This research has been prepared for the general use of the wholesale clients of the <strong>Macquarie</strong> Group and must not be copied, either<br />
in whole or in part, or distributed to any other person. If you are not the intended recipient you must not use or disclose the information in this research in<br />
any way. If you received it in error, please tell us immediately by return e-mail and delete the document. We do not guarantee the integrity of any e-mails<br />
or attached files and are not responsible for any changes made to them by any other person. MGL has established and implemented a conflicts policy at<br />
group level (which may be revised and updated from time to time) (the "Conflicts Policy") pursuant to regulatory requirements (including the FSA Rules)<br />
which sets out how we must seek to identify and manage all material conflicts of interest. Nothing in this research shall be construed as a solicitation to<br />
buy or sell any security or product, or to engage in or refrain from engaging in any transaction. In preparing this research, we did not take into account<br />
your investment objectives, financial situation or particular needs. Before making an investment decision on the basis of this research, you need to<br />
consider, with or without the assistance of an adviser, whether the advice is appropriate in light of your particular investment needs, objectives and<br />
financial circumstances. There are risks involved in securities trading. The price of securities can and does fluctuate, and an individual security may<br />
even become valueless. International investors are reminded of the additional risks inherent in international investments, such as currency fluctuations<br />
and international stock market or economic conditions, which may adversely affect the value of the investment. This research is based on information<br />
obtained from sources believed to be reliable but we do not make any representation or warranty that it is accurate, complete or up to date. We accept<br />
no obligation to correct or update the information or opinions in it. Opinions expressed are subject to change without notice. No member of the<br />
<strong>Macquarie</strong> Group accepts any liability whatsoever for any direct, indirect, consequential or other loss arising from any use of this research and/or further<br />
communication in relation to this research. Clients should contact analysts at, and execute transactions through, a <strong>Macquarie</strong> Group entity in their home<br />
jurisdiction unless governing law permits otherwise.<br />
Country-Specific Disclaimers:<br />
Australia: In Australia, research is issued and distributed by <strong>Macquarie</strong> Securities (Australia) Ltd (AFSL No. 238947), a participating organisation of the<br />
Australian Securities Exchange. New Zealand: In New Zealand, research is issued and distributed by <strong>Macquarie</strong> Securities (NZ) Ltd, a NZX Firm.<br />
Canada: In Canada, research is prepared, approved and distributed by <strong>Macquarie</strong> Capital Markets Canada Ltd, a participating organisation of the<br />
Toronto Stock Exchange, TSX Venture Exchange & Montréal Exchange. <strong>Macquarie</strong> Capital Markets North America Ltd., which is a registered brokerdealer<br />
and member of FINRA, accepts responsibility for the contents of reports issued by <strong>Macquarie</strong> Capital Markets Canada Ltd in the United States<br />
and sent to US persons. Any person wishing to effect transactions in the securities described in the reports issued by <strong>Macquarie</strong> Capital Markets<br />
Canada Ltd should do so with <strong>Macquarie</strong> Capital Markets North America Ltd. The <strong>Research</strong> Distribution Policy of <strong>Macquarie</strong> Capital Markets Canada<br />
Ltd is to allow all clients that are entitled to have equal access to our research. United Kingdom: In the United Kingdom, research is issued and<br />
distributed by <strong>Macquarie</strong> Capital (Europe) Ltd, which is authorised and regulated by the Financial Services Authority (No. 193905). Germany: In<br />
Germany, research is issued and distributed by <strong>Macquarie</strong> Capital (Europe) Ltd, Niederlassung Deutschland, which is authorised and regulated in the<br />
United Kingdom by the Financial Services Authority (No. 193905). France: In France, research is issued and distributed by <strong>Macquarie</strong> Capital (Europe)<br />
Ltd, which is authorised and regulated in the United Kingdom by the Financial Services Authority (No. 193905). Hong Kong: In Hong Kong, research is<br />
issued and distributed by <strong>Macquarie</strong> Capital Securities Ltd, which is licensed and regulated by the Securities and Futures Commission. Japan: In<br />
Japan, research is issued and distributed by <strong>Macquarie</strong> Capital Securities (Japan) <strong>Limited</strong>, a member of the Tokyo Stock Exchange, Inc. and Osaka<br />
3 June 2010 38
<strong>Macquarie</strong> <strong>Research</strong><br />
<strong>Discovery</strong> <strong>Metals</strong> Ltd.<br />
Securities Exchange Co. Ltd (Financial Instruments Firm, Kanto Financial Bureau (kin-sho) No. 231, a member of Japan Securities Dealers Association<br />
and Financial Futures Association of Japan). India: In India, research is issued and distributed by <strong>Macquarie</strong> Capital Securities (India) Pvt Ltd, which<br />
is a SEBI registered Stock Broker having membership with National Stock Exchange of India <strong>Limited</strong> (INB231246738) and Bombay Stock Exchange<br />
<strong>Limited</strong> (INB011246734). Malaysia: In Malaysia, research is issued and distributed by <strong>Macquarie</strong> Capital Securities (Malaysia) Sdn. Bhd. (Company<br />
registration number: 463469-W) which is a Participating Organisation of Bursa Malaysia Berhad and a holder of Capital Markets Services License<br />
issued by the Securities Commission. Taiwan: Information on securities/instruments that are traded in Taiwan is distributed by <strong>Macquarie</strong> Capital<br />
Securities Ltd, Taiwan Branch, which is licensed and regulated by the Financial Supervisory Commission. No portion of the report may be reproduced<br />
or quoted by the press or any other person without authorisation from <strong>Macquarie</strong>. Thailand: In Thailand, research is issued and distributed by<br />
<strong>Macquarie</strong> Securities (Thailand) Ltd, a licensed securities company that is authorized by the Ministry of Finance, regulated by the Securities and<br />
Exchange Commission of Thailand and is an exchange member no. 28 of the Stock Exchange of Thailand. The Thai Institute of Directors Association<br />
has disclosed the Corporate Governance Report of Thai Listed Companies made pursuant to the policy of the Securities and Exchange Commission of<br />
Thailand. <strong>Macquarie</strong> Securities (Thailand) Ltd does not endorse the result of the Corporate Governance Report of Thai Listed Companies but this<br />
Report can be accessed at:<br />
http://www.thai-iod.com/en/publications.asp?type=4. South Africa: In South Africa, research is issued and distributed by <strong>Macquarie</strong> First South<br />
Securities (Pty) <strong>Limited</strong>, a member of the JSE <strong>Limited</strong>. Singapore: In Singapore, research is issued and distributed by <strong>Macquarie</strong> Capital Securities<br />
(Singapore) Pte Ltd (Company Registration Number: 198702912C), a Capital Markets Services license holder under the Securities and Futures Act to<br />
deal in securities and provide custodial services in Singapore. Pursuant to the Financial Advisers (Amendment) Regulations 2005, <strong>Macquarie</strong> Capital<br />
Securities (Singapore) Pte Ltd is exempt from complying with sections 25, 27 and 36 of the Financial Advisers Act. All Singapore-based recipients of<br />
research produced by <strong>Macquarie</strong> Capital (Europe) <strong>Limited</strong>, <strong>Macquarie</strong> Capital Markets Canada Ltd, <strong>Macquarie</strong> First South Securities (Pty) <strong>Limited</strong> and<br />
<strong>Macquarie</strong> Capital (USA) Inc. represent and warrant that they are institutional investors as defined in the Securities and Futures Act. United States: In<br />
the United States, research is issued and distributed by <strong>Macquarie</strong> Capital (USA) Inc., which is a registered broker-dealer and member of FINRA.<br />
<strong>Macquarie</strong> Capital (USA) Inc, accepts responsibility for the content of each research report prepared by one of its non-US affiliates when the research<br />
report is distributed in the United States by <strong>Macquarie</strong> Capital (USA) Inc. <strong>Macquarie</strong> Capital (USA) Inc.‟s affiliate‟s analysts are not registered as<br />
research analysts with FINRA, may not be associated persons of <strong>Macquarie</strong> Capital (USA) Inc., and therefore may not be subject to FINRA rule<br />
restrictions on communications with a subject company, public appearances, and trading securities held by a research analyst account. Any persons<br />
receiving this report directly from <strong>Macquarie</strong> Capital (USA) Inc. and wishing to effect a transaction in any security described herein should do so with<br />
<strong>Macquarie</strong> Capital (USA) Inc. Important disclosure information regarding the subject companies covered in this report is available at<br />
www.macquarie.com/research/disclosures, or contact your registered representative at 1-888-MAC-STOCK, or write to the Supervisory Analysts,<br />
<strong>Research</strong> Department, <strong>Macquarie</strong> Securities, 125 W.55th Street, New York, NY 10019.<br />
© <strong>Macquarie</strong> Group<br />
Auckland<br />
Tel: (649) 377 6433<br />
London<br />
Tel: (44 20) 3037 4400<br />
Bangkok<br />
Tel: (662) 694 7999<br />
Manila<br />
Tel: (63 2) 857 0888<br />
Calgary<br />
Tel: (1 403) 218 6650<br />
Melbourne<br />
Tel: (613) 9635 8139<br />
Hong Kong<br />
Tel: (852) 2823 3588<br />
Montreal<br />
Tel: (1 514) 925 2850<br />
Jakarta<br />
Tel: (62 21) 515 1818<br />
Mumbai<br />
Tel: (91 22) 6653 3000<br />
Johannesburg<br />
Tel: (2711) 583 2000<br />
Perth<br />
Tel: (618) 9224 0888<br />
Kuala Lumpur<br />
Tel: (60 3) 2059 8833<br />
Seoul<br />
Tel: (82 2) 3705 8500<br />
Shanghai<br />
Singapore<br />
Sydney<br />
Taipei<br />
Tokyo<br />
Toronto<br />
New York<br />
Tel: (86 21) 6841 3355 Tel: (65) 6231 1111 Tel: (612) 8232 9555 Tel: (886 2) 2734 7500 Tel: (81 3) 3512 7900 Tel: (1 416) 848 3500 Tel: (1 212) 231 2500<br />
Available to clients on the world wide web at www.macquarieresearch.com and through Thomson Financial, FactSet, Reuters, Bloomberg, CapitalIQ and<br />
TheMarkets.com.<br />
3 June 2010 39
<strong>Research</strong><br />
Heads of Equity <strong>Research</strong><br />
David Rickards (Global Co – Head) (44 20) 3037 4399<br />
John O’Connell (Global Co – Head) (612) 8232 7544<br />
Matt Nacard (Australia) (612) 8232 4017<br />
Consumer Staples<br />
Food & Beverages<br />
Greg Dring (612) 8232 3104<br />
Consumer Discretionary<br />
Media<br />
Alex Pollak (612) 8232 3172<br />
Retailing<br />
Greg Dring (612) 8232 3104<br />
Energy<br />
Adrian Wood (612) 8232 8531<br />
Financials<br />
Banks<br />
Tom Quarmby (612) 8232 8668<br />
Michael Wiblin (612) 8232 6089<br />
Diversified Financials<br />
Deana Mitchell (612) 8232 4576<br />
Insurance<br />
Tony Jackson (612) 8232 4442<br />
Deana Mitchell (612) 8232 4576<br />
Healthcare<br />
Steve Wheen (612) 8232 4130<br />
Industrials<br />
Capital Goods<br />
Greg Dring (612) 8232 3104<br />
John Purtell (612) 8232 8633<br />
Sales<br />
<strong>Equities</strong><br />
Stevan Vrcelj (Global) (612) 8232 5999<br />
Martin Dacron (Australia) (612) 8232 7421<br />
Dave Roberton (New Zealand) (649) 363 1498<br />
Sales<br />
Anthony Panaretto (Global) (612) 8232 4500<br />
Luke Sullivan (New York) (1 212) 231 2507<br />
Eric Roles (New York) (1 212) 231 2559<br />
Rob Fabbro (London) (44 20) 3037 4865<br />
Brett Dimon (London) (44 20) 3037 4831<br />
Scott Dolling (Hong Kong) (852) 2823 3705<br />
Mike Johnson (Sydney) (612) 8232 8518<br />
Ruben Boopalan (Singapore) (65) 6231 2888<br />
Brendan Waller (Melbourne) (613) 9635 8177<br />
Industrials<br />
Transportation /Commercial Services<br />
Ian Myles (612) 8232 4157<br />
Russell Shaw (612) 8232 7124<br />
Transportation – Infrastructure<br />
Ian Myles (612) 8232 4157<br />
Materials<br />
Chemicals/Containers, Packaging/Paper &<br />
Forest Products, Construction Materials<br />
John Purtell (612) 8232 8633<br />
Doug Macphillamy (612) 8232 3114<br />
Global <strong>Metals</strong> & Mining<br />
Len Eldridge (618) 9224 0838<br />
Brendan Harris (612) 8232 3575<br />
Sophie Spartalis (612) 8232 5159<br />
Katherine Taylor (612) 8232 3117<br />
Martin Stulpner (618) 9224 0866<br />
Real Estate<br />
Property Trusts & Developers<br />
Paul Checchin (612) 8232 4197<br />
Adam Sonnabend (612) 8232 7647<br />
Telecommunications / Tourism & Leisure<br />
Andrew Levy (612) 8232 5165<br />
Utilities<br />
Gavin Maher (612) 8232 4151<br />
Commodities & Precious <strong>Metals</strong><br />
Jim Lennon (London) (44 20) 3037 4271<br />
Kona Haque (London) (44 20) 3037 4334<br />
New Zealand<br />
Stephen Hudson (Materials/Utilities) (649) 363 1414<br />
Brooke Bone (Industrials/Energy) (649) 363 1474<br />
Warren Doak (Consumer/Transport/<br />
Tourism/Airports) (649) 363 1416<br />
Lyall Taylor (Industrials) (649) 357 6933<br />
Stephen Ridgewell (Healthcare/<br />
Property/Strategy) (649) 363 1476<br />
Andrew Levy (Telecommunications) (612) 8232 5165<br />
Sales Trading<br />
Tim Shaw (Sydney) (612) 8232 4368<br />
Andrew Donald (Melbourne) (613) 9635 8270<br />
Jon Holland (Auckland) (649) 363 1471<br />
Adam Ritter (New York) (1 212) 231 6613<br />
Ed Robinson (London) (44 20) 3037 4902<br />
Specialist Sales<br />
Duane O'Donnell (Property Trusts) (612) 8232 6844<br />
George Platt (Quantitative/Index) (612) 8232 6539<br />
Phil Zammit (Emerging Leaders) (612) 8232 3122<br />
Lee Bowers (Resources) (612) 8232 9834<br />
Syndication<br />
Paul Staines (612) 8232 7781<br />
Angus Firth (612) 8232 4039<br />
Emerging Leaders<br />
Adam Simpson (612) 8232 4439<br />
Andrew Wackett (618) 9224 0867<br />
Jodie Bannan (612) 8232 2999<br />
David Moberley (612) 8232 7786<br />
Alistair Monro (612) 8232 4754<br />
Quantitative<br />
Martin Emery (Hong Kong) (852) 2823 3582<br />
Scott Hamilton (612) 8232 3544<br />
George Platt (612) 8232 6539<br />
Burke Lau (612) 8232 0481<br />
John Conomos (612) 8232 5157<br />
Data Services<br />
Sheridan Duffy (612) 8232 9786<br />
Seasha Merino (612) 8232 3649<br />
Economics and Strategy<br />
Tanya Branwhite (Strategy) (612) 8232 7628<br />
Richard Gibbs (Head of Economics) (612) 8232 3935<br />
Neale Goldston-Morris (Strategy) (612) 8232 7562<br />
Brian Redican (Aus Economics) (612) 8232 7016<br />
Mark Tierney (Int’l Economics) (612) 8232 3121<br />
Find our research at<br />
<strong>Macquarie</strong>: www.macquarie.com.au/research<br />
Thomson: www.thomson.com/financial<br />
Reuters: www.knowledge.reuters.com<br />
Bloomberg: MAC GO<br />
Factset: http://www.factset.com/home.aspx<br />
CapitalIQ www.capitaliq.com<br />
TheMarkets.com www.themarkets.com<br />
Contact Gareth Warfield for access (612) 8232 3207<br />
See and hear our analysts at<br />
www.macquarie.com.au/macquariedigital<br />
Toll free from overseas<br />
Canada 1800 989 8159<br />
Hong Kong 800 96 2049<br />
Japan 0053 161 6437<br />
New York 1888 622 7862<br />
Singapore 800 616 1037<br />
Email addresses<br />
FirstName.Surname@macquarie.com<br />
eg. David.Rickards@macquarie.com<br />
Alternative Strategies<br />
Kristen Edmond (Sales) (612) 8232 3111<br />
Shannon Donohoe<br />
(Stock borrow & loan) (612) 8232 6997<br />
Greg Mann (Equity finance) (612) 8232 1820<br />
Cameron Duncan (Converts) (612) 8232 7405<br />
Anthony Hourigan (Derivatives) (612) 8232 9884<br />
Treasury & Commodities<br />
Gavin Bradley (<strong>Metals</strong> & Mining) (612) 8232 4248<br />
Matthew Forgham<br />
(<strong>Metals</strong> & Mining) (44 20) 3037 4615<br />
James Mactier (<strong>Metals</strong> & Mining) (618) 9224 0612<br />
Ian Miller (Futures) (612) 8232 3555<br />
Will Richardson (Foreign Exch) (612) 8232 4777