Goldman Sachs Investor Research - Discovery Metals Limited
Goldman Sachs Investor Research - Discovery Metals Limited
Goldman Sachs Investor Research - Discovery Metals Limited

You also want an ePaper? Increase the reach of your titles
YUMPU automatically turns print PDFs into web optimized ePapers that Google loves.
INITIATION<br />
7 October 2010<br />
<strong>Discovery</strong> <strong>Metals</strong> <strong>Limited</strong><br />
Initiating Coverage<br />
Materials | <strong>Metals</strong> & Mining | Australia<br />
*A full version of this document is available*<br />
Event:<br />
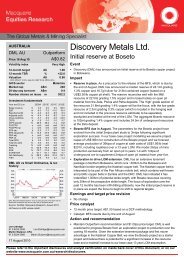
• We are initiating coverage of <strong>Discovery</strong> <strong>Metals</strong> Ltd (DML).<br />
Key take Outs:<br />
• DML is developing the Boseto copper project in Botswana and has<br />
extensive exploration tenements for both copper and nickel in<br />
Botswana.<br />
• To date DML has only completed exploration on sufficient strike extent<br />
of the known mineralisation to underpin a 3mtpa mine to produce c.<br />
36kt of copper and 1.1moz of silver per annum.<br />
• The bankable feasibility study (BFS) contemplates a US$175m capital<br />
investment for an open pit operation over a 5-year mine life with C1<br />
cash costs of US$1.28/lb but the Development Plan incorporates both<br />
open pit and underground operations at the same throughput rate to<br />
produce a similar level of copper and silver, but over a 15-year mine life<br />
at a marginally lower cash cost of US$1.23/lb.<br />
• Our estimates assume the same capital costs and production at similar<br />
levels but with higher unit mining costs resulting in higher cash costs of<br />
US$1.60/lb (LOM) but lower in the early years (driven by a lower strip<br />
ratio in the Zeta Pit).<br />
• DML plans funding through a combination of 60% debt and 40% equity<br />
funding with first production in early 2012.<br />
Earnings and Valuation Impact:<br />
• Prior to the commencement of production in FY12, earnings are not<br />
relevant. Our valuation ranges from a base of $0.91/share to upside<br />
of$1.20/share which is lower than the BFS (which assumes lower cost, a<br />
higher copper price and cost savings coming from the adoption of a new<br />
coal-fired power station).<br />
Investment View:<br />
• We are commencing coverage with a HOLD recommendation and a 12-<br />
month target price of $1.50.<br />
HOLD<br />
Key Information<br />
Stock Code<br />
DML<br />
Share Price $1.275<br />
12 Month Target Price $1.50<br />
Expected 12M Total Return 17.6%<br />
Investment Data<br />
Issued Capital<br />
302mna<br />
Market Capitalisation<br />
na<br />
% of S&P 200 Index na<br />
Free Float 100%<br />
Turnover<br />
$1.6m/month<br />
12 Month Price Range na¢-na¢<br />
Debt/Equity 0.5%<br />
Investment Arithmetic<br />
Jun year end 10A 11E 12E 13E<br />
Net Profit Rep. ($m) -4.7 -9.7 18.7 136.4<br />
NPAT Pre-NRI's ($m) -4.7 -9.7 18.7 136.4<br />
EPS Adj. (¢) -2.0 -3.6 6.9 50.4<br />
EPS Growth (%) nm nm nm 630<br />
PER (x) nm nm 18.5 2.5<br />
Relative PER (%) nm nm 75.4 -75.3<br />
Dividend (¢) 0.0 0.0 0.0 0.0<br />
Yield (%) 0.0 0.0 0.0 0.0<br />
Franking (%) 0 0 0 0<br />
FCFPS (¢) -6.8 -4.9 4.1 73.5<br />
P:FCFPS (x) nm nm 31.1 1.7<br />
EV/EBITDA (x) nm nm 20.6 1.1<br />
BV (¢) 32 24 31 81<br />
P/BV (x) 3.9 5.4 4.1 1.6<br />
Av. Full Dil. Shares (m) 229.0 270.4 270.4 270.4<br />
Share Price Chart<br />
• Our strong views on the inability of global copper supply to meet our<br />
forecast demand drives the positive fundamental outlook for copper and<br />
hence our favourable pricing outlook.<br />
• Within our universe of copper stocks, DML has a better copper grade<br />
than most but has lower by-product credits and a materially higher LOM<br />
strip ratio, leading to an upper 3rd quartile cost curve position.<br />
• The key risk, in our view, is the actual unit cost of moving rock and this,<br />
coupled with the high strip ratio, is the major impact on total costs and<br />
unit costs (both per tonne and per lb).<br />
Relative Price Performance<br />
1m 3m 12m<br />
vs. S&P 200: 42.0% 100.1%203.8%<br />
vs. MSCI - World: 46.9% 110.4%208.1%<br />
Ian Preston | +61 3 9679 1453 | ian.preston@gs.com.au<br />
Paul Hissey | +61 3 9679 1779 | paul.hissey@gs.com.au<br />
Brett Cottrell | +61 3 9679 1565 | brett.cottrell@gs.com.au<br />
Source: Company data, IRESS, and GS&PA <strong>Research</strong> estimates<br />
<strong>Goldman</strong> <strong>Sachs</strong> & Partners Australia<br />
Investment <strong>Research</strong><br />
All figures in A$ unless otherwise advised<br />
Important disclosures and the Reg AC Certification appear at the back of this report<br />
1
7 October 2010 <strong>Discovery</strong> <strong>Metals</strong> <strong>Limited</strong><br />
RECOMMENDATION - Our Thinking<br />
RECOMMENDATION:<br />
HOLD<br />
Stock Code: DML Rationale: -ve Neut +ve<br />
Share Price: $ 1.28 Industry Structure: <br />
Valuation: $ 0.91 EVA Trend: <br />
Earnings Momentum:<br />
Catalysts:<br />
Price / Valuation:<br />
<br />
<br />
<br />
We are initiating coverage with a neutral recommendation and a 12-month target price of<br />
$1.50.<br />
Our positive view of copper is driven by our view that the market is moving to an ongoing<br />
deficit which will require a higher copper price, both to allow lower grade and less profitable<br />
greenfield projects to be developed over time and to destroy some demand from those areas<br />
where substitution can take place.<br />
DML controls a significant area of copper mineralisation within the Botswana Kalahari<br />
Copperbelt which is thought to be a continuation of the renowned Zambian Copperbelt.<br />
The geology appears to be well understood and DML is proposing a combined open pit and<br />
underground mining operation and, given the extensive strike continuity of the orebody,<br />
should be able to extend the mine life by progressively adding to the strike extent of mining.<br />
Whilst there has been only limited deeper drilling to date, the nature of the orebody (sharp<br />
geological cut-offs on the F/W and some mineralisation into the H/W) suggest that it will be<br />
amenable to mechanised underground mining at similar (or better) grade than the open pit.<br />
The two key operational risks that we can identify are the average strip ratio 15.9:1 (LOM) in<br />
the development case and the percentages of oxide and transition ore versus sulphide ore<br />
which will impact overall recoveries.<br />
We can identify with a strategy of limiting the open pit depth of mining to lower the waste<br />
stripping and thus LOM strip ratio (but this does mean that there will be a higher percentage<br />
of oxide and transition ore) and increasing the strike extent of the open pit, or more<br />
accurately strip mine, to maintain the overall open pit tonnage.<br />
The second key risk is the cost of actually moving a tonne of material. DML has synthesised a<br />
material movement cost of US$1.35/tonne which we find extremely low but acknowledge<br />
that the strip mining may allow less waste handling, leading to a lowering of waste haul<br />
distances, etc. Nonetheless, this unit cost/tonne is significantly lower than that of any of the<br />
other companies we cover.<br />
Corporate Structure<br />
• <strong>Discovery</strong> <strong>Metals</strong> is listed on the following markets:<br />
• Australian Stock Exchange (ASX: DML) - December 2003<br />
• Botswana Stock Exchange (BSE: DML) - December 2006<br />
• Alternative Investment Market (AIM: DME) - June 2007<br />
• The company has a June year-end and reports in AUD.<br />
<strong>Goldman</strong> <strong>Sachs</strong> & Partners Australia<br />
Investment <strong>Research</strong><br />
All figures in A$ unless otherwise advised 2
7 October 2010 <strong>Discovery</strong> <strong>Metals</strong> <strong>Limited</strong><br />
Botswana Background (Snowden Technical Report)<br />
Background<br />
• Botswana was formerly a British Colony (Bechuanaland) which gained independence<br />
from Britain in 1966. Since then, Botswana has enjoyed consistent economic growth<br />
based principally on diamond mining (also potash, copper, iron ore, nickel, salt and<br />
silver) and tourism.<br />
• Similarly to both Zambia and Senegal, Botswana has had civilian governments since<br />
Independence without any coup d'etat.<br />
• Botswana occupies a land mass of ~587,000km 2 which is relatively flat (lowest point the<br />
junction of the Limpopo and Sashe rivers (513m) and the highest point the Tsodilo Hills<br />
in the extreme north west of the country (1,489m). The country has a semi-arid climate<br />
with warm winters and hot summers.<br />
• Botswana is land locked with Namibia to the west, Angola and Zambia to the north,<br />
Zimbabwe to the east and South Africa to the south.<br />
• Botswana is a parliamentary republic with an elected President (Head of State) and<br />
Government and a cabinet appointed by the President. Elections are for 5-year terms<br />
with the HOS able to be re-elected for a second term.<br />
• The economy is dominated by diamond mining, accounting for >33% of GDP and 70% -<br />
80% of export earnings. Other mining, tourism, financial services, subsistence farming<br />
and cattle raising provide the balance of the economy.<br />
• Botswana's GDP of US$10.94bn (official exchange rate) or US$26bn at purchasing power<br />
parity breaks down as:<br />
Industry ............. 52.6%<br />
Services ............. 45.8%<br />
Agriculture ............ 1.6%<br />
• Prior to the Global Financial Crisis (GFC), Botswana had enjoyed strong GDP growth of<br />
5.2% 2009; 2.9% 2008 and 4.4% 2007.<br />
• As with much of Africa, unofficial unemployment is ~40%, although official<br />
unemployment is much lower at 7.5% (2007) with HIV a major issue in the country and<br />
reportedly the 2nd highest in the world.<br />
• The official currency is the Pula which is essentially fixed to the South African Rand and<br />
the country has public debt of 17.9% of GDP (2009) up from 5.9% (2008); foreign debt<br />
of US$1.65bn but also foreign reserves of US$9.575bn (2009).<br />
• The Botswana legal system is based on Roman Dutch law but also includes local<br />
customary law with judicial review limited to matters of interpretation.<br />
Botswana Mining Code<br />
• Mining legislation in Botswana is covered by the Mines and Minerals Act, 1999 - based<br />
generally on Australian and Canadian models. Mineral rights are therefore vested in the<br />
Republic of Botswana.<br />
• The Act provides security of tenure and, although the previous right to free equity for the<br />
government has been abolished, it retains the right to earn up to 15% as a minority<br />
interest, with the government paying a pro-rata share for its interest.<br />
• Mining attracts a variable income tax rate (with the exception of diamonds - which have<br />
a separate agreement) which is typically 25%, but slides up to a maximum of 50%<br />
determined annually by reference to the company's profit ratio.<br />
• Royalties are calculated as a percentage of the gross market value of the mineral and<br />
are 3% for copper and 5% for silver.<br />
• Applications for mineral rights are made directly to the Minister of Mineral Resources and<br />
Water Affairs. There are four types of mineral rights in Botswana: a prospecting licence,<br />
a retention licence, a mining lease and a mineral permit and these can be granted to an<br />
individual or a company.<br />
<strong>Goldman</strong> <strong>Sachs</strong> & Partners Australia<br />
Investment <strong>Research</strong><br />
All figures in A$ unless otherwise advised 3
7 October 2010 <strong>Discovery</strong> <strong>Metals</strong> <strong>Limited</strong><br />
Prospecting licence<br />
• A single prospecting licence is restricted to a maximum area of 1,000km 2 and confers<br />
exclusive rights on the holder over the mineral applied for as specified in the licence. If<br />
further minerals are discovered during prospecting, the prospecting licence may be<br />
amended accordingly to include the mineral concerned.<br />
• A prospecting licence is granted for a term of up to three years, renewable for two<br />
further periods of two years each. A reduction by 50% of the licence area is required at<br />
each renewal. Prospecting licences are transferable with the consent of the Minister.<br />
Among the obligations under the licence are scheduled exploration expenditures,<br />
reporting requirements and scheduled payments per square kilometre for exploration<br />
right (i.e. rentals).<br />
Retention licence<br />
• Retention licences are granted where minerals have been found during prospecting, but<br />
are not economically viable to mine in the short term. A retention licence must be<br />
applied for not less than three months prior to the expiry of the prospecting licence<br />
concerned. The applicant must show that it has carried out a feasibility study on the<br />
deposit and demonstrate that it cannot be mined on a profitable basis at the time of the<br />
application. A retention licence is granted for a three-year period and may be renewed<br />
only once for a further three-year period. The retention licence must be maintained in a<br />
safe condition and, within two months of expiry of the licence, all equipment and<br />
infrastructure must be removed. Quarterly reports of any prospecting activities on the<br />
retention licence must be filed to the Minister.<br />
• A person or company holding a retention licence is entitled to apply for a mining lease<br />
over that retention area. The retention licence is transferable, subject to the approval of<br />
the Minister.<br />
Mining lease<br />
• A mining lease is only issued to a prospecting licence or retention licence holder over the<br />
ore deposit in question. An application for a mining lease may only be made by a<br />
company incorporated in Botswana. A mining lease is granted subject to specified<br />
conditions, and the proposed financing plan submitted as part of the feasibility study<br />
must provide for a debt to equity ratio of no more than 3:1. The lease is valid for a 25-<br />
year term and may be renewed for another period not exceeding 25 years. Mining leases<br />
are transferable with the approval of the Minister. The proposed mining area should only<br />
cover that area reasonably required for surface mining and treatment facilities and also<br />
to cover the Measured, Indicated and Inferred Mineral Resources.<br />
• The holder of a mining lease has the right to conduct operations in accordance within the<br />
area and time limit specified in the licence, including acquiring the necessary land use<br />
rights, constructing facilities and carrying out work on the lease area and selling the<br />
mineral products resulting from its work. Among other requirements, the applicant for a<br />
mining lease must present and have approved a plan for developing and utilising the<br />
mineral resources and an environmental impact assessment.<br />
• The environmental impact assessment must consider the following issues:<br />
−<br />
−<br />
−<br />
−<br />
−<br />
−<br />
−<br />
−<br />
−<br />
an overview of the project and motivation;<br />
description of the pre-mining environment (geology, climate, topography, soil, land<br />
use);<br />
ecology, animal life, former and current mining operations, surface water, ground<br />
water, air;<br />
quality, noise and vibration, archaeological and cultural aspects, sensitive<br />
landscapes;<br />
protected areas, visual aspects, regional and socio-economic infrastructure);<br />
detailed project description;<br />
environmental impact assessment (separated by phase – construction, operational,<br />
decommissioning, residual impacts);<br />
environmental management programme; and<br />
consultation process.<br />
<strong>Goldman</strong> <strong>Sachs</strong> & Partners Australia<br />
Investment <strong>Research</strong><br />
All figures in A$ unless otherwise advised 4
7 October 2010 <strong>Discovery</strong> <strong>Metals</strong> <strong>Limited</strong><br />
DML has an approved EIA for a 2mtpa process plant and has applied to increase the<br />
annual throughput rate to 3mtpa. This approval is expected in CY10.<br />
Minerals permit<br />
• A person wishing to conduct small-scale mining operations (over an area not exceeding<br />
0.5km 2 ) may apply for a minerals permit, subject to the written permission of the land<br />
owner, land board or the holder of any other mineral concession over the land applied<br />
for. Permits for industrial minerals shall only be granted to citizens of Botswana or<br />
companies incorporated therein. A minerals permit is valid for 5 years, renewable for<br />
further periods of 5 years. A minerals permit is transferable subject to the approval of<br />
the Minister.<br />
Botswana Royalty and Taxation<br />
Royalty<br />
The royalty is 3% ad valorem for copper and 5% ad valorem for silver.<br />
Taxation<br />
Botswana allows 100% write-off of capital expenditure and pre-production capital before tax<br />
becomes payable.<br />
The minimum tax rate is 25% and there is in addition a sliding-scale tax rate that is based on<br />
the profitability of the operation according to the formula:<br />
Y = 70 – (1500/X) Y is the tax rate (minimum 25%); X is the profitability ratio.<br />
On our estimates, in the period to 2015 in an elevated copper price environment, we<br />
calculate a total tax rate of ~27.5%, ie. A 2.5% variable tax in addition to the 25% base tax<br />
rate.<br />
Botswana Government Option<br />
The Government has a one-off statutory option to acquire at market price (bankable<br />
feasibility study (BFS) valuation) up to 15% of the project at the time of granting the mining<br />
licence. Should this option be exercised, the Botswana Government becomes a direct<br />
shareholder in the company (project) with a requirement to contribute a share of capital and<br />
in return receive a share of dividends and distributions, etc.<br />
However, since the introduction of this legislation in 1999, the Government has not exercised<br />
this option in any mining development.<br />
Botswana Infrastructure<br />
Botswana is well-serviced by road, rail and power reticulation and has international air links<br />
to neighbouring countries.<br />
However, the net power demand exceeds in-country power generation and thus Botswana is<br />
an importer of power, mainly from South Africa. Currently Botswana Power Corporation<br />
(BPC) generates ~80% of required power with the balance of power imported from the<br />
Southern African Power Grid. There are plans for additional coal-fired power generation<br />
plants in Botswana which should result in Botswana becoming power self-sufficient by 2013.<br />
Specifically, expansion of the Morupule Power Plant, Mmamabula and the potential<br />
Independent Power Plant – Mookane – may see Botswana becoming a net exporter of power<br />
to the grid.<br />
With respect to water, Botswana is an arid country with limited water resources. However,<br />
there are a number of known aquifers which can be tapped into and provide sufficient water<br />
for all DML’s needs.<br />
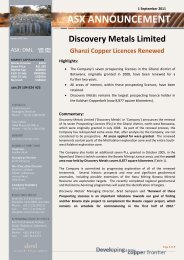
<strong>Discovery</strong> Minerals<br />
DML currently has two assets in Botswana. The primary focus of its activities is the Boseto<br />
Copper Project, for which DML has recently concluded a BFS. This project contains several<br />
lenses of mineralisation, with the first, Zeta, due to commence production in Q4CY11.<br />
The second project, Dikoloti Nickel, is less advanced and currently undergoing further<br />
exploration in order to increase the resource base. We have included a map of DML's<br />
properties below.<br />
<strong>Goldman</strong> <strong>Sachs</strong> & Partners Australia<br />
Investment <strong>Research</strong><br />
All figures in A$ unless otherwise advised 5
7 October 2010 <strong>Discovery</strong> <strong>Metals</strong> <strong>Limited</strong><br />
Source: Company data<br />
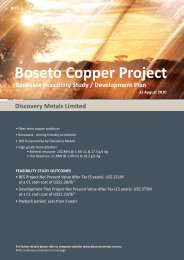
Boseto Copper Project (BCP)<br />
Highlights<br />
• Located in north-west Botswana, DML commenced a pre-feasibility study in August 2007<br />
and announced the outcomes of the BFS at the end of August 2010. A summary of the<br />
project is included below:<br />
− Extended Pre-Feasibility Study update in January 2009.<br />
− Definitive Feasibility Study and Development Plan September 2010.<br />
−<br />
−<br />
−<br />
−<br />
Open pit mine with 15-year mine life through a combination of open pit and<br />
underground mining.<br />
3mtpa conventional flotation concentrator-Recoveries of 83.6% Cu and 61% Ag.<br />
To produce 36.4kt Cu and 1.1moz Ag per annum (in concentrate 41% Cu grade).<br />
CAPEX of US$175m and net cash cost US$1.23/lb.<br />
− NPV of US$375m at a copper price of US$3.00lb and US$17/oz silver at a 10%<br />
discount rate and inclusive of coal-fired power.<br />
• Three strike zones containing 102.8mt of Mineral Resources:<br />
− Zeta: 35.4mt @ 1.4% Cu and 22.3g/t Ag<br />
− Plutus: 22.6mt @ 1.5% Cu and 15.3g/t Ag<br />
− Plutus (NE): 14.9mt @ 1.2% Cu and 12.5g/t Ag<br />
− Petra: 12.7mt @ 1.3% Cu and 15.0g/t Ag<br />
− Petra (SW): 17.2mt @ 1.4% Cu and 17.3g/t Ag<br />
Introduction<br />
<strong>Discovery</strong> <strong>Metals</strong>' Boseto Copper Project (100% owned) is located in north-west Botswana,<br />
approximately 80km south-west of the town of Maun, within the district of Namaqualand. A<br />
seven-tenement package was granted to <strong>Discovery</strong> <strong>Metals</strong> in September 2005 and fieldwork<br />
on this tenement package commenced in October 2005. The Government of Botswana<br />
approved the company's renewal of these tenements in September 2008 and all prospective<br />
areas were retained by the company.<br />
In June 2008, <strong>Discovery</strong> <strong>Metals</strong> was granted an additional seven tenements extending from<br />
the south-west boundary of the original 2005 granted tenements through to the Namibian<br />
border, adding 5,700km 2 to the area held under prospecting licences, to bring the total<br />
tenement area to 10,100km 2 . In September 2010, DML relinquished 444km 2 as required to<br />
<strong>Goldman</strong> <strong>Sachs</strong> & Partners Australia<br />
Investment <strong>Research</strong><br />
All figures in A$ unless otherwise advised 6
7 October 2010 <strong>Discovery</strong> <strong>Metals</strong> <strong>Limited</strong><br />
have a current exploration tenement package of 9,656km 2 . The outer limit of the exploration<br />
licence area starts approximately 60km south-west of Maun and stretches in a south-westerly<br />
direction for approximately 300km to the Namibian border.<br />
The Boseto Copper Project is located within a belt of significant copper-silver mineralisation<br />
that extends from the well known and more highly developed Zambian Copperbelt across<br />
north-west Botswana and into Namibia. The poorly explored and undeveloped portion of this<br />
belt in north-west Botswana is known as the Kalahari Copperbelt.<br />
Copper in the Boseto Project area occurs predominantly in chalcocite, with minor amounts of<br />
bornite and other copper sulphides present. At shallow depths, malachite and chrysocolla<br />
exist in significant proportions within some areas of the mineral resource.<br />
Resources and Reserves<br />
Both the current resources and reserve estimates for Boseto have been used as a base input<br />
for the completion of recent studies by DML. The BFS has taken into account the reserves,<br />
with the development plan utilising additional material in the mineral resource category.<br />
Resources<br />
This resource has been generated from infill drilling associated with the BFS and is current as<br />
at 31 August 2010. We have reproduced the resource below:<br />
Boseto Mineral Resource<br />
Tonnes Grade Metal<br />
Zeta mt Cu (%) Ag (g/t) Cu kt Ag moz<br />
Measured 3.9 1.6 23.0 62.4 2.9<br />
Indicated 7.0 1.5 23.8 105.0 5.4<br />
Inferred 24.5 1.4 21.8 343.0 17.2<br />
Total 35.4 1.4 22.3 510.4 25.4<br />
Plutus and Petra<br />
Measured 0.1 1.3 11.4 1.3 0.0<br />
Indicated 11.5 1.4 14.1 161.0 5.2<br />
Inferred 55.8 1.4 14.8 781.2 26.6<br />
Total 67.4 1.4 14.7 943.5 31.8<br />
Total 102.8 1.4 17.3 1454 57<br />
Source: Company data<br />
Reported at a cut-off grade of 0.6% Cu<br />
Reserves<br />
Following the release of the BFS on 31 August 2010, we have included the resultant ore<br />
reserves. Key assumptions used by DML include:<br />
‣ Copper price US$3.00/lb<br />
‣ Silver price: US$17/oz<br />
‣ Copper cut-off grade of 0.6% Cu<br />
‣ Only those portions of the resource amenable to open pit mining have been included in<br />
the ore reserve statement.<br />
The ore reserve statement is:<br />
Boseto Ore Reserve<br />
Tonnes<br />
Grade<br />
Metal<br />
Zeta mt Cu (%) Ag (g/t) Cu kt Ag moz<br />
Proved 4 1.6 22.1 64 3<br />
Probable 6.5 1.5 23.6 98 5<br />
Total 10.5 1.5 23.0 158 8<br />
Plutus and Petra<br />
Proved 0.2 1.3 11 3 0<br />
Probable 11.1 1.36 14.5 151 5<br />
Total 11.3 1.3 14.5 147 5<br />
Total 21.8 1.4 18.5 305 13<br />
Source: Company data<br />
Reported at a cut-off grade of 0.6% Cu<br />
<strong>Goldman</strong> <strong>Sachs</strong> & Partners Australia<br />
Investment <strong>Research</strong><br />
All figures in A$ unless otherwise advised 7
7 October 2010 <strong>Discovery</strong> <strong>Metals</strong> <strong>Limited</strong><br />
Mine Plan<br />
• The BFS released in late August 2010 outlines a mine plan for BCP, which will see it<br />
commence production as an open pit in late 2011. In conjunction with this, DML also<br />
released a development plan, which incorporates additional mineralised material which is<br />
not of sufficient confidence to be promoted to reserves. We have, where applicable,<br />
assumed some material outlined in the development plan as part of our base case. In<br />
effect, we have modelled both open pit and underground mining in our base estimate.<br />
• Our current base case for DML assumes the construction and operation of Boseto open<br />
pit for the initial 3 years followed by the addition of an underground mine from 2015.<br />
Combined production would remain at 3mtpa, increasing to 3.5mtpa (GS&PA estimates)<br />
as operations are optimised with ore being sourced initially equally from the two<br />
operations, but at the expanded rate 2mtpa (open pit) and 1.5mtpa (underground).<br />
• Our key production assumptions compared to the BFS are shown below:<br />
GS&PA<br />
DML<br />
Production Metrics<br />
Annual Production mtpa 3.0 3.0<br />
Strip Ratio waste:ore 15 15<br />
Cu feed grade % 1.5 1.5<br />
Cu recovery % 84.0 84.0<br />
Cu production kt Cu 36.4 36.4<br />
Ag feed grade g/t 20.2 20.2<br />
Ag recovery % 61.0 61.0<br />
Ag production moz 1.1 1.1<br />
Source: Company data, GS&PA <strong>Research</strong> estimates<br />
Capital Cost<br />
DML's pre-feasibility study capital estimate for a 2mtpa plant was US$185m which was<br />
updated in September 2009 to US$150m. More recently, DML has increased the planned<br />
throughput rate from 2mtpa to 3mtpa and advised that the contracted capital cost for the<br />
plant to be ~US$91m and that the total capital cost of construction of the operation at<br />
Boseto will be in the order of US$175m (including contingencies).<br />
A breakdown of these capital costs is included below.<br />
Capital Items<br />
US$m<br />
Process plant - fixed price EPCM 91.2<br />
First fills and spares 10.3<br />
Tailings storage facility 2.7<br />
Diesel power generators 10.7<br />
Roads, offices, workshope, land compensation 13.1<br />
Process and mine control systems 8.0<br />
Village infrastructure 15.5<br />
Temp. Infrastructure 8.7<br />
Owners Team 3.6<br />
Subtotal 163.8<br />
Contigency & escalation 11.2<br />
Total 175.0<br />
Source: Company data<br />
Operating Cost<br />
DML has provided guidance as to its expected operating cost of BCP during the initial start-up<br />
when the project will still have a debt repayment requirement. We have adjusted these as we<br />
see fit. A summary of the operating costs we have used in our estimates versus the BFS is<br />
included below. The key difference that we have allowed for is a higher unit cost for moving<br />
material.<br />
<strong>Goldman</strong> <strong>Sachs</strong> & Partners Australia<br />
Investment <strong>Research</strong><br />
All figures in A$ unless otherwise advised 8
7 October 2010 <strong>Discovery</strong> <strong>Metals</strong> <strong>Limited</strong><br />
GS&PA<br />
DML<br />
Production Costs<br />
Mining cost - Open Pit US$/t ore 21.0 21.6<br />
Mining cost - Underground US$/t ore 37.5 37.5<br />
Processing cost US$/t 10.35 10.34<br />
G&A cost US$/t 2.75 2.74<br />
Average Site Cost US$/t 43.3 34.68<br />
TC/RC^ $t, ¢/lb $53, 5.3¢ $45, 4.5¢<br />
Transport US$/t 180.0 180.0<br />
Source: Company data, GS&PA <strong>Research</strong> estimates<br />
^average FY12-FY15<br />
Mining Costs<br />
DML has provided a breakdown of the major costs. In our view, the US$1.35/tonne of<br />
material mined is low in comparison with other operations that we cover. We have used a<br />
more conservative US$1.50/t.<br />
In the early stages we have assumed a strip ratio of 13:1 and a cost of material movement<br />
of US$1.50/t. This translates to a unit cost for the period FY12 - FY14 of US$1.50/lb including<br />
the ramp-up stage.<br />
Once both the underground and open pit operations are operational we assume a 15:1 strip<br />
ratio with 2mtpa of open pit and 1.5mtpa from underground with an overall cash cost of<br />
US$1.74/lb (and assumes the LT TC/RC of US$90/t and US 9c/lb).<br />
Underground<br />
An addition to the BFS is the anticipation of the commencement of underground mining from<br />
~FY15. The need for this method has arisen due to the increasing strip ratio required to<br />
extract the relatively thin seam of ore in each of the lenses at greater depths. To date, the<br />
underground component has only been assessed as a development plan, given there is<br />
currently insufficient indicated and measured resources available for conversion to ore<br />
reserves (as a result of economic feasibility). We have, however, assumed some of this<br />
material is mined in our base case. The large resource base (>100mt) has led to the increase<br />
in the proposed capacity of the processing plant (along with an ever-expanding resource<br />
base) from 2mtpa to 3mtpa (we assume that the plant will operate above nameplate capacity<br />
at 3.5mtpa once limited debottlenecking is carried out).<br />
The underground development plan (scoping study) is focussed only on the Zeta zone on the<br />
higher grade copper zone (Cu >1.5% Cu) over 2,000 metres on strike and to a depth which<br />
varies between 100m and 650m depth. The scoping study evaluated the 25mt @ 1.4% Cu<br />
and 23.1g/t Ag to a maximum depth of 360m. DML estimated a low capital cost of US$10m.<br />
DML evaluated some 2,000m of strike broken into two operating sections each serviced by a<br />
separate decline. The design is based on a total of 13 strike drives situated some 20m<br />
vertically apart to a depth of ~360m although the deposit remains open below this depth.<br />
DML envisage a conventional uphole retreat mining method using a top-down mining system<br />
which limits the ongoing development requirements. DML does not envisage using any backfill<br />
in order to lower the costs, with the geotechnical stability thus dependent upon rib and sill<br />
pillars. DML reports that the H/W is competent but does contain mineralisation and thus any<br />
dilution does carry some grade.<br />
Bogging will be with remote or tele-remote loaders.<br />
We note that the oxide ore goes to a depth of 10m to 25m, transition ore from 25m to ~35m<br />
before moving into sulphide ore. The underground operation will thus increase the<br />
percentage of sulphide ore reporting to the plant.<br />
DML anticipates unit costs ~US$37/t off ore with decline costs of US$3,200/metre and<br />
US$2,900/metre for the strike development. Capital costs were estimated at US$5m at each<br />
decline and sustaining capital of US$3.5m/annum. We believe that these costs are realistic<br />
<strong>Goldman</strong> <strong>Sachs</strong> & Partners Australia<br />
Investment <strong>Research</strong><br />
All figures in A$ unless otherwise advised 9
7 October 2010 <strong>Discovery</strong> <strong>Metals</strong> <strong>Limited</strong><br />
and may perhaps be considered conservative once full steady-state operations are<br />
established.<br />
DML assumed mining recovery rates of 68% and unplanned dilution of 5% in the scoping<br />
study.<br />
We have included the proposed underground mining operation into our base case, as we<br />
think it is highly likely that this will proceed.<br />
Processing<br />
DML proposes a conventional copper concentrator plant incorporating 3-stage crushing and<br />
single-stage milling (and a regrind milling circuit) followed by two separate concentrate<br />
circuits. DML plans to first float the sulphide material with the tails (including oxide material)<br />
then reporting to an oxide circuit. Each concentrate circuit incorporates 3-stage concentrator;<br />
rougher, secondary and cleaner circuits.<br />
Recoveries will vary from ~60% in oxide to +92% - 95% for the sulphide to give the overall<br />
~84% recovery. Given the mineralogy (chalcocite and bornite), DML anticipates producing a<br />
very high grade concentrate grading ~41% copper.<br />
Timeline<br />
DML anticipates completing the project finance in 2010 with construction to commence<br />
shortly thereafter and 1st production early in 2012.<br />
Source: Company data<br />
<strong>Goldman</strong> <strong>Sachs</strong> & Partners Australia<br />
Investment <strong>Research</strong><br />
All figures in A$ unless otherwise advised 10
7 October 2010 <strong>Discovery</strong> <strong>Metals</strong> <strong>Limited</strong><br />
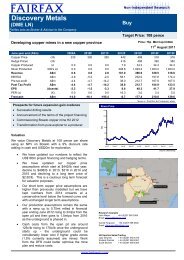
Boseto Headline Outcomes<br />
DML released the outcome from the BFS and Development plan in late August 2010 with the<br />
key parameters as follows:<br />
Source: Company data<br />
DML has entered into an offtake agreement with Transamine for 100% of the concentrate<br />
produced for the first five years, based on normal arms length terms. In return for the<br />
offtake agreement, DML undertook a share placement to Transamine of 25m shares at<br />
A$0.76/share ( a 11% premium to the 4-week VWAP share price at the time) to raise A$18m<br />
in March 2010.<br />
DML plans to truck the concentrate to Gobabis in neighbouring Namibia (520km) then rail to<br />
the port of Walvis Bay (650km).<br />
DML has provided a table of the key sensitivities for the development, which is included<br />
below. In our view, the key issue for this development is the actual mining cost per tonne<br />
and, coupled with this, the strip ratio. Whilst we see some upside risk to the planned<br />
US41.35/t mining costs, we do see the ability for DML to limit the strip ratio with more ore<br />
being mined from underground and, given the strike extent of the ore zones, the ability to<br />
replace deeper open pit ore with additional shallower ore for the open pit mining.<br />
Source: Company data<br />
<strong>Goldman</strong> <strong>Sachs</strong> & Partners Australia<br />
Investment <strong>Research</strong><br />
All figures in A$ unless otherwise advised 11
7 October 2010 <strong>Discovery</strong> <strong>Metals</strong> <strong>Limited</strong><br />
GS&PA Boseto Copper Profile<br />
Base Case<br />
• Our current base case for DML assumes the construction and operation of Boseto open<br />
pit, with a contribution from the underground operation commencing approximately 3<br />
years later. We allow for a mine life out to 2026 initially at 3mtpa throughput rate<br />
increasing to 3.5mtpa from 2018.<br />
• We have not made any allowances for the mix of debt:equity funding, and have assumed<br />
a flat grade, tonnage and cost profile for both underground and open pit operations.<br />
• We note that DML is proposing a 60%:40% debt:equity split. We view this as too<br />
aggressive and believe that at most 50% debt should be contemplated and preferably<br />
30%:70% as more appropriate for a single-mine, single-commodity development<br />
company. This should also ensure that any hedging requirement from the banks is<br />
minimised. In addition, it means that DML will have funds available to continue with the<br />
exploration programme during the construction phase of Boseto.<br />
• We have also not allowed for the potential cost reduction that can be achieved from the<br />
building and operating of a coal-fired power station to replace the diesel power<br />
generation included in the BFS.<br />
• We have taken the detail of the BFS and incorporated that into our model for Boseto,<br />
and, as it stands, the production profile we have considered in our base case is as<br />
follows:<br />
>>Forecasts<br />
>> Long Term Pricing<br />
Boseto Jun-10 Jun-11 Jun-12 Jun-13 Jun-14 Jun-15 Jun-16 Jun-17 Jun-18 Jun-19 Jun-20<br />
Open Pit<br />
Tonnes mt 0.0 0.0 0.6 3.0 3.0 2.0 1.5 1.8 2.0 2.0 2.0<br />
Grade - Cu (%) 1.46 1.49 1.50 1.50 1.50 1.47 1.46 1.46 1.46 1.46 1.46<br />
Grade - Ag (g/t) 20.2 21.8 22.3 22.3 22.3 20.7 20.2 20.2 20.2 20.2 20.2<br />
Cost/t Ore US$/t 0 0 21 21 21 25 22 22 22 22 22<br />
Underground<br />
Tonnes mt 0.0 0.0 0.0 0.0 0.0 1.1 1.5 1.5 1.5 1.5 1.5<br />
Grade - Cu (%) 1.60 1.60 1.60 1.60 1.60 1.60 1.60 1.60 1.60 1.60 1.60<br />
Grade - Ag (g/t) 1.6 1.6 10.8 20.0 20.0 20.0 20.0 20.0 20.0 20.0 20.0<br />
Cost $/t Ore US$/t 0 0 38 38 38 38 33 33 33 33 33<br />
Processing<br />
Tons Milled (Mt) 0.00 0.00 0.60 3.00 3.00 3.00 3.00 3.25 3.50 3.50 3.50<br />
Grade - Cu (%) 0.00 0.00 1.50 1.50 1.50 1.52 1.53 1.52 1.52 1.52 1.52<br />
Grade - Ag (g/t) 0.0 0.0 11.2 22.3 22.3 20.6 20.1 20.1 20.1 20.1 20.1<br />
Production Copper (kt) 0 0 6 37 38 38 39 42 45 45 45<br />
Production Silver (koz) 201 1307 1312 1209 1183 1282 1381 1381 1381<br />
Costs (A$/t) 0 0 41 42 44 57 55 54 52 52 52<br />
Cash Costs (US¢/lb) 0 0 171 139 139 178 179 179 172 172 172<br />
CAPEX (US$m) 0.9 37.0 141.2 16.3 26.5 8.5 8.2 8.8 9.0 9.0 9.0<br />
Source: Company data, GS&PA <strong>Research</strong> estimates<br />
Upside Case<br />
In our upside case, we have assumed there is some potential for exploitation of the Cu and<br />
Ni (+/- PGE) ore at Dikoloti as well as a further 10-year mine life at Boseto (out to FY36) as<br />
a combined underground and open pit operation.<br />
Dikoloti Nickel Project (DNP)<br />
Highlights<br />
• Located in north-east Botswana.<br />
• DML farmed into the project in July 2004 and has since acquired 85.3% of the project<br />
from Xstrata which retains the remaining 14.7%.<br />
• Marginally economic using conventional processing techniques but heap leach biooxidation<br />
provides a more feasible option.<br />
• Entire project is within 45km of BCL's concentrating and smelter facility, the largest<br />
nickel processing facility in Africa.<br />
• Resource of 4.1mt @ 0.7% Ni, 0.5% Cu and 1.2g/t PGE.<br />
<strong>Goldman</strong> <strong>Sachs</strong> & Partners Australia<br />
Investment <strong>Research</strong><br />
All figures in A$ unless otherwise advised 12
7 October 2010 <strong>Discovery</strong> <strong>Metals</strong> <strong>Limited</strong><br />
Introduction<br />
• The Dikoloti Nickel Project comprises four prospecting licences covering an area of<br />
612km 2 , surrounding the three nickel deposits of BCL <strong>Limited</strong> in the Selebi-Phikwe region<br />
of NE Botswana. The entire project is within 45km of BCL's concentrating and smelter<br />
facility, which is the largest nickel processing facility in Africa. Outside of the immediate<br />
environment of BCL's operating mines, little to no modern exploration had been<br />
conducted prior to the exploration activities of <strong>Discovery</strong> <strong>Metals</strong>.<br />
Resource<br />
• The current resource is early-stage, and DML has indicated it will be continuing<br />
exploration around this mineralised zone in order to increase the tonnage and<br />
confidence, before commencing any further economic studies.<br />
• This resource includes drilling which was completed historically as well as by DML in its<br />
JV with Falconbridge in 2004 and 2005. The defined limits of this resource cover<br />
approximately 2.4km strike length, and a maximum depth of around 100m.<br />
• Estimation was undertaken using ordinary kriging methods, which were constrained by<br />
wireframes constructed using a 0.3% Ni envelope as well as geological interpretation.<br />
Block sizes were based on drilling density, leading to a size of 20m x 40m x 10m (width<br />
x length x depth) which would seem appropriate at this stage of investigation, and an<br />
inferred resource category.<br />
• The resource also assumes a density of 3.72 t/m 3 for mineralised material and 2.85 t/m 3<br />
for waste.<br />
We have included a table outlining the existing resource for Dikoloti below:<br />
Dikoloti Mineral Resource (100%) Grade Metal<br />
mt Ni (%) Cu (%) Pt + Pd g/t Ni kt Cu kt Pt + Pd koz<br />
Measured - - - - - - -<br />
Indicated - - - - - - -<br />
Inferred 4.1 0.7 0.5 1.2 28.7 20.5 158.2<br />
Total 4.1 0.7 0.5 1.2 28.7 20.5 158.2<br />
Source: Company data<br />
Reported at a cut-off grade of 0.5% Ni<br />
Scoping Study<br />
Snowden completed a scoping level study on Dikoloti in 2006 for the likely economic benefit<br />
of operating an open pit, underground mine and a combined operation, with ore toll treated<br />
at the nearby BCL smelter. The study provided a range of outcomes, the greatest of which<br />
was an NPV of A$57m (100%) for a combined underground and open pit operation. We<br />
stress that the key assumptions used in this study may now be out of date, and have<br />
determined our own upside potential for this project (US$48m).<br />
Investment Case<br />
• DML uses AUD as a functional currency, although we expect the project in Botswana to<br />
operate in USD. The financial year-end is June.<br />
Earnings<br />
Our current earnings forecasts are based on a combination of both the BFS (which comprises<br />
open pit mining) and the introduction of underground ore from FY15 (outlined in the<br />
development plan). We have included this material as we believe the underground operation<br />
is highly likely, and has been excluded from the BFS because there has been insufficient<br />
drilling to prove the resource up to a level which can support an economic evaluation (as a<br />
reserve). The geology appears relatively simple and we feel that this upgrade is a matter of<br />
when and not if.<br />
Given the BFS project outline, and our inclusion of some underground material included in<br />
the development plan, our forecast earnings are shown below:<br />
<strong>Goldman</strong> <strong>Sachs</strong> & Partners Australia<br />
Investment <strong>Research</strong><br />
All figures in A$ unless otherwise advised 13
7 October 2010 <strong>Discovery</strong> <strong>Metals</strong> <strong>Limited</strong><br />
Profit & Loss<br />
(A$m)<br />
Year end June 2010a 2011e 2012e 2013e 2014e<br />
Sales Revenue 0 0 63 420 445<br />
Operating costs 5 11 39 175 181<br />
Operating EBITDA -5 -11 24 245 264<br />
D&A 0 0 4 27 29<br />
Operating EBIT -5 -11 19 218 236<br />
EBIT -5 -11 19 218 236<br />
Boseto 0 0 27 221 237<br />
Other -5 -11 -8 -3 -2<br />
Net Interest Exp./(Rev) -1 -1 -12 -24 -31<br />
PreTax Profit (pre ab's) -5 -10 32 242 267<br />
Tax Expense (pre abs) 0 0 13 106 119<br />
OEI 0 0 0 0 0<br />
NET PROFIT (Pre NRI's)1 -5 -10 19 136 148<br />
Abnormal Items (after Tax) 0 0 0 0 0<br />
Reported NPAT (post ab's) -5 -10 19 136 148<br />
Sales Growth (%) -100% 567% 6%<br />
Op. EBITDA Growth (%) N/A N/A N/A 933% 8%<br />
NPAT (Adj.) Growth (%) N/A N/A N/A 629% 8%<br />
EPS (Adj.) Growth (%) 629 8<br />
Op.EBITDA Margin (%) 37.7% 58.4% 59.4%<br />
Interest Cover - EBITD (X) 7.8 8.4 -1.9 -10.0 -8.4<br />
Return on Equity 5 (%) -6% -15% 23% 62% 39%<br />
Source: Company data, GS&PA <strong>Research</strong> estimates<br />
The investment arithmetic is shown below:<br />
Investments Statistics<br />
Year end June 2010a 2011e 2012e 2013e 2014e<br />
Net Profit (Reported) (A$m) -5 -10 19 136 148<br />
- EPS (Reported) 1 (¢) -2.0 -3.6 6.9 50.4 54.7<br />
- PER (Reported) 1 (X) -63.1 -35.9 18.6 2.5 2.3<br />
NET PROFIT (Adj.) 2 (A$m) -5 -10 19 136 148<br />
- EPS (Adj.) 2 (¢) -2.0 -3.6 6.9 50.4 54.7<br />
- EPS Growth (%) -62 77 -293 629 8<br />
- PER (Adj.) 2 (X) n.a n.a 18.6 2.5 2.3<br />
Dividend (¢) 0.0 0.0 0.0 0.0 8.0<br />
- Yield (%) 0.0% 0.0% 0.0% 0.0% 6.2%<br />
- Franking (%) 0% 0% 0% 0% 0%<br />
Free Cash Flow (A$m) -16 -13 11 199 135<br />
- P/FCF 4 (X) -18.8 -26.2 31.7 1.7 2.6<br />
EV(Adj.)/EBITDA 3 (X) -48.7 -33.0 20.8 1.1 0.5<br />
Avg. Shares (diluted) (mill) 229 270 270 270 270<br />
Source: Company data, GS&PA <strong>Research</strong> estimates<br />
Earnings sensitivity to moves in copper price and exchange rate<br />
Given the project is early-stage, we do not have any relevant sensitivity analysis to the<br />
project until FY13. The table below indicates that both currency and metal price fluctuations<br />
have a material impact on earnings.<br />
Sensitiity Analysis<br />
Year End Dec 2010a 2011e 2012e 2013e 2014e<br />
Currency +1¢ n.a n.a n.a -2.1 -2.4<br />
Copper US5¢/lb n.a n.a n.a 2.5 2.4<br />
Source: Company data, GS&PA <strong>Research</strong> estimates<br />
Balance Sheet<br />
DML has outlined its intention to finance the Boseto project with 60% debt. We believe that<br />
this level of debt is too aggressive for a single-mine development company. When the final<br />
financing arrangements are completed we will adjust the financials for the actual debt:equity<br />
mix.<br />
<strong>Goldman</strong> <strong>Sachs</strong> & Partners Australia<br />
Investment <strong>Research</strong><br />
All figures in A$ unless otherwise advised 14
7 October 2010 <strong>Discovery</strong> <strong>Metals</strong> <strong>Limited</strong><br />
For the purposes of our analysis, at this stage we simply assume full debt funding for the<br />
purposes of Income Statement and B/S evaluation. Our current estimates of peak debt<br />
funding are shown below in the B/S.<br />
Balance Sheet<br />
(A$m)<br />
Year end June 2010a 2011e 2012e 2013e 2014e<br />
Cash 39 14 14 237 372<br />
Property, Plant, Equip 35 38 38 38 38<br />
Other Assets 0 0 0 0 0<br />
Debt 0 30 161 161 161<br />
Shareholders Equity 74 64 83 220 378<br />
NET Debt/EBITDA (%) 751% -141% 617% -31% -80%<br />
Net Debt / Equity (%) -53% 24% 176% -35% -56%<br />
Net Debt / (D+E) (%) -113% 19% 64% -53% -127%<br />
Source: Company data, GS&PA <strong>Research</strong> estimates<br />
Cash Flow<br />
As is normal for a development company, operating cash flow is currently negative and<br />
remains so until production commences in FY12 and, on our estimates, DML generates<br />
positive cash flow after all capital in FY13. We include both the initial US$175m capital<br />
expenditure and the underground development ~US$20m in our estimates in FY14.<br />
Our cash flow estimates, as they stand, are included below.<br />
Cash Flow Analysis (A$m)<br />
Year end June 2010a 2011e 2012e 2013e 2014e<br />
Operating EBITDA -5 -11 24 245 264<br />
change in working cap. 0 2 2 2 2<br />
Gross Cashflow -5 -9 26 247 266<br />
Net Interest Paid 1 0 -11 -12 -5<br />
Tax Paid (inc. abs) 0 0 0 -27 -116<br />
Exploration -11 -5 -2 -2 -2<br />
Operating Cash Flow -15 -13 12 207 143<br />
Maintenance Capex 0 0 -1 -8 -8<br />
FREE CASH FLOW -16 -13 11 199 135<br />
Dividends Paid 0 0 0 0 -11<br />
Expansionary Capex -1 -43 -166 -12 -26<br />
Acquisitions 0 0 0 0 0<br />
Asset Sales 1 0 0 0 0<br />
Dividends Received/Other. 2 0 0 0 0<br />
Share Issues/Repurchases 44 0 0 0 0<br />
Increase in Net Cash/(Debt) 30 -56 -155 187 98<br />
Source: Company data, GS&PA <strong>Research</strong> estimates<br />
<strong>Goldman</strong> <strong>Sachs</strong> & Partners Australia<br />
Investment <strong>Research</strong><br />
All figures in A$ unless otherwise advised 15
7 October 2010 <strong>Discovery</strong> <strong>Metals</strong> <strong>Limited</strong><br />
Valuation<br />
• As stated previously, we have included the commencement of open pit mining in FY12<br />
and underground mining in FY15. Our base case assumes combined production from<br />
these two sources at a rate of 3mtpa increasing to 3.5mtpa for 15 years out to the<br />
conclusion of FY26. This base case also includes $65m in exploration assets, which is<br />
included to approximate the likelihood of further resource upgrades.<br />
• For our upside case, we have included a 10-year extension to Boseto, which, given the<br />
size of the current resource is feasible, as well as some benefit from a project<br />
development at Dikoloti. This project is clearly early-stage and not the primary focus of<br />
DML at present.<br />
• We have included a summary of our valuation below:<br />
<strong>Discovery</strong> <strong>Metals</strong><br />
DISCOUNTED CASH FLOW VALUATION<br />
Discount Rate Used % 11.7%<br />
Issued Shares millions 313.9<br />
Mines<br />
A$m<br />
$ per share<br />
Boseto (15 Year Mine Life) 385 $1.23<br />
- $0.00<br />
Sub Total Mines 385 $1.23<br />
Exploration Assets 65 $0.21<br />
NPV of Tax (188) ($0.60)<br />
NPV of Hedge Book – $0.00<br />
Net Cash 39 $0.13<br />
Corporate (36) ($0.11)<br />
Franking Credits 7 $0.02<br />
Option Dilution 15 $0.05<br />
Other – $0.00<br />
Sub Total Corporate/Other (98) ($0.31)<br />
NET PRESENT VALUE 287 $0.91<br />
Upside Options<br />
Boseto Extension of Life (10 Years) - post tax 41 $0.13<br />
Dikoloti Ni Project - attributable and post tax 48 $0.15<br />
UPSIDE VALUATION 377 $1.20<br />
Source: GS&PA <strong>Research</strong> estimates<br />
Financing<br />
DML is yet to complete the funding arrangements for the development of Boseto. However,<br />
the company has articulated the desire to use a maximum amount of debt (as high as 60%).<br />
We see some risk to this high level of debt given the experience of a number of junior<br />
development companies that have not only been forced into excessive hedge positions but<br />
have also been precluded from accessing the project cash flow to fund any exploration or<br />
other developments until the debt has been reduced following the commissioning and<br />
financial closure of the project.<br />
We further note that, on our estimates, DML is currently trading above our base NPV and<br />
thus any equity raising (above NPV) is accretive for shareholders.<br />
Based on the current share price and assuming an equity raising of $121m (gross) 40%<br />
debt: 60% equity (a 7.5% discount to the current share price $1.28/share) our base case<br />
valuation increases to $1.01/share.<br />
<strong>Goldman</strong> <strong>Sachs</strong> & Partners Australia<br />
Investment <strong>Research</strong><br />
All figures in A$ unless otherwise advised 16
7 October 2010 <strong>Discovery</strong> <strong>Metals</strong> <strong>Limited</strong><br />
At the proposed 60% debt, an equity raising of $78m (gross) would see an increase in the<br />
valuation to $1.09/share and if we then lower the WACC accordingly this increases further to<br />
$1.12/share for the base case valuation.<br />
We assume off-balance sheet finance of US$80m for the mining fleet.<br />
Comparisons to PEER group<br />
Earnings Multiples<br />
DML can clearly be viewed as an emerging copper producer, with all earnings derived from<br />
the project at Boseto for at least the next 5-10 years. As a result, we have chosen to<br />
compare the company with other base metal producers of varying scale and commodity.<br />
Positively, though, DML has a significant copper resource, which should allow either a further<br />
expansion or an extension to the mine life of Boseto. We further note that copper is our<br />
preferred base metal.<br />
PER<br />
In FY11, DML has no earnings and therefore no PE multiple. In FY13, however, the earnings<br />
multiple looks inexpensive in comparison to many of its peers including the most direct<br />
comparison, CGG, which has a developing project in Saudi Arabia.<br />
FY13 PER Comparison<br />
GS&PA Investment <strong>Research</strong><br />
20.0<br />
18.0<br />
16.0<br />
14.0<br />
12.0<br />
(x)<br />
10.0<br />
8.0<br />
6.0<br />
4.0<br />
2.0<br />
0.0<br />
OZL<br />
EQN<br />
ABY<br />
PNA<br />
CGG<br />
SFR<br />
DML<br />
MRE<br />
WSA<br />
IGO<br />
KZL<br />
ILU<br />
Source: GS&PA <strong>Research</strong> Estimates, Company Data<br />
PE (x) Price 2010e 2011e 2012e 2013e 2014e 2015e<br />
OZL 1.54 13.1 11.5 9.6 10.0 10.0 55.5<br />
EQN 5.75 18.2 10.0 7.4 7.4 7.8 60.0<br />
ABY 1.24 6.3 4.5 3.1 2.6 2.3 3.5<br />
PNA 0.71 17.0 12.1 8.0 7.4 7.1 43.7<br />
CGG 0.42 n.a. n.a. 17.6 2.4 2.2 3.2<br />
SFR 6.92 n.a. n.a. 0.5 0.5 0.4 0.6<br />
DML 1.30 n.a. n.a. 21.0 2.6 2.4 4.3<br />
MRE 0.82 11.2 20.3 21.4 6.5 5.2 4.9<br />
WSA 6.29 76.8 10.5 16.9 7.4 4.6 4.4<br />
IGO 6.33 24.6 20.7 39.2 18.7 13.9 14.4<br />
KZL 0.68 122.7 6.7 4.0 5.3 2.9 6.3<br />
ILU 6.48 127.4 14.2 11.4 9.0 7.8 6.8<br />
Average 40.4 11.8 12.8 7.3 6.3 16.8<br />
Copper Average 13.6 9.5 9.6 4.7 4.6 24.4<br />
Source: GS&PA <strong>Research</strong> estimates<br />
<strong>Goldman</strong> <strong>Sachs</strong> & Partners Australia<br />
Investment <strong>Research</strong><br />
All figures in A$ unless otherwise advised 17
7 October 2010 <strong>Discovery</strong> <strong>Metals</strong> <strong>Limited</strong><br />
P/FCF<br />
On this measure, DML appears to be quite highly priced at present, particularly in comparison<br />
to its nearest peers, CGG and SFR. In our view, this is a direct result of the higher unit<br />
mining costs combined with the strip ratio in our estimates for BCP.<br />
FY13 P/FCF Comparison<br />
GS&PA Investment <strong>Research</strong><br />
75.0<br />
65.0<br />
55.0<br />
45.0<br />
(x)<br />
35.0<br />
25.0<br />
15.0<br />
5.0<br />
-5.0<br />
OZL<br />
EQN<br />
ABY<br />
PNA<br />
CGG<br />
SFR<br />
DML<br />
KZL<br />
Copper<br />
Average<br />
Source: GS&PA <strong>Research</strong> Estimates, Company Data<br />
P/FCF (x) Price 2010e 2011e 2012e 2013e 2014e 2015e<br />
OZL 1.54 7.6 8.9 7.3 7.1 6.8 24.0<br />
EQN 5.75 8.8 5.4 5.7 6.8 7.3 69.7<br />
ABY 1.24 3.7 3.0 2.5 2.4 2.3 5.3<br />
PNA 0.71 24.7 16.1 9.4 9.2 8.8 42.7<br />
CGG 0.42 n.a. n.a. 17.3 2.4 2.3 3.4<br />
SFR 6.92 n.a. n.a. 4.1 3.9 2.4 3.8<br />
DML 1.30 n.a. n.a. 4.0 71.9 48.7 12.2<br />
KZL 0.68 139.4 5.1 3.6 4.8 2.4 6.0<br />
Copper Average 11.2 8.3 7.2 14.8 11.2 23.0<br />
Source: GS&PA <strong>Research</strong> estimates<br />
EV/EBITDA<br />
ON this basis, DML appears more favourably valued, although still more expensive than a<br />
number of the alternative copper investment opportunities.<br />
FY13 EV/EBITDA Comparison<br />
GS&PA Investment <strong>Research</strong><br />
(x)<br />
3.0<br />
2.5<br />
2.0<br />
1.5<br />
1.0<br />
0.5<br />
0.0<br />
OZL<br />
EQN<br />
ABY<br />
PNA<br />
CGG<br />
SFR<br />
DML<br />
KZL<br />
Copper<br />
Average<br />
Source: GS&PA <strong>Research</strong> Estimates, Company Data<br />
<strong>Goldman</strong> <strong>Sachs</strong> & Partners Australia<br />
Investment <strong>Research</strong><br />
All figures in A$ unless otherwise advised 18
7 October 2010 <strong>Discovery</strong> <strong>Metals</strong> <strong>Limited</strong><br />
EV/EBITDA (x) Price 2010e 2011e 2012e 2013e 2014e 2015e<br />
OZL 1.54 5.1 4.2 3.1 2.9 2.3 7.5<br />
EQN 5.75 15.0 6.3 2.9 1.7 1.2 0.8<br />
ABY 1.24 n.a. 2.8 1.5 0.4 -0.4 -0.9<br />
PNA 0.71 11.9 3.1 2.3 1.0 0.1 -0.6<br />
CGG 0.42 n.a. n.a. 10.9 1.3 0.5 1.5<br />
SFR 6.92 n.a. n.a. 1.7 0.2 -0.8 -1.8<br />
DML 1.30 n.a. n.a. 14.9 1.4 1.3 2.7<br />
KZL 0.68 n.a. 7.0 1.6 0.5 0.3 -0.4<br />
Copper Average 10.7 4.1 4.2 1.4 0.8 1.7<br />
Source: GS&PA <strong>Research</strong> estimates<br />
EV/Production ($lb)<br />
On this comparison, DML appears attractive, more in line with a developing operation.<br />
FY13 EV/Production Comparison ($/lb)<br />
GS&PA Investment <strong>Research</strong><br />
10.0<br />
6.0<br />
2.0<br />
-2.0<br />
OZL<br />
EQN<br />
ABY<br />
PNA<br />
CGG<br />
SFR<br />
DML<br />
KZL<br />
Copper<br />
Average<br />
Source: GS&PA <strong>Research</strong> Estimates, Company Data<br />
EV /Production ($/lb) Price 2010e 2011e 2012e 2013e 2014e 2015e<br />
OZL 1.54 13.4 12.3 10.6 9.5 7.5 7.2<br />
EQN 5.75 11.4 8.1 5.8 4.2 2.9 2.9<br />
ABY 1.24 3.0 1.8 0.6 -0.8 -2.1 -3.0<br />
PNA 0.71 14.0 13.3 11.2 8.3 6.2 6.3<br />
CGG 0.42 n.a n.a 37.5 5.4 2.4 4.7<br />
SFR 6.92 n.a n.a 26.4 9.2 3.0 1.0<br />
DML 1.30 n.a n.a 37.4 3.3 1.6 2.7<br />
KZL 0.68 9.0 6.8 3.7 2.9 0.0 -1.0<br />
Copper Average 10.1 8.4 16.6 5.3 2.7 2.6<br />
Source: GS&PA <strong>Research</strong> estimates<br />
EV/Resource (lbs)<br />
DML is attractively priced on this measure, given the significant resource base.<br />
EV/Resource (c/lb) Resources 2010e 2011e 2012e 2013e 2014e 2015e<br />
OZL 4059 36.2 32.3 27.7 23.6 18.9 18.4<br />
EQN 6440 25.7 20.3 15.5 11.3 7.3 6.6<br />
ABY 1762 9.7 6.3 1.9 -2.6 -6.8 -8.8<br />
PNA 2164 40.7 39.9 34.3 26.6 19.9 20.1<br />
CGG 700 19.8 62.8 69.8 45.9 21.8 41.5<br />
SFR 600 52.0 71.2 72.8 55.2 24.7 8.0<br />
DML 1474 8.2 11.5 15.6 8.7 4.6 7.5<br />
KZL 73 247.3 209.3 136.5 97.9 1.8 -25.9<br />
Copper Average 55.0 56.7 46.8 33.3 11.5 8.4<br />
Source: GS&PA <strong>Research</strong> estimates<br />
<strong>Goldman</strong> <strong>Sachs</strong> & Partners Australia<br />
Investment <strong>Research</strong><br />
All figures in A$ unless otherwise advised 19
7 October 2010 <strong>Discovery</strong> <strong>Metals</strong> <strong>Limited</strong><br />
FY13 EV/Resource Comparison (C/lb)<br />
GS&PA Investment <strong>Research</strong><br />
40.0<br />
35.0<br />
30.0<br />
25.0<br />
20.0<br />
15.0<br />
10.0<br />
5.0<br />
0.0<br />
-5.0<br />
-10.0<br />
-15.0<br />
-20.0<br />
OZL<br />
EQN<br />
ABY<br />
Source: GS&PA <strong>Research</strong> Estimates, Company Data<br />
PNA<br />
45.9<br />
CGG<br />
55.2<br />
SFR<br />
DML<br />
97.9<br />
KZL<br />
Copper<br />
Average<br />
Valuation<br />
• On an NPV basis, DML is trading well above its base valuation at 1.42x as opposed to the<br />
average of 0.99x.<br />
• The upside for DML appears to be slightly higher than the average of this peer group at<br />
1.08 but, given the method of calculation (DCF), does not fully encapsulate the value of<br />
the 100mt+ resource base.<br />
P/NPV - Base Comparison<br />
GS&PA Investment <strong>Research</strong><br />
1.60<br />
1.40<br />
1.20<br />
1.00<br />
0.80<br />
0.60<br />
0.40<br />
0.20<br />
0.00<br />
OZL<br />
EQN<br />
ABY<br />
PNA<br />
CGG<br />
SFR<br />
DML<br />
MRE<br />
WSA<br />
IGO<br />
KZL<br />
ILU<br />
Average<br />
Source: GS&PA <strong>Research</strong> Estimates, Company Data. * not rated<br />
P/NPV (x) Price P / Base NPV P/ Upside NPV<br />
OZL 1.54 0.94 0.90<br />
EQN 5.75 1.45 1.01<br />
ABY 1.24 0.80 0.47<br />
PNA 0.71 1.13 0.64<br />
CGG 0.42 0.95 0.90<br />
SFR 6.92 0.96 0.85<br />
DML 1.30 1.42 1.08<br />
MRE 0.82 0.57 0.34<br />
WSA 6.29 1.07 0.61<br />
IGO 6.33 1.10 0.73<br />
KZL 0.68 0.58 0.41<br />
ILU 6.48 0.85 0.79<br />
Average 0.99 0.73<br />
Source: GS&PA <strong>Research</strong> estimates<br />
<strong>Goldman</strong> <strong>Sachs</strong> & Partners Australia<br />
Investment <strong>Research</strong><br />
All figures in A$ unless otherwise advised 20
7 October 2010 <strong>Discovery</strong> <strong>Metals</strong> <strong>Limited</strong><br />
Risks<br />
Country Risk<br />
We consider the country risk of Botswana to be somewhat lower in comparison to other Sub-<br />
Saharan African peers. We have reproduced a subsection of the recent survey of mining<br />
company executives which places Botswana 5th overall in terms of low-risk mining<br />
destinations. We do note, in the table below, that we have not reproduced all factors. With<br />
this in mind, we see very low risk in mining investment, with the country being known for<br />
having a favourable attitude towards mining activities. The primary area of risk appears to be<br />
infrastructure.<br />
Country Risk<br />
Overall Country Financial Risk Sovereign Risk Land Access Social Risk Infrastructure Labour Relations<br />
1 Canada 0 0 2 1 1 1<br />
2 Sweden 1 1 1 2 1 2<br />
3 Chile 1 1 1.5 1.5 1 2<br />
4 Greenland 1 1 2 2 4 1<br />
5 Botswana 2 1 1 2 4 1<br />
6 United States 2 2 2 2 2 2<br />
7 Laos 2.5 3.5 1 2 3.5 0.5<br />
8 Kazakhstan 3 2 2 1 2 1<br />
9 China 3 3 1 0 2 2<br />
10 Ivory Coast 2 2 2 2 2 2<br />
26 Australia 3 4 3 2 2 1<br />
Source: Resourcestocks World Risk Survey 2010. (this list does not include all survey categories)<br />
Product Risk<br />
We see limited risk for DML on the product side, as the copper fundamentals are the<br />
strongest of the base metals with the market forecast to be in deficit from 2011 onwards.<br />
Whilst copper is not geologically scarce worldwide, future projects are of lower quality than<br />
the best current producers and, when coupled with the falling grades of current global<br />
producers, suggest new large-scale producers will take some years to be brought into<br />
production and require significant capital investment - all in all, not the outlook for easy<br />
supply additions. We further note that many of the easier opportunities for substitution have<br />
already been taken. As a result, there is a high degree of demand inelasticity, which is also<br />
favourable for the metal price.<br />
Land Owners<br />
It is our understanding that DML is still required to negotiate with local land holders, who run<br />
subsistence farming ventures over the potential mining area. Anecdotally this should not be a<br />
problem, with compensation available to claimants. Given DML is domiciled in Australia, it will<br />
be bound by acceptable stakeholder practices to our country (as shareholders become more<br />
interested in companies adopting best practice globally). As mentioned previously, the<br />
government is also proactive in this area to ensure that developments do take place and it is<br />
therefore our opinion that this should not present a significant issue.<br />
Government Legislation<br />
DML has submitted the Environmental Impact Assessment for public comment and has<br />
applied for the mining licence but this has not yet been approved. However, given the strong<br />
pro-mining focus of the authorities we do not believe that this is a major risk.<br />
Clearly there are some regulatory risks from changes to royalty rates, taxation, etc.<br />
However, the current royalty rates are globally competitive and the taxation includes a profit<br />
share based on individual mine level profitability. We thus view any increases in either of<br />
these parameters as relatively low risk.<br />
Botswana does have the right to an equity participation in any mining development.<br />
However, this right is for a direct equity contribution by the Government, it is funded by<br />
<strong>Goldman</strong> <strong>Sachs</strong> & Partners Australia<br />
Investment <strong>Research</strong><br />
All figures in A$ unless otherwise advised 21
7 October 2010 <strong>Discovery</strong> <strong>Metals</strong> <strong>Limited</strong><br />
Government (not through any future cash flow, etc.) and could thus justifiably be considered<br />
as almost advantageous for DML.<br />
Funding<br />
DML has yet to complete the funding package for Boseto and, in our view, is looking to too<br />
large a debt component. That said, in the current investment climate we do not envisage any<br />
material difficulty in raising the majority of the required funding package from the equity<br />
markets.<br />
We further note that a significant negative to debt funding is the inevitable requirement to<br />
institute a large hedge programme and the lack of access to cash flows once production<br />
commences due to the ring-fencing of cash flow until debt closure is made, thus inhibiting<br />
the ability to conduct an aggressive (or limited) exploration programme at the same time.<br />
Single-Commodity, Single-Mine Company Risk<br />
As with all companies moving from explorer to producer status, DML has single-mine risks.<br />
We see the risks to DML as no greater than the other companies in our coverage universe<br />
that have successfully transitioned. In our view, the board and management have the<br />
necessary skill set for this transition and there is a history of mining in Botswana which<br />
provides further comfort on the overall skills required for this development.<br />
Operational Risks<br />
We see the greatest risk as the actual unit cost of moving rock. Given the high strip ratio of<br />
15.9:1, this can materially impact the mining cost on a per-tonne-of-ore-treated basis. That<br />
said, given the nature of the orebody and the ability to be treated as a strip mine with waste<br />
removal ahead of mining being dumped into the mined-out area, the cost of waste transport<br />
is likely to be low and there is no need to build a waste dump as such.<br />
Power<br />
Botswana is a net importer of electric power and, as such, DML is proposing to use a dieselfired<br />
power plant for the operation replaced in later years by a dedicated coal-fired power<br />
plant. Whilst DML is able to access grid power, the lack of reliability of the grid power is<br />
being addressed by the use of diesel power and the costs assume diesel power generation.<br />
HIV<br />
The country has an estimated adult HIV prevalence of 24.6%, the second highest in the<br />
world after Swaziland. The impact from this epidemic has been a shortening in the life<br />
expectancy estimated by the United Nations Agency for adults from 65 years (in 2000) to<br />
less than 40 years (current).<br />
The obvious impact of this high level of AIDS infection is the loss of skilled workers and the<br />
costs to both individuals and companies from providing appropriate levels of medical care.<br />
Board of Directors and Senior Management<br />
Chairman: GORDON GALT (Date of Appointment 9 May 2007)<br />
• Gordon Galt is a senior mineral resources executive and an experienced director with<br />
international mineral industry experience.<br />
• In recent years Mr Galt has held the following listed company directorships:<br />
−<br />
−<br />
Aquila Resources <strong>Limited</strong> from August 2007 to present<br />
Navigator Resources <strong>Limited</strong> from August 2008 to present<br />
− Gloucester Coal <strong>Limited</strong> from April 2004 to August 2007<br />
− Magnesium International <strong>Limited</strong> from August 2002 to January 2006<br />
CEO: STUART BRADLEY SAMPSON (Date of Appointment 1 February 2008)<br />
• Brad Sampson has over 20 years Australian and International experience as a mining<br />
engineer. He has worked extensively in open cut and underground mine operations and<br />
developments in Southern Africa, Australia and the Pacific.<br />
Non-Executive Director: MORRICE CORDINER (Date of Appointment 30 May 2003)<br />
• Mr Cordiner is a corporate lawyer by training and has in excess of 15 years' experience<br />
in the finance and resources industries.<br />
<strong>Goldman</strong> <strong>Sachs</strong> & Partners Australia<br />
Investment <strong>Research</strong><br />
All figures in A$ unless otherwise advised 22
7 October 2010 <strong>Discovery</strong> <strong>Metals</strong> <strong>Limited</strong><br />
• Mr Cordiner is also currently a non-executive director of the ASX and TSX dual-listed<br />
gold explorer, Andean Resources <strong>Limited</strong> (Dec 2003 to present) and the ASX-listed zinc<br />
explorer, Meridian Minerals <strong>Limited</strong> (July 2008 to present).<br />
Non-Executive Director: JOHN SHAW (Date of Appointment 14 November 2006)<br />
• John Shaw has over 40 years experience in exploration, development and operations of<br />
open cut and underground mines. He was previously Vice President of the Australian<br />
Operations of Placer Dome Asia Pacific <strong>Limited</strong> and Managing Director of Kidston Gold<br />
Mines. In recent years he has held the following listed company directorships:<br />
−<br />
IAMGOLD Corporation from March 2006 to present<br />
− Albidon <strong>Limited</strong> from February 2008 to April 2009<br />
− Tri Origin Minerals <strong>Limited</strong> from October 2003 to February 2008<br />
− Lodestone Exploration <strong>Limited</strong> from May 2002 to November 2007<br />
− Gallery Gold <strong>Limited</strong> from November 2003 to March 2006<br />
− Kingsgate Consolidated <strong>Limited</strong> from September 2000 to March 2005<br />
Non-Executive Director: JEREMY READ (Date of Appointment 1 February 2008)<br />
• Jeremy Read has 22 years' domestic and international minerals exploration experience<br />
and was previously the Manager of BHP Minerals Australian Exploration Team. He has<br />
extensive exploration experience for gold, nickel sulphides and base metals. He was the<br />
founding Managing Director of <strong>Discovery</strong> <strong>Metals</strong> from its incorporation in May 2003 until<br />
his appointment as a non-executive director on 1 February 2008.<br />
Non-Executive Director: RIBSON GABONOWE (Date of Appointment 30 May 2008)<br />
• Ribson Gabonowe is a well known Mining Engineer with over 25 years' experience in the<br />
mining industry. For twelve years to Dec 2006, he was the Director of Mines of<br />
Botswana, responsible for administering the legal and fiscal framework governing<br />
mineral exploitation. During the past five years he held directorships in the following<br />
companies:<br />
−<br />
−<br />
−<br />
Morupule Colliery (Pty) Ltd<br />
Botswana Diamond Valuing Company (Pty) Ltd<br />
BCL <strong>Limited</strong> (Pty) Ltd<br />
• Mr Gabonowe is currently a director of Kukama Mining and Exploration, African Coal<br />
(Pty) Ltd, Atlas Minerals (Pty) Ltd and Gabor Consulting (Pty) Ltd. He is also the director<br />
of all <strong>Discovery</strong> <strong>Metals</strong> subsidiaries registered in Botswana.<br />
CFO: PAUL FULTON<br />
• Paul Fulton is a highly experienced CFO who has more than 35 years' experience in<br />
broad commercial management, accounting and Chief Financial Officer roles within the<br />
resource industry.<br />
<strong>Goldman</strong> <strong>Sachs</strong> & Partners Australia<br />
Investment <strong>Research</strong><br />
All figures in A$ unless otherwise advised 23
7 October 2010 <strong>Discovery</strong> <strong>Metals</strong> <strong>Limited</strong><br />
Financial Summary | DML<br />
<strong>Discovery</strong> <strong>Metals</strong> <strong>Limited</strong><br />
Current Price A$: $1.29 Mkt Cap. :<br />
$355m<br />
GS&PA DCF: $0.91 ASX Code:<br />
DML<br />
Industry: Materials T/O (mth):<br />
$43m<br />
Free Float 95%<br />
Recommendation:<br />
Price Target:<br />
Analyst:<br />
Data as at:<br />
HOLD<br />
$1.50<br />
Ian Preston<br />
7-Oct-10<br />
Investments Statistics Profit & Loss (A$m)<br />
Year end June 2010a 2011e 2012e 2013e 2014e Year end June 2010a 2011e 2012e 2013e 2014e<br />
Net Profit (Reported) (A$m) -5 -10 19 136 148 Sales Revenue 0 0 63 420 445<br />
- EPS (Reported) 1 (¢) -2.0 -3.6 6.9 50.4 54.7 Operating costs 5 11 39 175 181<br />
- PER (Reported) 1 (X) -63.1 -35.9 18.6 2.5 2.3 Operating EBITDA -5 -11 24 245 264<br />
NET PROFIT (Adj.) 2 (A$m) -5 -10 19 136 148 D&A 0 0 4 27 29<br />
- EPS (Adj.) 2 (¢) -2.0 -3.6 6.9 50.4 54.7 Operating EBIT -5 -11 19 218 236<br />
- EPS Growth (%) -62 77 -293 629 8<br />
- PER (Adj.) 2 (X) n.a n.a 18.6 2.5 2.3 EBIT -5 -11 19 218 236<br />
Dividend (¢) 0.0 0.0 0.0 0.0 8.0 Boseto 0 0 27 221 237<br />
- Yield (%) 0.0% 0.0% 0.0% 0.0% 6.2% Other -5 -11 -8 -3 -2<br />
- Franking (%) 0% 0% 0% 0% 0% Net Interest Exp./(Rev) -1 -1 -12 -24 -31<br />
Free Cash Flow (A$m) -16 -13 11 199 135 PreTax Profit (pre ab's) -5 -10 32 242 267<br />
- P/FCF 4 (X) -18.8 -26.2 31.7 1.7 2.6 Tax Expense (pre abs) 0 0 13 106 119<br />
EV(Adj.)/EBITDA 3 (X) -48.7 -33.0 20.8 1.1 0.5 OEI 0 0 0 0 0<br />
Avg. Shares (diluted) (mill) 229 270 270 270 270 NET PROFIT (Pre NRI's)1 -5 -10 19 136 148<br />
Abnormal Items (after Tax) 0 0 0 0 0<br />
EV Analysis / DCF Valuation Reported NPAT (post ab's) -5 -10 19 136 148<br />
A$ DCF Valuation: 0.91 Upside: 1.20 Sales Growth (%) -100% 567% 6%<br />
Price / DCF: 1.41 Op. EBITDA Growth (%) N/A N/A N/A 933% 8%<br />
Ke: 14.3% WACC: 11.7% NPAT (Adj.) Growth (%) N/A N/A N/A 629% 8%<br />
Kd: 5.1% RF : 6.5% EPS (Adj.) Growth (%) 629 8<br />
BETA: 1.30 MRP: 6.0% Op.EBITDA Margin (%) 37.7% 58.4% 59.4%<br />
Interest Cover - EBI (X) 7.8 8.4 -1.9 -10.0 -8.4<br />
Year end June 2010a 2011e 2012e 2013e 2014e Return on Equity 5 (%) -6% -15% 23% 62% 39%<br />
EV (Adj.) 3 (A$m) 255 363 494 271 136 Cash Flow Analysis (A$m)<br />
EV (Adj.) / EBITDA (X) -48.7 -33.0 20.8 1.1 0.5 Year end June 2010a 2011e 2012e 2013e 2014e<br />
EV (Adj.) / Sales (X) 7.8 0.6 0.3 Operating EBITDA -5 -11 24 245 264<br />
EV (Adj.) / Gross C F (X) -49.9 -40.3 19.2 1.1 0.5 change in working cap. 0 2 2 2 2<br />
Gross Cashflow -5 -9 26 247 266<br />
Balance Sheet (A$m) Net Interest Paid 1 0 -11 -12 -5<br />
Year end June 2010a 2011e 2012e 2013e 2014e Tax Paid (inc. abs) 0 0 0 -27 -116<br />
C ash 39 14 14 237 372 Exploration -11 -5 -2 -2 -2<br />
Property, Plant, Equip 35 38 38 38 38 Operating Cash Flow -15 -13 12 207 143<br />
Other Assets 0 0 0 0 0 Maintenance C apex 0 0 -1 -8 -8<br />
Debt 0 30 161 161 161 FREE CASH FLOW -16 -13 11 199 135<br />
Shareholders Equity 74 64 83 220 378 Dividends Paid 0 0 0 0 -11<br />
NET Debt/EBITDA (%) 751% -141% 617% -31% -80% Expansionary C apex -1 -43 -166 -12 -26<br />
Net Debt / Equity (%) -53% 24% 176% -35% -56% Acquisitions 0 0 0 0 0<br />
Net Debt / (D+E) (%) -113% 19% 64% -53% -127% Asset Sales 1 0 0 0 0<br />
Dividends Received/Other. 2 0 0 0 0<br />
Annual Production Share Issues/Repurchases 44 0 0 0 0<br />
Year end June 2010a 2011e 2012e 2013e 2014e Increase in Net Cash/(Debt 30 -56 -155 187 98<br />
C opper kt 0.0 0.0 6.0 37.5 37.8 Gross CF / Op. EBITDA (X) 0.97 0.82 1.08 1.01 1.01<br />
Silver mozs 0.0 0.0 0.2 1.3 1.3 Maint. C apex / Sales (%) 2.3% 1.8% 1.9%<br />
Total C apex / Sales (%) 2.3% 1.8% 1.9%<br />
Maint. C apex / D&A (X) 1.93 0.34 0.28 0.29<br />
Total C apex / D&A (X) 11.58 39.14 0.72 1.19<br />
Maint. C apex / GC F (%) -3.5% 0.0% 5.7% 3.1% 3.1%<br />
Cash Costs<br />
ROE Analy sis<br />
Year end June 2010a 2011e 2012e 2013e 2014e Year end June 2010a 2011e 2012e 2013e 2014e<br />
Boseto US¢/lb 0 0 171 139 139<br />
EBIT/Sales (X) n.a n.a n.a 0.52 0.53<br />
Pretax Profit/EBIT (X) 0.87 0.88 1.64 1.11 1.13<br />
Sales/Assets (X) 0.00 0.00 1.21 1.53 1.09<br />
Assets/Equity (X) 1.01 0.81 0.63 1.25 1.08<br />
Return on Equity (RO (%) -6% -15% 23% 62% 39%<br />
Commodity Prices<br />
Year Average to June 2010a 2011e 2012e 2013e 2014e<br />
C urrency A$/US$ 0.89 0.86 0.83 0.80 0.77 ROCE WACC Analysis<br />
C opper (LME) US$/lb 304 342 380 400 405 Year end June 2010a 2011e 2012e 2013e 2014e<br />
Silver Price US$/oz 16.88 18.42 18.56 18.94 19.32 Adjusted NOPAT (A$m) -5 -10 19 136 148<br />
Adj C ap employed (A$m) 28 57 155 186 155<br />
ROC E (%) NM NM 12.1% 73.2% 95.4%<br />
WAC C (%) 10.5% 10.5% 10.5% 10.5% 10.5%<br />
ROCE Spread (abs) 1.6% 62.7% 85.0%<br />
Sensitiity Analysis C hange in ROC E (abs) 61.1% 22.3%<br />
Year End Dec 2010a 2011e 2012e 2013e 2014e<br />
C urrency +1¢ n.a n.a n.a -2.1 -2.4<br />
C opper US5¢/lb n.a n.a n.a 2.5 2.4<br />
(1) Net Profit - Adjusted is after share based<br />
(2) Net Profit (Adj.) is before goodwill amortisation, abnormals<br />
(3) EV Includes 100% of Mkt. Value of minorities<br />
(4) Includes 100% of Mkt. Value of minorities and excludes Invest./Assoc.<br />
(5) ROE excludes Source: Company data, IRESS, GS&PA <strong>Research</strong> estimates<br />
<strong>Goldman</strong> <strong>Sachs</strong> & Partners Australia Base/Precious <strong>Metals</strong> Team:<br />
Analyst: Ian Preston Base/Precious <strong>Metals</strong> ian.preston@gs.com.au +61 3 9679 1453<br />
Analyst: Paul Hissey Base/Precious <strong>Metals</strong> paul.hissey@gs.com.au +61 3 9679 1779<br />
Associate Analyst: Brett Cottrell Base/Precious <strong>Metals</strong> brett.cottrell@gs.com.au +61 3 9679 1565<br />
<strong>Goldman</strong> <strong>Sachs</strong> & Partners Australia<br />
Investment <strong>Research</strong><br />
All figures in A$ unless otherwise advised 24
7 October 2010 <strong>Discovery</strong> <strong>Metals</strong> <strong>Limited</strong><br />
I, Ian Preston, hereby certify that all of the views expressed in this report accurately reflect my personal views about the<br />
subject company or companies and its or their securities. I also certify that no part of my compensation was, is, or will<br />
be, directly or indirectly, related to specific recommendations or views expressed in this report.<br />
<strong>Goldman</strong> <strong>Sachs</strong> & Partners Australia<br />
Investment <strong>Research</strong><br />
All figures in A$ unless otherwise advised 25
Disclosures of Interest<br />
Important Notice - Aus:<br />
Australia - <strong>Research</strong> Important Notice<br />
Company Specific Regulatory Disclosures<br />
See company-specific regulatory disclosures for any of the following disclosures required as to companies referred to in the report: manager or co<br />
manager in a pending transaction; financial advisor in a strategic corporate transaction; 1% or other ownership; compensation for certain services;<br />
types of client relationships; managed/co-managed public offerings in prior periods; directorships; market making and/or specialist role.<br />
The following are additional required disclosures: Ownership and Material Conflicts of Interest: <strong>Goldman</strong> <strong>Sachs</strong> & Partners Australia Pty Ltd ("<strong>Goldman</strong><br />
<strong>Sachs</strong> & Partners Australia") policy prohibits its analysts, assistant analysts and their respective associates owning securities of any company in the<br />
analyst's area of coverage. Analyst compensation: Analysts are paid in part based on the profitability of <strong>Goldman</strong> <strong>Sachs</strong> & Partners Australia, which<br />
includes corporate advisory and financing revenues. Distribution of recommendations: See the distribution of recommendations disclosure on the<br />
following page.<br />
Compendium Report<br />
Please see disclosures at http://www.gs.com.au/Disclosures. Disclosures applicable to companies included in this compendium report can be found in<br />
the latest relevant published research.<br />
Global Product; Distributing Entities<br />
This report has been prepared by the <strong>Goldman</strong> <strong>Sachs</strong> & Partners Australia Investment <strong>Research</strong> Division for distribution to clients of affiliates of<br />
<strong>Goldman</strong> <strong>Sachs</strong> & Partners Australia and pursuant to certain contractual arrangements to clients of affiliates of The <strong>Goldman</strong> <strong>Sachs</strong> Group, Inc.<br />
(Group) (Collectively, Group and its affiliates, "GS").<br />
Group owns 45% of the ordinary shares of <strong>Goldman</strong> <strong>Sachs</strong> & Partners Australia Group Holdings Pty Ltd, the ultimate holding company of <strong>Goldman</strong><br />
<strong>Sachs</strong> & Partners Australia. <strong>Research</strong> views, investment opinions and recommendations published by <strong>Goldman</strong> <strong>Sachs</strong> & Partners Australia are<br />
developed independently from those published by the <strong>Goldman</strong> <strong>Sachs</strong> Global Investment <strong>Research</strong> Division.<br />
This research is disseminated in Australia by <strong>Goldman</strong> <strong>Sachs</strong> & Partners Australia Pty Ltd (ABN 21 006 797 897); in Canada by <strong>Goldman</strong> <strong>Sachs</strong><br />
Canada Inc. regarding Canadian equities and by <strong>Goldman</strong> <strong>Sachs</strong> & Co. (all other research); in Germany by <strong>Goldman</strong> <strong>Sachs</strong> & Co. oHG; in Hong Kong<br />
by <strong>Goldman</strong> <strong>Sachs</strong> (Asia) L.L.C.; in India by <strong>Goldman</strong> <strong>Sachs</strong> (India) Securities Private Ltd.; in Japan by <strong>Goldman</strong> <strong>Sachs</strong> Japan Co., Ltd.; in the<br />
Republic of Korea by <strong>Goldman</strong> <strong>Sachs</strong> (Asia) L.L.C., Seoul Branch; in New Zealand by <strong>Goldman</strong> <strong>Sachs</strong> & Partners New Zealand <strong>Limited</strong>; in Singapore<br />
by <strong>Goldman</strong> <strong>Sachs</strong> (Singapore) Pte. (Company Number: 198602165W); and in the United States of America by <strong>Goldman</strong>, <strong>Sachs</strong> & Co. <strong>Goldman</strong><br />
<strong>Sachs</strong> International has approved this research in connection with its distribution in the United Kingdom and European Union. Persons who would be<br />
categorized as private customers in the United Kingdom, as such term is defined in the rules of the Financial Services Authority, should read this<br />
material in conjunction with the last published reports on the companies mentioned herein and should refer to the risk warnings that have been sent<br />
to them by <strong>Goldman</strong> <strong>Sachs</strong> International. A copy of these risk warnings is available from the offices of <strong>Goldman</strong> <strong>Sachs</strong> International on request.<br />
Unless governing law permits otherwise, you must contact a <strong>Goldman</strong> <strong>Sachs</strong> entity in your home jurisdiction if you want to use <strong>Goldman</strong> <strong>Sachs</strong> &<br />
Partners Australia's or GS's services in effecting a transaction in the securities mentioned in this material.<br />
European Union: <strong>Goldman</strong> <strong>Sachs</strong> International, authorised and regulated by the Financial Services Authority, has approved this research in<br />
connection with its distribution in the European Union and United Kingdom; <strong>Goldman</strong>, <strong>Sachs</strong> & Co. oHG, regulated by the Bundesanstalt fuer<br />
Finanzdienstleistungsaufsicht, may also be distributing research in Germany.<br />
General Disclosures<br />
This research is for clients only, as stated above. Other than disclosures relating to <strong>Goldman</strong> <strong>Sachs</strong> & Partners Australia this research is based on<br />
current public information that we consider reliable, but we do not represent it is accurate or complete, and it should not be relied on as such. We<br />
seek to update our research as appropriate, but various regulations may prevent us from doing so. Other than some industry reports published on a<br />
periodic basis, the large majority of reports are published at irregular intervals as appropriate in the analyst's judgment.<br />
<strong>Goldman</strong> <strong>Sachs</strong> & Partners Australia and/or its affiliates conduct a global full-service, integrated corporate advisory and financing, investment<br />
management, and brokerage business. We have corporate advisory, corporate finance and other business relationships with a substantial percentage<br />
of the companies covered by our Investment <strong>Research</strong> Division.<br />
Our salespeople, traders, and other professionals may provide oral or written market commentary or trading strategies to our clients and our<br />
proprietary trading desks that reflect opinions that are contrary to the opinions expressed in this research. Our asset management area, our<br />
proprietary trading desks and investing businesses may make investment decisions that are inconsistent with the recommendations or views<br />
expressed in this research.<br />
<strong>Goldman</strong> <strong>Sachs</strong> & Partners Australia and our affiliates, officers, directors, and employees, excluding equity analysts, will from time to time have long<br />
or short positions in, act as principal in, and buy or sell, the securities or derivatives (including options and warrants) thereof of covered companies<br />
referred to in this research.<br />
This research is not an offer to sell or the solicitation of an offer to buy any security in any jurisdiction where such an offer or solicitation would be<br />
illegal. It does not constitute a personal recommendation or take into account the particular investment objectives, financial situations, or needs of<br />
individual clients. Clients should consider whether any advice or recommendation in this research is suitable for their particular circumstances and, if<br />
appropriate, seek professional advice, including tax advice. The price and value of the investments referred to in this research and the income from<br />
them may fluctuate. Past performance is not a guide to future performance, future returns are not guaranteed, and a loss of original capital may<br />
occur. Certain transactions, including those involving futures, options, and other derivatives, give rise to substantial risk and are not suitable for all<br />
investors.<br />
In producing research reports, members of <strong>Goldman</strong> <strong>Sachs</strong> & Partners Australia Investment <strong>Research</strong> may attend site visits and other meetings<br />
hosted by the issuers the subject of its research reports. In some instances the costs of such site visits or meetings may be met in part or in whole by<br />
the issuers concerned if <strong>Goldman</strong> <strong>Sachs</strong> & Partners Australia considers it is appropriate and reasonable in the specific circumstances relating to the<br />
site visit or meeting.<br />
Our research is disseminated primarily electronically, and, in some cases, in printed form. Electronic research is simultaneously available to all clients.<br />
Disclosure information is also available at http://www.gs.com.au/Disclosures or from <strong>Research</strong> Compliance, Level 42, 1 Farrer Place Sydney NSW<br />
2000.<br />
Investment Adviser & Broker Disclosure Statement<br />
The disclosure statement for <strong>Goldman</strong> <strong>Sachs</strong> & Partners New Zealand <strong>Limited</strong> and your adviser is available on request and free of charge. Please<br />
contact your adviser to obtain a copy.<br />
<strong>Research</strong> Analyst Certification<br />
Each equity and strategy research report excerpted herein was certified under Reg AC by the analyst primarily responsible for such report as follows:<br />
I, , hereby certify that all of the views expressed in this report accurately reflect my personal views about the subject company or<br />
companies and its or their securities. I also certify that no part of my compensation was, is, or will be, directly or indirectly, related to the specific<br />
recommendations or views expressed in this report.<br />
Copyright 2010 <strong>Goldman</strong> <strong>Sachs</strong> & Partners Australia Pty Ltd ABN 21 006 797 897 AFSL 243346
No part of this material may be (i) copied, photocopied or duplicated in any form by any means or (ii) redistributed without the prior written consent<br />
of <strong>Goldman</strong> <strong>Sachs</strong> & Partners Australia.<br />
<strong>Goldman</strong> <strong>Sachs</strong> is a registered trade mark of <strong>Goldman</strong>, <strong>Sachs</strong> & Co.
Australia - <strong>Research</strong> Recommendation Definitions<br />
Sell (S)<br />
Hold (H)<br />
Buy (B)<br />
Other Definitions<br />
NR<br />
CS<br />
NC<br />
Stock is expected to underperform the S&P/ASX 200 for 12 months<br />
Stock is expected to perform in line with the S&P/ASX 200 for 12 months<br />
Stock is expected to outperform the S&P/ASX 200 for 12 months<br />
Not Rated. The investment rating has been suspended temporarily. Such suspension is in compliance with<br />
applicable regulations and/or <strong>Goldman</strong> <strong>Sachs</strong> & Partners Australia Pty Ltd (“GS&PA”) policies in circumstances<br />
when GS&PA and/or, our New Zealand affiliate, <strong>Goldman</strong> <strong>Sachs</strong> & Partners New Zealand <strong>Limited</strong> (“GS&PNZ”) is<br />
acting in an advisory capacity in a merger or strategic transaction involving the company and in certain other<br />
situations<br />
Coverage Suspended. GS&PA has suspended coverage of this company.<br />
Not Covered. GS&PA does not cover this company.<br />
Target Price<br />
Analysts set share price targets for individual companies based on a 12 month horizon. These share price targets are subject to a range of company<br />
specific and market risks. Target prices are based on a methodology chosen by the analyst as the best predictor of the share price over the 12<br />
month horizon.<br />
<strong>Research</strong> Criteria Definitions<br />
The above recommendations are primarily determined with reference to the recommendation criteria outlined below. Analysts can introduce other<br />
factors when determining their recommendation, with any material factors stated in the written research where appropriate. Each criterion is clearly<br />
defined for the research team to ensure consistent consideration of the relevant criteria in an appropriate manner.<br />
Industry Structure:<br />
EVA Trend: 1<br />
Earnings Momentum:<br />
Catalysts:<br />
Price/Valuation:<br />
Based on GS&PA industry structure ranking. All industries relevant to the Australian equity market are ranked,<br />
based on a combination of Porter’s Five Forces of industry structure as well as an industry's growth potential,<br />
relevant regulatory risk and probable technological risk. A company’s specific ranking is based on the proportion<br />
of funds employed in particular industry segments, aggregated to determine an overall company rating, adjusted<br />
to reflect a view of the quality of a company’s management team.<br />
EVA trend forecast for coming 2 years. Designed to reflect “turnaround stories” or to highlight companies<br />
GS&PA analysts believe will allocate capital poorly in the estimated timeframe.<br />
The percentage change in the current consensus EPS estimate for the stock (year 1) over the consensus EPS<br />
estimate for the stock 3 months ago. Stocks are rated according to their relative rank, effectively making it a<br />
market relative measure.<br />
A qualitative and quantitative assessment of a company's long term catalysts that the analyst believes should be<br />
considered and possibly recognised by the market.<br />
The premium or discount to base case DCF valuation at which the stock is trading relative to the average<br />
premium or discount across the market.<br />
For Insurers<br />
ROE Trend: ROE is used as a proxy for EVA. Rating takes into account the expected level and trend of ROE over the next 2<br />
years.<br />
Balance Sheet:<br />
Analyst’s assessment of the quality and strength of the insurer’s balance sheet, including conservatism of<br />
provisioning, sufficiency of capital, and quality of capital.<br />
For REITs<br />
Strategy:<br />
EPU Growth:<br />
Yield:<br />
For NZ Companies<br />
Relevant Index:<br />
Used instead of industry structure as many REIT investors are intra rather than inter sector focussed.<br />
Ranking of Earnings Per Unit growth relative to other listed Real Estate Investment Trusts. Used instead of EVA<br />
Trend.<br />
Yield relative to the REIT sector average. Used instead of Earnings Momentum.<br />
If a research report is published by our New Zealand affiliate, GS&PNZ, the recommendation of a company or<br />
trust is based on their performance relative to the NZSX 50 Index (Gross) and not the S&P/ASX 200 Index.<br />
1 EVA is a registered trademark of the U.S. consultancy firm Stern Stewart<br />
Distribution of Recommendations – as at 30 September 2010<br />
Recommendation Overall Corporate relationship* in last 12 months<br />
Sell 7% 0%<br />
Hold 57% 58%<br />
Buy 36% 42%<br />
* No direct linkage with overall distribution as the latter relates to the full GS&PA/GS&PNZ coverage (>250 companies). The above table combines<br />
the corporate relationships and recommendations of both GS&PA and GS&PNZ.<br />
© 2010 <strong>Goldman</strong> <strong>Sachs</strong> & Partners Australia Pty Ltd – ABN 21 006 797 897, AFSL 243346