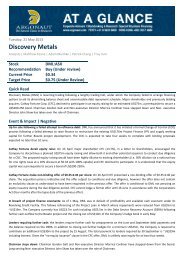
Goldman Sachs Investor Research - Discovery Metals Limited
Goldman Sachs Investor Research - Discovery Metals Limited
Goldman Sachs Investor Research - Discovery Metals Limited

You also want an ePaper? Increase the reach of your titles
YUMPU automatically turns print PDFs into web optimized ePapers that Google loves.
Australia - <strong>Research</strong> Recommendation Definitions<br />
Sell (S)<br />
Hold (H)<br />
Buy (B)<br />
Other Definitions<br />
NR<br />
CS<br />
NC<br />
Stock is expected to underperform the S&P/ASX 200 for 12 months<br />
Stock is expected to perform in line with the S&P/ASX 200 for 12 months<br />
Stock is expected to outperform the S&P/ASX 200 for 12 months<br />
Not Rated. The investment rating has been suspended temporarily. Such suspension is in compliance with<br />
applicable regulations and/or <strong>Goldman</strong> <strong>Sachs</strong> & Partners Australia Pty Ltd (“GS&PA”) policies in circumstances<br />
when GS&PA and/or, our New Zealand affiliate, <strong>Goldman</strong> <strong>Sachs</strong> & Partners New Zealand <strong>Limited</strong> (“GS&PNZ”) is<br />
acting in an advisory capacity in a merger or strategic transaction involving the company and in certain other<br />
situations<br />
Coverage Suspended. GS&PA has suspended coverage of this company.<br />
Not Covered. GS&PA does not cover this company.<br />
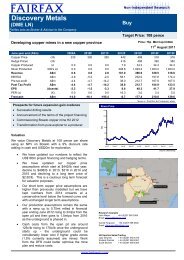
Target Price<br />
Analysts set share price targets for individual companies based on a 12 month horizon. These share price targets are subject to a range of company<br />
specific and market risks. Target prices are based on a methodology chosen by the analyst as the best predictor of the share price over the 12<br />
month horizon.<br />
<strong>Research</strong> Criteria Definitions<br />
The above recommendations are primarily determined with reference to the recommendation criteria outlined below. Analysts can introduce other<br />
factors when determining their recommendation, with any material factors stated in the written research where appropriate. Each criterion is clearly<br />
defined for the research team to ensure consistent consideration of the relevant criteria in an appropriate manner.<br />
Industry Structure:<br />
EVA Trend: 1<br />
Earnings Momentum:<br />
Catalysts:<br />
Price/Valuation:<br />
Based on GS&PA industry structure ranking. All industries relevant to the Australian equity market are ranked,<br />
based on a combination of Porter’s Five Forces of industry structure as well as an industry's growth potential,<br />
relevant regulatory risk and probable technological risk. A company’s specific ranking is based on the proportion<br />
of funds employed in particular industry segments, aggregated to determine an overall company rating, adjusted<br />
to reflect a view of the quality of a company’s management team.<br />
EVA trend forecast for coming 2 years. Designed to reflect “turnaround stories” or to highlight companies<br />
GS&PA analysts believe will allocate capital poorly in the estimated timeframe.<br />
The percentage change in the current consensus EPS estimate for the stock (year 1) over the consensus EPS<br />
estimate for the stock 3 months ago. Stocks are rated according to their relative rank, effectively making it a<br />
market relative measure.<br />
A qualitative and quantitative assessment of a company's long term catalysts that the analyst believes should be<br />
considered and possibly recognised by the market.<br />
The premium or discount to base case DCF valuation at which the stock is trading relative to the average<br />
premium or discount across the market.<br />
For Insurers<br />
ROE Trend: ROE is used as a proxy for EVA. Rating takes into account the expected level and trend of ROE over the next 2<br />
years.<br />
Balance Sheet:<br />
Analyst’s assessment of the quality and strength of the insurer’s balance sheet, including conservatism of<br />
provisioning, sufficiency of capital, and quality of capital.<br />
For REITs<br />
Strategy:<br />
EPU Growth:<br />
Yield:<br />
For NZ Companies<br />
Relevant Index:<br />
Used instead of industry structure as many REIT investors are intra rather than inter sector focussed.<br />
Ranking of Earnings Per Unit growth relative to other listed Real Estate Investment Trusts. Used instead of EVA<br />
Trend.<br />
Yield relative to the REIT sector average. Used instead of Earnings Momentum.<br />
If a research report is published by our New Zealand affiliate, GS&PNZ, the recommendation of a company or<br />
trust is based on their performance relative to the NZSX 50 Index (Gross) and not the S&P/ASX 200 Index.<br />
1 EVA is a registered trademark of the U.S. consultancy firm Stern Stewart<br />
Distribution of Recommendations – as at 30 September 2010<br />
Recommendation Overall Corporate relationship* in last 12 months<br />
Sell 7% 0%<br />
Hold 57% 58%<br />
Buy 36% 42%<br />
* No direct linkage with overall distribution as the latter relates to the full GS&PA/GS&PNZ coverage (>250 companies). The above table combines<br />
the corporate relationships and recommendations of both GS&PA and GS&PNZ.<br />
© 2010 <strong>Goldman</strong> <strong>Sachs</strong> & Partners Australia Pty Ltd – ABN 21 006 797 897, AFSL 243346