Goldman Sachs Investor Research - Discovery Metals Limited
Goldman Sachs Investor Research - Discovery Metals Limited
Goldman Sachs Investor Research - Discovery Metals Limited

Create successful ePaper yourself
Turn your PDF publications into a flip-book with our unique Google optimized e-Paper software.
7 October 2010 <strong>Discovery</strong> <strong>Metals</strong> <strong>Limited</strong><br />
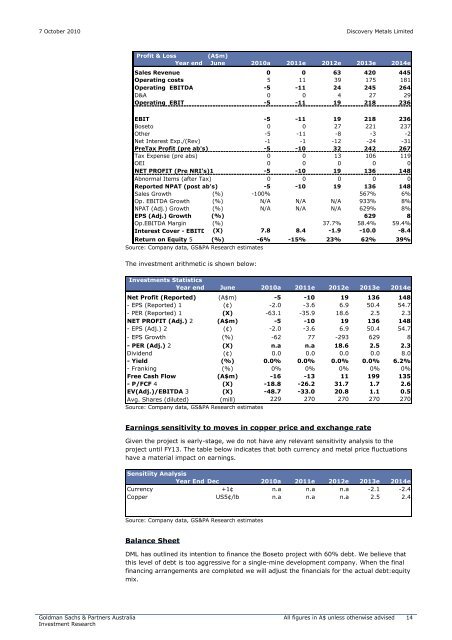
Profit & Loss<br />
(A$m)<br />
Year end June 2010a 2011e 2012e 2013e 2014e<br />
Sales Revenue 0 0 63 420 445<br />
Operating costs 5 11 39 175 181<br />
Operating EBITDA -5 -11 24 245 264<br />
D&A 0 0 4 27 29<br />
Operating EBIT -5 -11 19 218 236<br />
EBIT -5 -11 19 218 236<br />
Boseto 0 0 27 221 237<br />
Other -5 -11 -8 -3 -2<br />
Net Interest Exp./(Rev) -1 -1 -12 -24 -31<br />
PreTax Profit (pre ab's) -5 -10 32 242 267<br />
Tax Expense (pre abs) 0 0 13 106 119<br />
OEI 0 0 0 0 0<br />
NET PROFIT (Pre NRI's)1 -5 -10 19 136 148<br />
Abnormal Items (after Tax) 0 0 0 0 0<br />
Reported NPAT (post ab's) -5 -10 19 136 148<br />
Sales Growth (%) -100% 567% 6%<br />
Op. EBITDA Growth (%) N/A N/A N/A 933% 8%<br />
NPAT (Adj.) Growth (%) N/A N/A N/A 629% 8%<br />
EPS (Adj.) Growth (%) 629 8<br />
Op.EBITDA Margin (%) 37.7% 58.4% 59.4%<br />
Interest Cover - EBITD (X) 7.8 8.4 -1.9 -10.0 -8.4<br />
Return on Equity 5 (%) -6% -15% 23% 62% 39%<br />
Source: Company data, GS&PA <strong>Research</strong> estimates<br />
The investment arithmetic is shown below:<br />
Investments Statistics<br />
Year end June 2010a 2011e 2012e 2013e 2014e<br />
Net Profit (Reported) (A$m) -5 -10 19 136 148<br />
- EPS (Reported) 1 (¢) -2.0 -3.6 6.9 50.4 54.7<br />
- PER (Reported) 1 (X) -63.1 -35.9 18.6 2.5 2.3<br />
NET PROFIT (Adj.) 2 (A$m) -5 -10 19 136 148<br />
- EPS (Adj.) 2 (¢) -2.0 -3.6 6.9 50.4 54.7<br />
- EPS Growth (%) -62 77 -293 629 8<br />
- PER (Adj.) 2 (X) n.a n.a 18.6 2.5 2.3<br />
Dividend (¢) 0.0 0.0 0.0 0.0 8.0<br />
- Yield (%) 0.0% 0.0% 0.0% 0.0% 6.2%<br />
- Franking (%) 0% 0% 0% 0% 0%<br />
Free Cash Flow (A$m) -16 -13 11 199 135<br />
- P/FCF 4 (X) -18.8 -26.2 31.7 1.7 2.6<br />
EV(Adj.)/EBITDA 3 (X) -48.7 -33.0 20.8 1.1 0.5<br />
Avg. Shares (diluted) (mill) 229 270 270 270 270<br />
Source: Company data, GS&PA <strong>Research</strong> estimates<br />
Earnings sensitivity to moves in copper price and exchange rate<br />
Given the project is early-stage, we do not have any relevant sensitivity analysis to the<br />
project until FY13. The table below indicates that both currency and metal price fluctuations<br />
have a material impact on earnings.<br />
Sensitiity Analysis<br />
Year End Dec 2010a 2011e 2012e 2013e 2014e<br />
Currency +1¢ n.a n.a n.a -2.1 -2.4<br />
Copper US5¢/lb n.a n.a n.a 2.5 2.4<br />
Source: Company data, GS&PA <strong>Research</strong> estimates<br />
Balance Sheet<br />
DML has outlined its intention to finance the Boseto project with 60% debt. We believe that<br />
this level of debt is too aggressive for a single-mine development company. When the final<br />
financing arrangements are completed we will adjust the financials for the actual debt:equity<br />
mix.<br />
<strong>Goldman</strong> <strong>Sachs</strong> & Partners Australia<br />
Investment <strong>Research</strong><br />
All figures in A$ unless otherwise advised 14