Nanoporous Gold Electrocatalysis for Ethylene Monitoring ... - CID, Inc.
Nanoporous Gold Electrocatalysis for Ethylene Monitoring ... - CID, Inc.
Nanoporous Gold Electrocatalysis for Ethylene Monitoring ... - CID, Inc.

You also want an ePaper? Increase the reach of your titles
YUMPU automatically turns print PDFs into web optimized ePapers that Google loves.
Europ.J.Hort.Sci., 73 (4). S. 171–176, 2008, ISSN 1611-4426. © Verlag Eugen Ulmer KG, Stuttgart<br />
<strong>Nanoporous</strong> <strong>Gold</strong> <strong>Electrocatalysis</strong> <strong>for</strong> <strong>Ethylene</strong> <strong>Monitoring</strong> and<br />
Control<br />
R. Shekarriz and W. L. Allen<br />
(Fluid Analytics, <strong>Inc</strong>., Lake Oswego, Oregon, USA)<br />
Summary<br />
Maintaining the quality and freshness of fruit and vegetables<br />
during transportation and storage is an important<br />
role <strong>for</strong> most postharvest industries. One way to<br />
control freshness is by carefully monitoring and regulating<br />
exposure to ethylene. By limiting exposure to<br />
ethylene the natural aging process of fresh produce is<br />
slowed down, thus prolonging its shelf life. This is especially<br />
important <strong>for</strong> organic produce where the use<br />
of chemicals <strong>for</strong> decay control is not practiced. In this<br />
paper, the per<strong>for</strong>mance characteristics and method of<br />
use of a new sensing approach <strong>for</strong> postharvest ethylene<br />
measurements is introduced. In this sensor,<br />
ETH-1010, oxidation of ethylene on a gold electrocatalyst<br />
produces a highly detectable and measurable amperometric<br />
signal. ETH-1010 has been packaged into a<br />
complete field portable unit. It continuously samples<br />
the air at a set flow rate, (commonly between 200 and<br />
500 ml min –1 ), and reports the ethylene concentration<br />
in air at a user-specified time interval. The direct contact<br />
between the ethylene molecules in air and electrocatalytic<br />
surface renders this process more sensitive<br />
and responsive than conventional diffusion-type electrochemical<br />
cells. This approach has been shown to be<br />
quite effective <strong>for</strong> continuous monitoring of cold storage<br />
rooms, where detection of lower than 10 ppm<br />
down to 10 ppb is desirable. This configuration was<br />
also used to examine the applicability of electrocatalysis<br />
<strong>for</strong> scrubbing ethylene. Results <strong>for</strong> ethylene removal<br />
have been presented in this paper where the surface<br />
reactivity on the electrocatalyst is typically between<br />
0.1 and 0.2 µmol h –1 cm –2 . In the sensor, the high reaction<br />
rate provides high sensitivity and response<br />
time, while making it feasible to consider using electrocatalysis<br />
in a scrubbing mode <strong>for</strong> future applications.<br />
Key words. electrocatalysis – amperometric – nanoporous gold – fruit maturity – ethylene ripening – methylcyclopropene<br />
– cold storage – controlled atmosphere<br />
Introduction<br />
Preservation of perishables such as fresh fruit and vegetables<br />
(FF & V) can be quite challenging due to the substantial<br />
amount of refrigeration required to prevent<br />
spoilage. In the case of FF & V, the air recirculated in the<br />
cold rooms can quickly become contaminated with ethylene<br />
gas produced by ripening fruit and vegetables.<br />
This can then lead to autocatalytic ripening of FF & V<br />
and accelerated spoilage even at ideal refrigeration temperatures.<br />
This issue is becoming progressively more<br />
critical <strong>for</strong> global trade and year round consumption of<br />
FF & V. Un<strong>for</strong>tunately, postharvest losses in developing<br />
countries account <strong>for</strong> greater than 25 % of the total<br />
fresh produce. <strong>Ethylene</strong>-related problems make up a significant<br />
portion of these losses and lead to negative economic<br />
impacts in billions of dollars every year<br />
(http://www.ars.usda.gov/research/projects/projects.htm).<br />
These losses affect growers, packers, storage houses, and<br />
distributors of FF & V. Furthermore, as the population of<br />
people living in impoverished countries continue to<br />
climb above 750 million, it is hard to ignore such enormous<br />
losses in fresh produce without running the risk of<br />
greater food security issues.<br />
In general, ethylene-related problems are caused when<br />
high ethylene producing FF & V are placed in a storage area<br />
with highly ethylene sensitive FF & V. For example, avocados<br />
and apples are known to produce extremely high ethylene<br />
levels, even at temperatures below 4 °C. On the other<br />
hand, kiwifruit is not a high ethylene producer, but is extremely<br />
sensitive to the presence of ethylene. Kiwi should<br />
not be stored with commodities that produce significant<br />
amounts (ARPAIA et al. 1985). As little as 5–10 ppb ethylene<br />
in the storage atmosphere can accelerate softening of<br />
kiwifruit without impacting other ripening processes. The<br />
result is unripe fruit that are excessively soft (CRISOSTO et<br />
al. 1999). Carrots produce very low ethylene at<br />
172 Shekarriz and L. Allen: <strong>Nanoporous</strong> <strong>Gold</strong> <strong>Electrocatalysis</strong> <strong>for</strong> <strong>Ethylene</strong> <strong>Monitoring</strong><br />
While long term storage of fruit and vegetables results<br />
in eventual ripening due to production and release of ethylene,<br />
monitoring of ethylene is currently not a widely<br />
adopted process in many packing houses and cold storage<br />
facilities. This is attributable to limited sensitivity and accuracy<br />
of current sensors. At or below 1 ppm detectors<br />
with sufficient sensitivity are too large and too expensive<br />
<strong>for</strong> most end-users to af<strong>for</strong>d. Localization of more rapidly<br />
ripening fruit and sources of ethylene is challenged by the<br />
high cost and inconvenience in detection. Such localization<br />
could provide strategies to minimize ethylene production<br />
and to control spoilage and rapid ripening process.<br />
Another application of the ETH-1010 ethylene sensor<br />
is <strong>for</strong> the determination of fruit maturity at harvest. This<br />
application plays a major role in determining storability,<br />
marketability, transportability, and general quality of<br />
climacteric fruit (SHEKARRIZ 2007; BLANKE 2008). A<br />
number of parameters are currently used to evaluate the<br />
maturity index of fruits and vegetables at harvest<br />
(http://www.hortresearch.co.nz/index/page/442). Examples<br />
of indices currently used <strong>for</strong> determining the commercial<br />
maturity are background skin colour, starch pattern<br />
index, and firmness. While physiological maturity determined<br />
from internal ethylene concentration (IEC) does<br />
not seem to correlate well with commercial maturity indices,<br />
it is a good indicator of storability and transportability<br />
of fruit (http://www.hortnet.co.nz/publications/science/m/mills/apple.htm).<br />
There<strong>for</strong>e, harvest and postharvest<br />
storage and distribution decisions are more frequently<br />
based on internal ethylene concentration measurements,<br />
in addition to using the traditional indicators.<br />
Currently internal ethylene levels are measured by expert<br />
users taking a gas sample from an apple (intrusively using<br />
a core sampler or non-intrusively by collecting the ethylene<br />
outgas of the fruit) and running the sample through a<br />
laboratory gas chromatography (GC) system. This process<br />
is time consuming and expensive, limiting the number of<br />
growers and users that could benefit from this in<strong>for</strong>mation.<br />
The US Department of Agriculture (USDA) and university<br />
agricultural extension centres play a major role in<br />
introducing and implementing more efficient and<br />
up-to-date practices into the current quality control (QC)<br />
culture within the postharvest industry in the US. The following<br />
sections provide more details on the method and<br />
device <strong>for</strong> rapid and cost-effective ethylene concentration<br />
measurement during postharvest applications.<br />
catalytic metals such as platinum, palladium, nickel, cobalt,<br />
etc. have been shown to have interesting catalytic<br />
properties as nanoparticles, but these metals are already<br />
recognized heterogeneous catalysts (THOMPSON 1999).<br />
<strong>Gold</strong> in a nanoparticulate state, however, provides a new<br />
area of catalysis research, sometimes known as the “New<br />
<strong>Gold</strong> Rush.”<br />
Typically, a heterogeneous catalyst consists of a small<br />
amount of metal deposited on the surface of a metal oxide.<br />
Metal oxides such as alumina, ceria, zirconia, ferric oxide,<br />
titanium dioxide, and mixtures of metal oxides provide a<br />
support <strong>for</strong> the catalytic metal. They also provide a<br />
source/sink <strong>for</strong> oxygen in oxidation reactions. To be a catalyst,<br />
the dispersed metal must first adsorb both reactants<br />
and not significantly attract the products. This mechanism<br />
provides the pathway <strong>for</strong> bringing reactant molecules together<br />
to facilitate the reaction. Interestingly, nanoporous<br />
gold plated on a number of metal oxide substrates has attracted<br />
much attention <strong>for</strong> the catalytic oxidation of many<br />
small molecule and carbon-containing compounds. This is<br />
an important property <strong>for</strong> our consideration in that ethylene<br />
and other small molecules are attracted and adsorbed<br />
to the nanoparticle gold (GOTTFRIED 2003). This makes<br />
them ideal targets <strong>for</strong> electrochemical oxidation using our<br />
nanoparticle gold electrode cell. The successful oxidation<br />
of ethylene, propylene, ethylene glycol, <strong>for</strong>maldehyde,<br />
acetaldehyde, <strong>for</strong>mic acid and carbon monoxide with air<br />
or oxygen has been reported (BURKE and NUGENT 1998).<br />
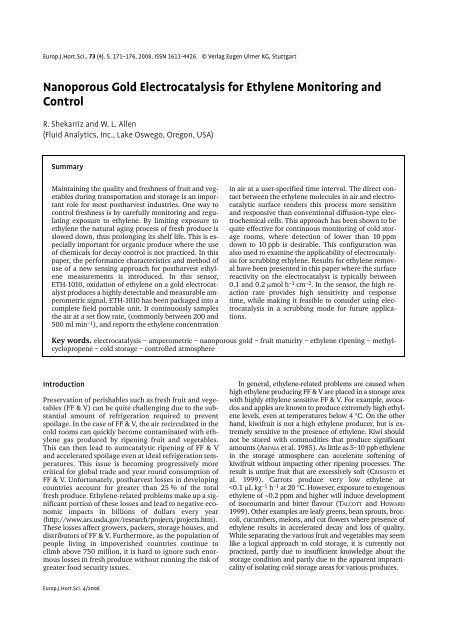
Electrocatalytic Cell and Its Operation<br />
The oxidation of ethylene contained in the sampled air<br />
flowing over a nanoporous gold anode, also known as a<br />
Working Electrode, provides a cell current that can be<br />
measured and used <strong>for</strong> the determination of ethylene<br />
concentrations in this sample (Fig. 1). In the present electrocatalytic<br />
cell, the gold working electrode provides<br />
electrical contact through a water and proton permeable<br />
Nafion® membrane, to the liquid chamber containing<br />
electrolyte, and counter- and reference- electrodes. Water<br />
that penetrates the Nafion membrane and wicks onto the<br />
gold surface is activated by the cell potential where it becomes<br />
the oxidizing agent <strong>for</strong> ethylene.<br />
For sensing, the cell potential is maintained at 1.16 V<br />
vs. standard hydrogen electrode (SHE). Under this condi-<br />
Materials and Methods<br />
The Electrocatalyst<br />
C2H4 + Air Flow<br />
Sensing Electrode (Anode):<br />
<strong>Nanoporous</strong> <strong>Gold</strong><br />
Solid Polymer Electrolyte: Nafion<br />
At the heart of this device is a nanoporous gold electrocatalytic<br />
surface that is the primary sensing element. The<br />
basis <strong>for</strong> sensing by electrocatalytic oxidation of various<br />
analytes on gold is presented in other publications<br />
(SCHMIDT and PASTOR 1994; BURKE and NUGENT 1998). In<br />
this approach, the nano-particulate gold surface is active<br />
in adsorbing the analyte, e.g., ethylene molecules. Although<br />
gold is considered to be a noble and extremely<br />
unreactive metal, numerous reports in recent years show<br />
that atomic gold clusters ranging in size from 2 to 20 nm<br />
are highly active as heterogeneous catalysts in a number<br />
of chemical reactions (SANCHEZ et al. 1999; CORTIE and<br />
VAN DER LINGEN 2002; ASTRUC et al. 2005). Other typical<br />
Counter<br />
Electrode<br />
(Cathode)<br />
Electrolyte Solution:<br />
Reference<br />
0.05 M H 2 SO 4<br />
Electrode<br />
Potentiostat<br />
Fig. 1. Electrocatalytic reaction of ethylene on nanoporous<br />
gold catalyst.<br />
Europ.J.Hort.Sci. 4/2008
Shekarriz and L. Allen: <strong>Nanoporous</strong> <strong>Gold</strong> <strong>Electrocatalysis</strong> <strong>for</strong> <strong>Ethylene</strong> <strong>Monitoring</strong> 173<br />
Fig. 3. Recirculating mode setup <strong>for</strong> electrocatalytic reaction<br />
rate determination. Different size containers are used in<br />
this study.<br />
The test setup consisted of an electrocatalytic decomposition<br />
cell, an ethylene sensing cell, and sources of ethylene<br />
and nitrogen, as shown in Fig. 3. A flow mixing system,<br />
with closed-loop control, created mixtures of ethylene<br />
and nitrogen at precise concentrations. The rate of reaction<br />
was determined from the drop in the ethylene concentration<br />
in the container.<br />
Results and Discussion<br />
Fig. 2. The test apparatus design is aimed <strong>for</strong> easy operation<br />
and minimizing error in mixed gas.<br />
tion, the gold electrode is stable and indirectly participates<br />
in the ethylene oxidation as an electrocatalyst. In<br />
many respects this sensing approach resembles a standard<br />
polymer electrolyte membrane (PEM) fuel cell in<br />
which the chemical energy from reaction of ethylene and<br />
water is converted to electrical energy in <strong>for</strong>m of electron<br />
<strong>for</strong>mation and generation of current between the cathode<br />
and anode.<br />
Sensing Test Apparatus<br />
To test the device per<strong>for</strong>mance, an experimental apparatus<br />
was assembled as shown in Fig. 2. Two gas standards,<br />
nitrogen and ethylene, were brought into contact at different<br />
ratios using precision Aalborg mass flow controllers<br />
(www.aalborg.com). The concentration of ethylene<br />
was controlled between 10 ppb to 10 ppm to within ±5%<br />
<strong>for</strong> these studies. The flow rate through the cell was maintained<br />
at 200±5 mlmin –1 <strong>for</strong> all the tests. The electronics<br />
<strong>for</strong> these measurements were developed internally, including<br />
the potentiostat <strong>for</strong> controlling the biased voltage<br />
while accurately measuring the current at the counter-electrode<br />
to within ±10 nA.<br />
Reaction Rate Test Apparatus<br />
Not all <strong>Gold</strong> is Created Equal<br />
The sensor response or sensitivity is the combined effect<br />
of analyte mass transfer, adsorption on active gold sites,<br />
oxidation reaction with water, and ion migration to counter-electrodes.<br />
Because of the serial nature of these processes,<br />
any one of them can result in signal suppression,<br />
which means a lower percentage of all molecules flowing<br />
over the electrocatalytic surface participate in producing<br />
a signal. Extensive laboratory studies show that efficient<br />
synthesis of the gold catalyst combined with proper sensing<br />
cell design play equally important roles in producing<br />
a robust and high sensitivity sensor (GILBUENA et al. 2007;<br />
BLANKE 2008). Our gold electrocatalysts are synthesized<br />
using a proprietary approach involving chemical reaction<br />
and precipitation of pure gold on the surface of a polymer<br />
electrolyte membrane, namely Nafion®. The catalyst<br />
microstructural and morphological properties are affected<br />
by parameters such as gold loading, starting solution<br />
chemistry, and synthesis thermophysical conditions.<br />
Scanning electron microscope (SEM) images of a typical<br />
gold electrocatalyst is shown in Fig. 4. These images<br />
clearly demonstrate the presence of multiple length<br />
scales to yield high per<strong>for</strong>mance, namely, nanoscale features<br />
provide high surface area <strong>for</strong> adsorption and reaction<br />
while micro- and meso-porous networks result in<br />
high mass transfer rates.<br />
In average, gold loadings of 7.7mgcm –2 were measured<br />
<strong>for</strong> gold deposits on the membrane with exposed dimensions<br />
of less than 10 cm 2 . While all electrocatalysts<br />
were synthesized using similar gold loading, other conditions<br />
during synthesis affected the catalyst surface area and<br />
consequently in electrocatalytic response. Sensitivities<br />
ranged between 5 and 15 µA ppm –1 when exposed to<br />
10 ppm standards and moderate flow rates of 500 ml min –1 .<br />
Europ.J.Hort.Sci. 4/2008
174 Shekarriz and L. Allen: <strong>Nanoporous</strong> <strong>Gold</strong> <strong>Electrocatalysis</strong> <strong>for</strong> <strong>Ethylene</strong> <strong>Monitoring</strong><br />
Fig. 4. Scanning electron<br />
microscope (SEM) images<br />
of nanoporous gold used<br />
as an electrocatalyst in the<br />
current sensing approach.<br />
The two images are at<br />
magnifications of 20,000x<br />
(left) and 100,000x (right)<br />
revealing features smaller<br />
than 10 nm.<br />
Relative Sensitivity<br />
1<br />
0.8<br />
0.6<br />
0.4<br />
0.2<br />
Response, µA<br />
140<br />
120<br />
100<br />
80<br />
60<br />
40<br />
Raw Data<br />
Corrected Data<br />
Linear (Raw Data)<br />
Linear (Corrected Data)<br />
y = 12.283x + 3.4<br />
R 2 = 0.9998<br />
0<br />
0.00 0.20 0.40 0.60 0.80 1.00<br />
Fig. 5. Sensitivity or sensor response versus apparent surface<br />
area of catalyst.<br />
In general, the relationship between the surface area of<br />
the catalyst and the sensitivity or sensor response followed<br />
a monotonic relationship as shown in Fig. 5.<br />
Standard Gas Measurements<br />
A critical characteristic of a sensing device is whether or<br />
not it responds linearly over the desired operating range.<br />
Nonlinear response demands multiple-point calibration<br />
and the number of points required is a function of degree<br />
of departure from linearity. As shown in Fig. 6, the current<br />
electrocatalytic cell provides extremely linear response<br />
revealed by the trendline equations, extending to<br />
concentrations well above 100 ppm. The two graphs<br />
shown represent the raw data and the corrected data.<br />
Correction only removes the background leakage current,<br />
which shows up as a bias current in the data. Note<br />
that this particular electrocatalyst showed a response of<br />
12.179 µA ppm –1 . Using the linearity property of our<br />
electrocatalytic sensor, which is typical of first order catalytic<br />
reactions, only two points are required <strong>for</strong> calibration<br />
of the device, zero and the maximum expected concentration,<br />
say 100 ppm. For better accuracy, the maximum<br />
point <strong>for</strong> calibration is selected to match the expected<br />
range of measurements, say 1 ppm <strong>for</strong> 0 to 1 ppm<br />
measurements.<br />
Reaction Rate<br />
Normalized Surface Area<br />
20<br />
y = 12.179x<br />
R 2 = 0.9998<br />
0<br />
0.01 0.1 1 1 0<br />
Fig. 6. Sensor linearity at low ethylene concentrations of below<br />
10 ppm. The linear curves on a logarithmic scale provide<br />
an expanded view of small concentrations while they have<br />
exponential manifestations as shown above.<br />
Efficient electrocatalytic reaction is a critical part of the<br />
sensor. Fig. 7 shows two consecutive injections of ethylene<br />
directly into the device (see Fig. 3) such that the concentration<br />
was raised to approximately 100 ppb <strong>for</strong> each<br />
trial. By recirculating air over the electrocatalyst, the concentration<br />
of ethylene was allowed to drop through electrocatalytic<br />
decomposition. In this particular experiment,<br />
the consecutive data points were collected every 3 s, and<br />
each trial took roughly 4 min to bring the ethylene concentration<br />
to near zero. The 1/e characteristic time constant<br />
or the time it took <strong>for</strong> ethylene concentration to<br />
drop below 40 ppb was in average 1 min. Note that once<br />
a sample was injected into the device, it took between 5<br />
and 10 s <strong>for</strong> the maximum concentration to be realized.<br />
The insert in this plot shows a magnified region of the<br />
data over a 1 min period, where the pulse-to-pulse signal<br />
fluctuation is ±5 ppb, but the 10 s average shows lower<br />
fluctuation in the results. Clearly, <strong>for</strong> very rapidly changing<br />
signal, <strong>for</strong> example near the peak shown in Fig. 7,<br />
time averaging will truncate the data. However, most real<br />
systems in postharvest applications will not undergo rapid<br />
changes in concentration and averages over 1 min<br />
should be more than adequate <strong>for</strong> signal processing and<br />
data interpretation.<br />
When sampling the air in a closed system, both ethylene<br />
generation and destruction may be taking place simultaneously,<br />
and the total ethylene present in the system<br />
will vary according to the following equation:<br />
∀ e,s<br />
∫<br />
t<br />
= [ ∀·<br />
g,s<br />
( t’ ) – ∀·<br />
d,s ( t’ )]dt’<br />
( 1)<br />
o<br />
Concentration, ppm<br />
Europ.J.Hort.Sci. 4/2008
Shekarriz and L. Allen: <strong>Nanoporous</strong> <strong>Gold</strong> <strong>Electrocatalysis</strong> <strong>for</strong> <strong>Ethylene</strong> <strong>Monitoring</strong> 175<br />
0.15<br />
12-second Average<br />
0.05<br />
0.04<br />
5.00<br />
Concentration, ppm<br />
3-second realiz ation<br />
0.03<br />
0.10<br />
0.01<br />
0.00<br />
0.05<br />
0.00<br />
0 2 4 6 8<br />
-0.05<br />
Time, mi n<br />
0.02<br />
3.0 3.2 3.4 3.6 3.8 4.0<br />
ETH-1010 Reading [ppm ]<br />
4.00<br />
3.00<br />
2.00<br />
1.00<br />
Fig. 7. <strong>Ethylene</strong> depletion within the dead space volume<br />
(20 mL) of Alpha Prototype.<br />
Normalized Concentration<br />
1<br />
EC Only<br />
Scrubber+EC<br />
Expon. (Scrubber+EC)<br />
y = 0.9886e -0.0032x<br />
R 2 = 0.9975<br />
y = 0.9691e -0.0291x<br />
R 2 = 0.9991<br />
Expon. (EC Only)<br />
0.1<br />
0 20 40 60 80 100<br />
Time, min<br />
Fig. 8. Depletion rate measurements in a 4 L container with<br />
(solid symbols) and without a potassium permanganate<br />
scrubber (open symbols).<br />
In the above equation ∀·g,s is the rate of generation of<br />
ethylene by the fruit or vegetables, ∀·d,s is the rate of<br />
scrubbing or destruction say by the electrocatalytic cell,<br />
∀ e,s is the volume of ethylene, and t denotes time. In a<br />
warehouse or cold storage facility full of apples, the generation<br />
rate may be quite large. In the other hand, a cold<br />
storage facility containing kiwifruit would have little to<br />
no indigenous source of ethylene other than the amount<br />
that permeates through the walls and doors, or by infiltration<br />
through ventilation system. In our model, only initial<br />
ethylene levels were considered <strong>for</strong> the purpose of<br />
sampling the air (i.e., the generation rate during sampling<br />
is negligible). In that case, the mathematical model<br />
is simplified to what is shown below:<br />
C s<br />
() t ⁄ C o<br />
= ( 1–<br />
e – t ⁄ τ ) ( 2)<br />
C s is the concentration at time t and C o is the initial<br />
concentration. In the above equation τ is the characteristic<br />
system time constant, and it is defined by the interaction<br />
of the system parameters, α(catalyst rate constant in<br />
µA ppm –1 cm –2 ), A (catalyst exposed surface area in<br />
cm 2 ), and ∀ s (system volume in litre) as shown below:<br />
∀<br />
τ = ---------------------------------------------------------------- s<br />
1.16x10 – 4<br />
( 3)<br />
⋅ α ⋅ A<br />
As evident from the above equation, smaller system<br />
volume or higher catalyst rate constant and surface area<br />
lead to faster reaction rates. This characteristic time constant<br />
is independent of the initial concentration, signifying<br />
that the percentage drop in concentration is always<br />
the same as shown in Equation (2). Referring back to<br />
0.00<br />
0.00 1.00 2.00 3.00 4.00 5.00<br />
Fig. 9. Comparison of ETH-1010 measurements against gas<br />
chromatography <strong>for</strong> off-gassing of pears in RA chambers.<br />
Concentration, ppm<br />
2.00<br />
1.00<br />
0.00<br />
Conventional Apple 1<br />
Conventional Apple 2<br />
Organic Apple 1<br />
Organic Apple 2<br />
GC Reading [ppm]<br />
9.5 µl kg -1 h -1<br />
0 2 4 6 8 10<br />
Time, min<br />
1.9 µl kg -1 h -1<br />
Fig. 10. Continuous sampling from a jar containing a single<br />
apple. The organic apples appeared to generate more than<br />
9 µl kg –1 h –1 ) of ethylene, or close to 5 times more ethylene<br />
than the conventional apples, possibly because they were<br />
treated with ethylene inhibitors.<br />
Fig. 7, where the decay time constant was approximately<br />
1 min <strong>for</strong> a system volume of approximately 20 ml, the<br />
catalyst rate constant works out to be around<br />
0.3 µA ppm –1 cm –2 (or roughly 0.11 µmol hr –1 cm –2 ). For<br />
monitoring ethylene levels in a large storage room, such<br />
as a typical CA room, the rate of reaction of ethylene in<br />
the sensor can be ignored since the number of ethylene<br />
molecules reacted is significantly smaller than the total<br />
number of molecules present in the room. However, sampling<br />
smaller volumes may lead to a change in concentration<br />
caused by electrocatalytic measurement. In the current<br />
sensor configuration, the drop in concentration from<br />
one measurement point to the next, in the absence of ethylene<br />
generation, is simply the ratio of dead volume in<br />
the sensor to the total volume of room from which a sample<br />
is taken. Further discussion on this topic is provided<br />
in the following section in relation to Fig. 8.<br />
Application <strong>for</strong> Scrubbing Rate <strong>Monitoring</strong><br />
The experimental results shown in Fig. 8 are <strong>for</strong> an experiment<br />
in which a container of approximately 4 L was used.<br />
The 200 ml min –1 flow was directed through a beta prototype<br />
sensor <strong>for</strong> 30 s followed by similar flow through a po-<br />
Europ.J.Hort.Sci. 4/2008
176 Shekarriz and L. Allen: <strong>Nanoporous</strong> <strong>Gold</strong> <strong>Electrocatalysis</strong> <strong>for</strong> <strong>Ethylene</strong> <strong>Monitoring</strong><br />
tassium permanganate scrubber <strong>for</strong> 35 s, a total of<br />
1.083 min cycle. This process continued <strong>for</strong> over 100 min<br />
and a data point was taken after each cycle. By injecting a<br />
10,000 ppm gas sample into the container, the initial concentration<br />
was brought up to approximately 1 ppm and<br />
was allowed to be scrubbed out while monitoring this process<br />
with the sensor. This is evident in the slope of the two<br />
curves. While the time constant <strong>for</strong> the electrocatalytic<br />
scrubbing was linked to Equation (3), the potassium permanganate<br />
scrubber time constant, which is approximately<br />
34 min, was related to the ratio of container volume<br />
(4 L) to the flow rate of air directed through the scrubber<br />
during each cycle (200 ml min –1 <strong>for</strong> 35 s). Clearly, the<br />
electrocatalytic depletion rate is roughly 10 % of that <strong>for</strong><br />
potassium permanganate scrubber, which is 100 %.<br />
Application in Apple and Pear Chamber Measurements<br />
Tests were per<strong>for</strong>med with various apples and pears kept in<br />
RA and CA chambers. These tests were carried out in collaboration<br />
with Dr. Jinhe Bai at the Oregon State University<br />
Experiment Station in Hood River, Oregon and Dr. Jim Mattheis<br />
at USDA-ARS in Wenatchee, Washington. For testing<br />
of pears, 18 different RA chambers were each filled with 10<br />
pears. The air from each chamber was recirculated through<br />
our sensor while a small sample was simultaneously run<br />
through a GC. The data was then plotted <strong>for</strong> comparison as<br />
shown in Fig. 9. The very low ethylene producing pears<br />
were treated with 1-methylcyclopropene, which is an ethylene<br />
blocker. The agreement is quite good even at very<br />
low concentrations of significantly smaller than 0.5 ppm.<br />
Another set of tests were per<strong>for</strong>med <strong>for</strong> measuring the<br />
rate of ethylene production, which appears to be an important<br />
parameter <strong>for</strong> postharvest fruit quality characterization.<br />
By measuring the rate of ethylene production <strong>for</strong><br />
various apples, one can determine the physiological maturity<br />
of fruit. This “real-time” in<strong>for</strong>mation permits the<br />
grower to make instant decisions regarding timing the<br />
harvest as well as deciding on whether or not the fruit is<br />
storable or needs to be sold quickly. In these experiments,<br />
after placing a single apple in a sealed jar, the jar was connected<br />
to the sensor to measure the rate of ethylene build<br />
up inside the jar. Fig. 10 shows the results of our measurements<br />
<strong>for</strong> two different types of ‘Fuji’ apples, namely, organic<br />
vs. conventional. The results produce a very unambiguous<br />
measure of the ethylene production rate in each<br />
case, by simply using the slope of the curve at any point<br />
as a measure of the ethylene production rate.<br />
Conclusions<br />
In this paper, a new electrocatalytic sensor was presented<br />
where both sensitivity and response time was shown to be<br />
significantly better than standard diffusion-type electrochemical<br />
sensors. The oxidation reaction of the ethylene<br />
molecules on the surface of the nanoporous catalyst was<br />
shown to take place quite efficiently, typically between 0.1<br />
and 0.2 µmol h –1 cm –2 . This high reactivity yields response<br />
time of better than 10 s and a sensitivity that provides the capability<br />
to measure ethylene down to 10 ppb using the current<br />
electrocatalyst configuration. Future developments<br />
could potentially provide even higher sensitivity and possibly<br />
better response times than those reported in this paper.<br />
The linearity of the sensor response provides a simple calibration<br />
operation that only requires a single point calibration<br />
at the expected range of measurement. The utility and<br />
use of this device was shown <strong>for</strong> monitoring ethylene levels<br />
during pear storage, monitoring scrubbing of ethylene in<br />
storage, and <strong>for</strong> determining the ethylene production rate of<br />
apples (or other fruit) as needed <strong>for</strong> quality control in postharvest<br />
processes.<br />
Acknowledgements<br />
Financial contribution was made by the Small Business<br />
Innovation Research program of the US Department of<br />
Agriculture under two grants: 2004-33610-14425 and<br />
2005-33610-16464. Financial assistance was also provided<br />
by the Washington Tree Fruit Research Commission,<br />
and the Pacific Northwest National Laboratory (PNNL).<br />
The author would like to acknowledge the technical support<br />
from Dr. Larry Pederson from PNNL and Dr. Jinhe<br />
Bai from OSU Experiment Station <strong>for</strong> their support in this<br />
project. The authors would also like to thank Dr. Michael<br />
Blanke from the University of Bonn and Dr. Ralph Gäbler<br />
from Invivo, GmbH <strong>for</strong> their constructive comments and<br />
<strong>for</strong> testing the beta prototypes.<br />
References<br />
ARPAIA, M.L., F.G. MITCHELL, A.A. KADER and G. MAYER 1985:<br />
Effects of 2 % O 2 and varying concentrations of CO 2 with<br />
or without C 2 H 4 on the storage per<strong>for</strong>mance of kiwifruit.<br />
Amer. J. Hort. Sci. 110, 200–203.<br />
ASTRUC, D., F. LU and J. R. ARANZAES 2005: Nanoparticles as<br />
recyclable catalysts: The Frontier between Homogeneous<br />
and Heterogeneous Catalysis. Angew. Chem. Int. Ed. 44,<br />
7852–7872.<br />
BLANKE, M. 2008: A Portable High Resolution <strong>Ethylene</strong> Detector<br />
Based on New Sensor Technology. Erwerbs-Obstbau<br />
BURKE, L.D. and P.F. NUGENT 1998: The Electrochemistry of<br />
<strong>Gold</strong>: II The Electrocatalytic Behaviour of the Metal in<br />
Aqueous Media. <strong>Gold</strong> Bulletin, 31(2), 39–50.<br />
CORTIE, M.B. and E. VAN DER LINGEN 2002: Catalytic <strong>Gold</strong> Nano-Particles.<br />
Materials Forum 26, 1–14.<br />
CRISOSTO, C.H., E.J. MITCHAM and A.A. KADER 1999: Kiwifruit<br />
In: Fresh produce facts, Univ. of Cali<strong>for</strong>nia. HTTP://POST-<br />
HARVEST.UCDAVIS.EDU/PRODUCE/PRODUCE-<br />
FACTS/FRUIT/KIWI/HTML.<br />
GILBUENA, D.M., D.J. FAULKNER, C.M. WARD, W.L. ALLEN and R.<br />
SHEKARRIZ 2007: <strong>Ethylene</strong> Sensor <strong>for</strong> Postharvest Applications.<br />
In: Final Report, SBIR Grant Number USDA<br />
2005-33610-16464, Submitted to Dr. William <strong>Gold</strong>ner, CS-<br />
REES, Washington, D.C.<br />
GOTTFRIED, J. M. 2003: CO Oxidation over <strong>Gold</strong> Adsorption<br />
and Reaction of Oxygen, Carbon Monoxide, and Carbon Dioxide<br />
on an Au(110)-(1×2) Surface. In Ph.D. Dissertation,<br />
FU Berlin. http://www.diss.fu-berlin.de/2003/133/indexe.html.<br />
SANCHEZ, A. 1999: When gold is not noble: Nanoscale <strong>Gold</strong><br />
Catalysts,” J. Phis. Cham. A, 103, 9573–9578.<br />
SCHMIDT, V.M. and E. PASTOR 1994: Adsorption and oxidation<br />
of acetylene and ethylene on gold electrodes. J. Electrochem.<br />
Soc. 376, 65–72.<br />
SHEKARRIZ, R. 2007: A high sensitivity continuous ethylene<br />
monitoring device <strong>for</strong> postharvest applications. Proc. Fla.<br />
State Hort. Soc. 120, 251–255.<br />
TALCOTT, S.T. and L.R. HOWARD 1999: Determination and distribution<br />
of 6-methoxymellein in fresh and processed carrot<br />
puree by a rapid spectrophotometric assay. J. Agric. Food<br />
Chem. 47, 3237–3242.<br />
THOMPSON, D. 1999: New Advanced in <strong>Gold</strong> Catalysis - Part<br />
II. <strong>Gold</strong> Bulletin, 32(1), 12–19.<br />
Received March 18, 2008 / Accepted June 19, 2008<br />
Addresses of authors: Reza Shekarriz and W. Lloyd Allen, Fluid<br />
Analytics, <strong>Inc</strong>., 17488 Mardee Ave., Lake Oswego, OR 97035,<br />
USA, e-mail: reza@fluid-analytics.com.<br />
Europ.J.Hort.Sci. 4/2008