EAP046 - Computer Analysis of Hemispherical Digital Images ...
EAP046 - Computer Analysis of Hemispherical Digital Images ...
EAP046 - Computer Analysis of Hemispherical Digital Images ...

You also want an ePaper? Increase the reach of your titles
YUMPU automatically turns print PDFs into web optimized ePapers that Google loves.
Washington State Department <strong>of</strong> Ecology<br />
Environmental Assessment Program<br />
Standard Operating Procedures for the computer analysis <strong>of</strong> hemispherical digital images collected as<br />
part <strong>of</strong> a temperature Total Maximum Daily Load (TMDL) or Forests and Fish Unit technical study.<br />
Version 2.2<br />
Author – A. Stohr<br />
Date – 5/06/2008<br />
Editor – Tighe Stuart<br />
Date – 1/17/2014<br />
Original Reviewers - James Kardouni, Jack Janisch<br />
Date – 4/21/2008<br />
QA Approval - William R. Kammin, Ecology Quality Assurance Officer<br />
Date – 1/22/2014<br />
<strong>EAP046</strong><br />
Approved Date: 1/22/2014<br />
Signatures on File
Please note that the Washington State Department <strong>of</strong> Ecology’s Standard Operating Procedures<br />
(SOPs) are adapted from published methods, or developed by in-house technical and administrative<br />
experts. Their primary purpose is for internal Ecology use, although sampling and administrative<br />
SOPs may have a wider utility. Our SOPs do not supplant <strong>of</strong>ficial published methods. Distribution <strong>of</strong><br />
these SOPs does not constitute an endorsement <strong>of</strong> a particular procedure or method.<br />
Any reference to specific equipment, manufacturer, or supplies is for descriptive purposes only<br />
and does not constitute an endorsement <strong>of</strong> a particular product or service by the author or by<br />
the Department <strong>of</strong> Ecology.<br />
Although Ecology follows the SOP in most instances, there may be instances in which Ecology uses an<br />
alternative methodology, procedure, or process.<br />
X:\EA PROGRAM\ECYEAPSOP\Approved SOPs\ECY_EAP_SOP_<strong>Hemispherical</strong>_Photography_<strong>Computer</strong>_<strong>Analysis</strong>_v2_1<strong>EAP046</strong>_.doc_1/22/2014_Page 2
SOP Revision History<br />
Revision Date Rev Summary <strong>of</strong> changes Sections Reviser(s)<br />
number<br />
11/3/03 1 First draft <strong>of</strong> SOP all D. Bilhimer<br />
2/26/2007 1.2 Incorporated internal comments all D. Bilhimer<br />
4/2/2008 2.0 Extensive changes. Incorporated all A. Stohr<br />
Forests and Fish unit methods. Added<br />
site file management section.<br />
Extensively updated technical methods<br />
5/06/2008 2.1 Minor changes. Incorporated Jack and all A. Stohr<br />
James comments from version 2.0 draft<br />
1/17/2014 2.2 Clarified methods that the TMDL staff<br />
use to calculate effective shade from<br />
Hemiview s<strong>of</strong>tware<br />
6.6.2.2 T. Stuart<br />
X:\EA PROGRAM\ECYEAPSOP\Approved SOPs\ECY_EAP_SOP_<strong>Hemispherical</strong>_Photography_<strong>Computer</strong>_<strong>Analysis</strong>_v2_1<strong>EAP046</strong>_.doc_1/22/2014_Page 3
Environmental Assessment Program<br />
Standard Operating Procedure for the computer analysis <strong>of</strong> hemispherical digital images collected as<br />
part <strong>of</strong> a temperature Total Maximum Daily Load (TMDL) or Forests and Fish Unit technical study.<br />
1.0 Purpose and Scope<br />
1.1 The objective <strong>of</strong> this analysis is to estimate total radiation load, canopy cover, and<br />
effective shade from photographs taken with a hemispherical fish-eye adapter lens.<br />
1.2 <strong>Hemispherical</strong> digital photographs are taken looking upwards from beneath the plant<br />
canopy, using a 180° fish-eye lens and digital camera. <strong>Images</strong> are generally taken under<br />
the riparian canopy or in the middle <strong>of</strong> a stream channel. The HemiView © s<strong>of</strong>tware<br />
application is used with these images to determine total solar radiation, canopy cover,<br />
and effective shade for a time period selected by the user.<br />
1.3 To perform the analysis, HemiView © converts the full color hemispherical photo to a<br />
two-color image where black pixels represent shading vegetation and topography, and<br />
white pixels represent sky pixels. Whether a pixel is assigned a shade or sky value is<br />
determined by its brightness and color values. The purpose <strong>of</strong> image processing is to<br />
“tune” the hemispherical photo so that shading vegetation that might have a high<br />
enough brightness and/or color value to be classified as sky can be diminished and can<br />
correctly be classified as shade. Also, portions <strong>of</strong> the sky that are blue, in an otherwise<br />
cloudy sky may be incorrectly classified as shade and these can also be corrected.<br />
1.4 The HemiView © manual suggests that the best photographs are gathered under evenly<br />
overcast skies or early in the morning before the sun is present in the picture. Because<br />
<strong>of</strong> uncontrollable weather conditions and many clear sunny days during the summer<br />
months when hemispherical photos are typically taken, there may be poor contrast<br />
between the riparian vegetation and the sky or the solar disk may be present in the<br />
photograph. Raw images from the field may need some image corrections before they<br />
can be analyzed using the HemiView © s<strong>of</strong>tware.<br />
1.5 <strong>Analysis</strong> generally follows this sequence:<br />
1.5.1 Acquire photos and site-specific station data (using SOP EAP045)<br />
1.5.2 Decide which pictures will be used and create a station/site file for each location.<br />
1.5.3 View image in HemiView© and decide whether photo editing is needed<br />
1.5.4 Using Adobe Photoshop (or other photo editing s<strong>of</strong>tware) correct glare and code<br />
ignored regions. Save edited image to a new file name.<br />
1.5.5 Classify image to a two color, shade/sky image using the threshold value.<br />
1.5.6 Compile, confirm, and save settings to a .hvs file.<br />
1.5.7 Calculate output values.<br />
1.5.8 Compile output Excel sheets.<br />
X:\EA PROGRAM\ECYEAPSOP\Approved SOPs\ECY_EAP_SOP_<strong>Hemispherical</strong>_Photography_<strong>Computer</strong>_<strong>Analysis</strong>_v2_1<strong>EAP046</strong>_.doc_1/22/2014_Page 4
1.6 Effective shade values calculated from field collected hemispherical photos can be<br />
compared to values estimated with the computer model, SHADE. During TMDL<br />
analysis, the model SHADE is typically used to estimate effective shade resulting from<br />
riparian vegetation. The model usually calculates shade at 100 meter intervals along a<br />
stream. Effective shade values generated for <strong>Hemispherical</strong> photos taken in the middle<br />
<strong>of</strong> a stream channel give a field measured value to compare against the model generated<br />
value. The 1-visible sky fraction from HemiView© photos taken under the riparian<br />
canopy, can be used as the vegetation density input to the computer model SHADE.<br />
2.0 Applicability<br />
2.1 This procedure applies to all hemispherical photo analysis conducted under a stream<br />
temperature TMDL. This procedure includes instructions for Forests and Fish staff who<br />
generally take photos in small, steep, headwater stream areas. The procedure is general<br />
enough to apply to other situations with only minimal changes to meet a project’s<br />
unique objectives.<br />
3.0 Definitions<br />
3.1 Effective Shade: fraction <strong>of</strong> total possible solar radiation above the vegetation and<br />
topography that is blocked from reaching the surface <strong>of</strong> the stream and summed over a<br />
full day. The effective shade at a particular location (the location <strong>of</strong> the hemispherical<br />
photo) can be calculated, using HemiView © , for any day <strong>of</strong> the year. Because the solar<br />
path across the sky changes each day, the solar exposure a particular location receives<br />
will also change each day. Note: To date, studies have covered deciduous “leaf on”<br />
portions <strong>of</strong> the year. For winter analysis, it would not be appropriate to run a winter<br />
“leaf <strong>of</strong>f” date with a summer deciduous canopy photo.<br />
3.2 Canopy Cover: The percentage <strong>of</strong> the sky that is blocked by vegetation or topography.<br />
Unlike effective shade, this is a largely static quantity (assuming no wind) between full<br />
leaf expansion and leaf drop. This value can be measured by a densiometer. The 1-<br />
VisSky value calculated by the HemiView © s<strong>of</strong>tware is the canopy cover.<br />
3.3 <strong>Hemispherical</strong> photo: A hemispherical digital picture. A hemispherical photo is a<br />
permanent record <strong>of</strong> canopy condition.<br />
3.4 HemiView © : A proprietary computer s<strong>of</strong>tware package for the analysis <strong>of</strong><br />
hemispherical digital images. This s<strong>of</strong>tware can be found at:<br />
http://www.dynamax.com/hemiview.htm<br />
3.5 Riparian vegetation: Vegetation occurring along stream corridors.<br />
3.6 SHADE: A computer program used by Ecology to estimate stream center effective<br />
shade from riparian vegetation and stream channel maps.<br />
X:\EA PROGRAM\ECYEAPSOP\Approved SOPs\ECY_EAP_SOP_<strong>Hemispherical</strong>_Photography_<strong>Computer</strong>_<strong>Analysis</strong>_v2_1<strong>EAP046</strong>_.doc_1/22/2014_Page 5
3.7 Thermistor: A temperature data logger<br />
3.8 TMDL: Total Maximum Daily Load<br />
4.0 Personnel Qualifications/Responsibilities<br />
4.1 Persons involved in the field data collection and analysis must have experience and<br />
training in the natural, environmental or physical sciences. Relevant computer skills<br />
needed for this procedure include the following s<strong>of</strong>tware packages: HemiView©,<br />
Adobe Photoshop Elements, and Micros<strong>of</strong>t Excel.<br />
4.2 Natural Resource Scientist 1/2/3, Environmental Engineer 1/2/3, Environmental<br />
Specialist 1/2/3/4/5, Hydrogeologist 1/2/3/4, Administrative Intern 1/2/3<br />
5.0 Equipment, Reagents, and Supplies<br />
5.1 The analyst must have access to the following computer s<strong>of</strong>tware: HemiView © , an<br />
image processing program such as Adobe Photoshop Elements © , and Micros<strong>of</strong>t Excel.<br />
This procedure assumes the hemispherical photos have already been collected under the<br />
standard operating protocol for hemispherical digital photography field surveys. That<br />
protocol covers all equipment necessary to acquire the hemispherical photos.<br />
6.0 Summary <strong>of</strong> Procedure<br />
6.1 Define sites (stations) in HemiView © . For Forests and Fish staff this should be the first<br />
step. For TMDL staff, this can be done first or during step 6.4 HemiView © analysis<br />
settings. It is acceptable to have more than one photo assigned to each site. For<br />
example, TMDL staff <strong>of</strong>ten have three photos assigned to each site, these are C= center<br />
<strong>of</strong> stream, LB = riparian zone on the left bank, RB = riparian zone on the right bank.<br />
6.1.1 Some general information about the HemiView © site file is true for all users. Each<br />
station/site/photo will need the following information: name, description, latitude (in<br />
decimal degrees), longitude, altitude (meters), and magnetic declination (degrees).<br />
(Figure 1) You must enter this information in HemiView © through a data entry screen<br />
for each individual station. This site location information will be saved to a file called<br />
sites.csv that is kept in your C: drive at the location where HemiView © s<strong>of</strong>tware is<br />
installed. The default location is C:\Program Files\Delta-T\HemiView\sites.csv. This<br />
file will continue to grow larger as you add stations each year. If the HemiView ©<br />
X:\EA PROGRAM\ECYEAPSOP\Approved SOPs\ECY_EAP_SOP_<strong>Hemispherical</strong>_Photography_<strong>Computer</strong>_<strong>Analysis</strong>_v2_1<strong>EAP046</strong>_.doc_1/22/2014_Page 6
s<strong>of</strong>tware is reinstalled on your computer, the sites.csv file will be reset to the initial file<br />
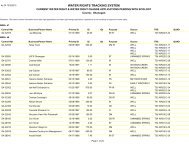
that came with the s<strong>of</strong>tware. Figure 1 shows the sites.csv file with the seven stations<br />
that come with the s<strong>of</strong>tware plus two added by Ecology. Attempts to directly edit this<br />
file to add stations, resulted in a .csv file that was not usable by HemiView © .<br />
HemiView Sites File, version 2<br />
SiteName Description Lat Long Alt Decl<br />
Burwell Cambridge UK: home <strong>of</strong> Delt 52.27 0.32 15 -3<br />
Lawrence Kansas USA: home <strong>of</strong> HEMI 40 -95 200 4<br />
Brisbane Australia: a site in the southe -27.5 153 10 11<br />
Reykjavik Iceland: a site with a large m 64 -22 20 -19<br />
Arctic Severnaya Zemlya, Siberia 80 100 0 33<br />
Antarctic South Pole station -89.9 180 1500 152<br />
Equatorial Galapagos -1 -92 10 6.3<br />
T11apxDayton dayton 46.22 -118.3 200 -3<br />
sno36.3test hemi in the middle <strong>of</strong> the stre 47 121.3 15<br />
Figure 1. Example <strong>of</strong> the HemiView© sites.csv file.<br />
3<br />
6.1.1.1 For Forests and Fish staff, all descriptive data for each station is compiled into a<br />
spreadsheet/dbf file. Fields to include in this file should include HemiView © settings<br />
such as lens and solar model type, elevation, declination, azimuth and zenith angles,<br />
image id, etc. Treat this file as though it will be imported into db format—e.g., limit<br />
field codes to about eight characters, do not use spaces in field codes, etc. Arrange<br />
fields in logical order—e.g., region, stand, segment, station, etc. An example file<br />
format is shown in Appendix Table A-1. Additional examples and information are<br />
available from Jack Janisch. Jack’s y:directory has examples <strong>of</strong> the 2004 format that<br />
can be copied and adapted to your purpose<br />
6.1.1.2 For TMDL staff wanting to set up the stations in advance, it is easiest to get all <strong>of</strong> the<br />
station data together in an Excel file. The file can be printed to make in easier to enter<br />
into HemiView © .<br />
6.1.1.2.1 First, make a backup copy <strong>of</strong> the sites.csv file in C:\Program Files\Delta-<br />
T\HemiView\sites.csv. e.g. copy and paste the file to the same directory. This will<br />
create a second copy named “copy <strong>of</strong> sites.csv”.<br />
6.1.1.2.2 Second, create the Excel file. This can be done either with an existing Excel file (you<br />
may already have one with latitude and longitude coordinates for each site), or with one<br />
that you can create by opening the sites.csv file in Excel. This would look like Figure 1<br />
above. If you create your Excel file by opening the sites.csv file, remember to ‘Save<br />
As’ to a new name. Add all <strong>of</strong> your stations and location information. This should<br />
include: SiteName, Description, Latitude (decimal degrees), Longitude, Altitude<br />
(meters), and Declination). See section 6.1.2.4 for information on how to find<br />
declination values. Note: Forests and Fish staff will enter 0 for declination, because they<br />
adjust for this during their field data collection. When all station information is<br />
complete, ‘Save As’ to the directory where your photos are. This spreadsheet may be<br />
printed and is available for you to reference during data entry through HemiView © .<br />
X:\EA PROGRAM\ECYEAPSOP\Approved SOPs\ECY_EAP_SOP_<strong>Hemispherical</strong>_Photography_<strong>Computer</strong>_<strong>Analysis</strong>_v2_1<strong>EAP046</strong>_.doc_1/22/2014_Page 7
6.1.2 In HemiView © Select SETTINGS
6.1.3 Put a copy <strong>of</strong> your site file in the directory where your project HemiView © photos are<br />
stored. This will ensure that you keep a permanent copy <strong>of</strong> your site files with your<br />
photos and that it will not be overwritten by new installs <strong>of</strong> s<strong>of</strong>tware. This copy should<br />
be uniquely named for the basin or project on which you are working e.g.<br />
basin_sites.csv. This will avoid confusion with the sites.csv file that HemiView© can<br />
only access through the installation directory.<br />
6.2 Initial HemiView © Photo Evaluation. View image in HemiView © and decide whether<br />
photo editing in Adobe Photoshop (Step 6.3) is needed for proper classification.<br />
6.2.1 Open an image in HemiView © . The image will open and need to be resized by selecting<br />
from the command bar VIEW
assess whether HemiView © is classifying the image properly and, if not, adjust as<br />
necessary with Adobe Photoshop in step 6.3.Adjust the threshold level so that the<br />
shading vegetation is properly represented by the black pixels and that the sky is also<br />
properly characterized by the white pixels (see Figure 4). Flip back and forth between<br />
the full-color image and the classified image to see how well the s<strong>of</strong>tware is classifying<br />
it. Whether a pixel is assigned a shade or sky value is determined by its brightness and<br />
color values.<br />
6.2.4 When the solar disc is present in the photo, adjusting threshold may not correct the<br />
image without substantial loss elsewhere. So, examine the solar disk first. If the<br />
program classifies the solar disc correctly as sky then move on to check the horizon and<br />
other features.<br />
6.2.5 Sometimes it is more difficult to get a proper threshold setting near the image horizon.<br />
If you cannot find a threshold setting that properly classifies the image, then rework the<br />
pixel brightness in Photoshop Elements and try it again in Hemiview.<br />
6.2.6 If HemiView © correctly classifies the sky (white) vs. shading features (black) with no<br />
photo editing, then save or move a copy <strong>of</strong> the image to the final_HemiView folder (see<br />
Records Management section 7.0), skip the image processing step 6.3 and move directly<br />
to HemiView © analysis, step 6.4.<br />
6.2.7 If the solar disc, blue and cloudy sky, or other features are causing the photo to be<br />
classified incorrectly then move to step 6.3 and edit the image.<br />
Figure 4. A classified hemispherical photo with an appropriate threshold setting.<br />
X:\EA PROGRAM\ECYEAPSOP\Approved SOPs\ECY_EAP_SOP_<strong>Hemispherical</strong>_Photography_<strong>Computer</strong>_<strong>Analysis</strong>_v2_1<strong>EAP046</strong>_.doc_1/22/2014_Page 10
6.3 Image Processing in Adobe Photoshop. The image processing procedure uses Adobe<br />
Photoshop elements to correct color and brightness problems with the original image if<br />
HemiView © is not classifying it correctly. Generally, the less editing and fewer<br />
decisions we make about classification the better. There are a range <strong>of</strong> revision tools in<br />
Adobe Photoshop Elements so pick one that works without being heavy-handed.<br />
6.3.1 Open your original hemispherical photo in Adobe Photoshop Elements. Save your<br />
image with a new name such as, DSCN0298clean.tif, in the TIFF file format.<br />
6.3.2 Photo editing suggestions from TMDL staff.<br />
6.3.2.1 Select the magic wand tool from the tool bar (see figure 5) and move the wand into the<br />
sky portion <strong>of</strong> the image.<br />
Figure 5. Magic wand tool in Photoshop Elements.<br />
6.3.2.1.1 The magic wand tool selects pixels <strong>of</strong> color based on the color values <strong>of</strong> neighboring<br />
pixels. Using this tool allows you to select the sky pixels around the complicated shapes<br />
<strong>of</strong> riparian vegetation. Hold the SHIFT key and click the left mouse button several<br />
times while in different parts <strong>of</strong> the sky to select as much <strong>of</strong> the sky as you can (see<br />
Figure 6 for example)<br />
.<br />
Figure 6. Using the magic wand tool to select the sky pixels. The sky pixel selection follows the<br />
outline <strong>of</strong> the tree canopy with a dashed line.<br />
X:\EA PROGRAM\ECYEAPSOP\Approved SOPs\ECY_EAP_SOP_<strong>Hemispherical</strong>_Photography_<strong>Computer</strong>_<strong>Analysis</strong>_v2_1<strong>EAP046</strong>_.doc_1/22/2014_Page 11
6.3.2.2 Select the brightness/contrast control menu from the command bar as shown in Figure 7.<br />
Figure 7. The adjust brightness/contrast menu.<br />
6.3.2.2.1 This will open the tool with slider controls for brightness and contrast. Adjust the sky<br />
pixel brightness so that it is a very high value. In HemiView © the sky pixels have the<br />
highest brightness values. Adjusted sky pixels should look something like the example<br />
in Figure 8. Often the solar disc can also be dealt with by simply copying a section <strong>of</strong><br />
sky and pasting over it.<br />
Figure 8. Sky pixels brightened.<br />
6.3.2.3 Besides the magic wand tool there are other selection tools that are also useful. The<br />
polygon selection tool is very useful for masking the image orientation markers. Here<br />
are some common tools that may come in handy (use the help function in Elements to<br />
learn more about using each tool):<br />
6.3.2.3.1 Dodge and burn tools, for brightening or darkening pixels similar to the brightness<br />
controls only it functions as a paintbrush style that you can freehand with the mouse.<br />
X:\EA PROGRAM\ECYEAPSOP\Approved SOPs\ECY_EAP_SOP_<strong>Hemispherical</strong>_Photography_<strong>Computer</strong>_<strong>Analysis</strong>_v2_1<strong>EAP046</strong>_.doc_1/22/2014_Page 12
6.3.2.3.2 Stamp tool, for cloning other parts <strong>of</strong> the image using the mouse. This can be useful for<br />
covering up anomalies such as sun glare (bright spots with riparian vegetation behind<br />
it); basically covering up what HemiView © would incorrectly interpret as sky and<br />
making sure the pixels are classified as shading vegetation. This can also be helpful for<br />
removing the little dark “bubbles” that show up sometimes when adjusting the sky<br />
brightness using the magic wand tool.<br />
6.3.2.3.3 Paint brush tool, useful for removing highlights on tree trunks or sun flares by painting<br />
a black color over the part <strong>of</strong> the image that is definitely vegetation or some other<br />
shading feature.<br />
6.3.2.3.4 Note: Don’t create vegetation in the image where there is none now. If sun flares or<br />
hotspots have obscured the canopy any touchups should be minimal and an assessment<br />
<strong>of</strong> whether or not to analyze the picture should be considered.<br />
6.3.2.4 The next step is to mask the north/south orientation markers. Before you begin, check<br />
to see if this step is necessary by opening the image in HemiView © (see 6.2). Notice the<br />
influence <strong>of</strong> the orientation markers when toggling between the ‘classified’ and<br />
‘normal’ views. If the orientation markers do not influence the ‘classified’ image, then<br />
skip to 6.3.3. Typically the area occupied by markers in the photo is small (< a few<br />
percent) and they lie on the image perimeter. Thus HemiView© will categorize them as<br />
shade or vegetation. If the orientation markers add an artificial component, then proceed<br />
with the following directions.<br />
6.3.2.4.1 Use the polygon selector tool to select around each marker (see Figure 9).<br />
Figure 9. North orientation marker selected for masking.<br />
6.3.2.4.2 Use the paint can and paint brush tools to paint the stencil color inside the polygon<br />
selection. Using the selector tool ensures that you change the color values only <strong>of</strong> the<br />
marker itself. Use stencil color value <strong>of</strong> Red 255, Green 0, and Blue 0. Paint the north<br />
marker with a pointed end to separate it from the south marker (figure 10). Check the<br />
field notes to determine if the red or the white marker was used for north. If it wasn’t<br />
recorded it should be easy to determine the southern direction by which marker is closer<br />
to the sun.<br />
X:\EA PROGRAM\ECYEAPSOP\Approved SOPs\ECY_EAP_SOP_<strong>Hemispherical</strong>_Photography_<strong>Computer</strong>_<strong>Analysis</strong>_v2_1<strong>EAP046</strong>_.doc_1/22/2014_Page 13
Figure 10. Masking orientation markers.<br />
6.3.3 Photo Editing suggestions from Forests and Fish staff<br />
6.3.3.1 When the solar disc is present in the photo, adjusting threshold may not correct the<br />
image without substantial loss elsewhere. So, examine the solar disk first. If the<br />
program classifies the solar disc correctly as sky then move on to glare and other<br />
corrections. Otherwise, the solar disc can <strong>of</strong>ten be masked by darkening the image<br />
slightly, then copying and pasting a small section taken from elsewhere in the image.<br />
This reduces the contrast enough to split out vegetation from sky without drastic<br />
alteration <strong>of</strong> other settings. It also preserves image fine structure, <strong>of</strong>ten lost when the<br />
spray can or other heavy handed editing techniques are used. Generally, the less editing<br />
and fewer decisions we make about classification the better. Briefly describe your edits<br />
and record them as QA, along with threshold, in the spreadsheet.<br />
6.3.3.2 Now examine the image for glare. For example, on sunny days, glare on tree trunks<br />
will be classified as sky. As with the solar disc, small sections <strong>of</strong> the image can be<br />
copied elsewhere to preserve the general stand structure. Sometimes odd reflections<br />
also show up in the image so approach them the same way.<br />
X:\EA PROGRAM\ECYEAPSOP\Approved SOPs\ECY_EAP_SOP_<strong>Hemispherical</strong>_Photography_<strong>Computer</strong>_<strong>Analysis</strong>_v2_1<strong>EAP046</strong>_.doc_1/22/2014_Page 14
6.3.3.3 Then move on to foliage. If the threshold is too low, light flecks will show up as<br />
vegetation. If too high, foliage edges will wash out and be classified as sky. Focus on<br />
conifer foliage in the mid taurus <strong>of</strong> the image because the distortion is generally higher<br />
at the photo perimeter and foliage may be washed out at zenith. Then adjust the<br />
sky/vegetation threshold to a value between full opacity and full transparency <strong>of</strong> the<br />
conifer foliage, toggling between the actual image and classified image. Zoom in and<br />
out as needed. Try to balance over-estimation <strong>of</strong> direct overhead canopy gaps and<br />
under-estimation <strong>of</strong> perimeter canopy gaps overall. For a through discussion <strong>of</strong> this, see<br />
the HemiView © help file.<br />
6.3.3.4 Finally, sometimes hardhats and other objects are caught in the photos. If these objects<br />
fall inside deep shade, then they probably don’t require action because HemiView ©<br />
would treat the region they block as shade anyway. On the other hand, objects that<br />
block sun flecks should be coded so that the s<strong>of</strong>tware ignores that section <strong>of</strong> the image.<br />
Coding requires that the corrected photo be saved in a non-compressed format such as<br />
tiff. If more than a few percent <strong>of</strong> the image are blocked (for example, a hand over the<br />
lens), the image is not usable.<br />
6.3.4 Once the desired balance <strong>of</strong> brightness and anomalies has been reached, select<br />
FILE
Figure 11. Classifier settings in HemiView © .<br />
6.4.2 If the image was worked in Photoshop, the threshold value needs to be selected now.<br />
Follow the procedure outlined in steps 6.2.3 to 6.2.7 to select a threshold value.<br />
6.4.3 To geographically orient the hemispherical photo with the expected sun path, the<br />
location <strong>of</strong> that image must be defined. Select the site using SETTINGS
Figure 12. Align image in HemiView © .<br />
6.4.6 The alignment ring diameter can be changed. Adjust if needed so that it approximately<br />
follows the edge <strong>of</strong> the photo. This defines the horizon for HemiView © .<br />
6.4.7 open settings>skymap. set azimuth=8 and zenith=18. This sets the number <strong>of</strong> sectors.<br />
6.4.8 open settings>intercepting surface.<br />
6.4.8.1 For Forests and Fish steep headwater streams only: set azimuth=degrees aspect and<br />
zenith=degrees slope. This adjusts the calculations for an inclined surface and direction<br />
the slope faces. Check single sided.<br />
6.4.8.2 TMDL settings are 0 azimuth, 0 slope, and single sided.<br />
6.4.9 Select SETTINGS
6.4.10 Instructions for Forests and Fish: as a quirk <strong>of</strong> HemiView © , the s<strong>of</strong>tware doesn’t<br />
calculate indirect radiation via its time series engine. The time series engine is used<br />
when summing radiation for a series <strong>of</strong> days instead <strong>of</strong> for just one day. So, when there<br />
is interest in this quantity, use the long time interval engine, which calculates radiation,<br />
loads on a monthly scale. Using this method, monthly radiation loads are divided by<br />
number <strong>of</strong> days per month to estimate daily average. The analyst has to watch the<br />
boundaries for blocks <strong>of</strong> days because they are tied solar patterns such as solstice.<br />
Otherwise, however, calculations between the two methods are similar, what the day<br />
track toolbar used to select Julian dates. Thus the user has a choice between direct<br />
values only via time series or direct+indirect radiation load.<br />
6.4.11 Select lens either from the command bar or from Settings \ Lens \. Select Coolpix 900.<br />
This identifies the lens and correction coefficients. This is the current program default.<br />
6.4.12 open settings>solar model. Select default simple solar model. Set diffusion =uniform<br />
overcast sky distribution. The light diffusion model assumes equal amounts <strong>of</strong> diffuse<br />
radiation originate from all sky directions. confirm units = W m -2 and solar flux = 1370.<br />
These are the current HemiView © program defaults. Note that the HemiView © solar<br />
model best approximates that <strong>of</strong> a cloudless day.<br />
6.4.13 The Output configuration can remain at the default setting for TMDL work. Although<br />
not all outputs are currently used, removing some outputs doesn’t affect the calculation<br />
time much and may be useful for some other purpose in the future. For Forests and Fish<br />
staff, a subset <strong>of</strong> the outputs are run and will be discussed in 6.5.2 below.<br />
6.4.14 Select FILEOutput<br />
Configuration>Configuration>All Outputs. The Output Sheets and Values Sheets all<br />
are checked for inclusion. TMDL staff should skip step 6.5.2.<br />
6.5.2 Forests and Fish staff will run a subset <strong>of</strong> the calculations. Configure the summary file<br />
to include only worksheets relevant to total radiation load. For example, we are not<br />
using global, indirect, or other site factors so we do not need to include these. The<br />
summary file should include:<br />
6.5.2.1 corrected values<br />
6.5.2.2 above canopy values, direct and diffuse<br />
6.5.2.3 below canopy values, direct and diffuse<br />
X:\EA PROGRAM\ECYEAPSOP\Approved SOPs\ECY_EAP_SOP_<strong>Hemispherical</strong>_Photography_<strong>Computer</strong>_<strong>Analysis</strong>_v2_1<strong>EAP046</strong>_.doc_1/22/2014_Page 18
6.5.2.4 overall values<br />
6.5.2.5 visible sky<br />
6.5.2.6 ground cover<br />
6.5.2.7 use cosine corrected values only. Uncorrected values are estimates <strong>of</strong> total brightness.<br />
The cosine correction best models how light is absorbed by a surface.<br />
6.5.2.8 use a single-sided leaf surface model<br />
6.5.2.9 When satisfied with all settings, open settings>output sheets. All sheets checked will be<br />
exported during calculations. Be certain the following are checked: a) VALUES,<br />
DIFFMONTH, DIFFAB, DIFFBE, DIRAB, DIRBE. Total canopy or image results are<br />
summarized in the Values worksheet. ISF= Indirect site factor, defined as proportion <strong>of</strong><br />
diffuse solar radiation reaching a site relative to a fully open (no canopy) site. GSF=<br />
proportion <strong>of</strong> global radiation under a plant canopy relative to a fully open site. DSF=<br />
proportion <strong>of</strong> direct solar radiation reaching a site relative to a fully open site. Initially<br />
you might include SUMMARY, IMAGE, SITE, and COMMENTS but check the<br />
output. If this does not supply anything useful there is no need to export them. Also<br />
open settings>values sheet. This controls what values are exported per sheet. In<br />
addition to all direct radiation categories, also export VISSKY and GNDCOVER.<br />
Finally, when ready choose the Calculate icon from the command bar. This generates a<br />
multi-page spreadsheet summarizing the image by sector. Additional quantities such as<br />
LAI can be exported. The model used to predict LAI may be inappropriate for mixed<br />
forest canopy, however.<br />
6.5.3 Work on one image at a time, open the .hvs file and it will bring up all the settings<br />
HemiView © needs to analyze the hemispherical photo. Select CALCULATE from the<br />
command bar or click on the calculate button (it looks like a yellow snowflake button<br />
on the toolbar) and the s<strong>of</strong>tware will run through all <strong>of</strong> the calculations specified in the<br />
output configuration. Enter a short description in the comments field to help describe<br />
the hemispherical photo location in the results spreadsheet (see Figure 13).<br />
Figure 13. Calculate dialog box in HemiView © .<br />
X:\EA PROGRAM\ECYEAPSOP\Approved SOPs\ECY_EAP_SOP_<strong>Hemispherical</strong>_Photography_<strong>Computer</strong>_<strong>Analysis</strong>_v2_1<strong>EAP046</strong>_.doc_1/22/2014_Page 19
6.5.4 Once the calculations have been completed you will see a spreadsheet very similar in<br />
appearance to an Excel spreadsheet. Each time you run the calculate function it will<br />
append the new results to the end <strong>of</strong> the previous calculations. If the HemiView ©<br />
program is closed and later re-opened, results will be added by default to a new<br />
spreadsheet. To append results to an existing spreadsheet, select the spreadsheet from<br />
FILE
6.6.2 TMDL staff calculations - Canopy cover and percent effective shade are the two values<br />
most likely to be needed for a temperature TMDL analysis.<br />
6.6.2.1 Calculate canopy cover as 1-VISSKY. Convert to percent as needed<br />
6.6.2.2 Effective shade is the fraction or percentage <strong>of</strong> incoming solar radiation above the<br />
vegetation and topography that is blocked from reaching the surface <strong>of</strong> the water.<br />
a. Effective shade calculation method #1: Calculate effective shade fraction as 1- (DIRBE<br />
+ DIFFBE) / (DIRAB + DIFAB). Obtain these values using the procedures outlined for<br />
the Forests and Fish staff, sections 6.6.1.1 – 6.6.1.2. Do NOT use the values on the<br />
‘values’ tab, because these are averages for the entire year. Even if this was what was<br />
desired, the yearly average values would be incorrect since HemiView analyzed the<br />
entire year using a photo when the leaves were on, which would be wrong for winter.<br />
The advantage <strong>of</strong> method #1 is that it accounts for diffuse radiation as well as direct<br />
radiation. The disadvantage is that it is not possible to calculate effective shade for a<br />
specific day <strong>of</strong> the year, only a specific month.<br />
b. Effective shade calculation method #2: Go to the ‘TimeSer’ tab, and for each site, sum<br />
up all the values <strong>of</strong> DirAb and DirBe. Then calculate effective shade as 1 – ([Sum <strong>of</strong><br />
DirBe] / [Sum <strong>of</strong> DirAb]). The advantage <strong>of</strong> method #2 is that it is possible to calculate<br />
effective shade for a specific day <strong>of</strong> the year, perhaps to compare to a shade model run<br />
for a specific day <strong>of</strong> the year. (This will be the day <strong>of</strong> the year that was selected in<br />
HemiView when analysis was executed, and is indicated on the ‘TimeSer’ tab.) The<br />
disadvantage is that it does not account for diffuse radiation. However, the vast<br />
majority <strong>of</strong> solar radiation is direct radiation, so this is not a large source <strong>of</strong> error.<br />
7.0 Records Management<br />
7.1 All original hemispherical photos should be maintained in their raw electronic form in<br />
one data folder (e.g. named hemi_initial). Copies should be used for the image<br />
processing and HemiView © analysis steps and should be kept in a separate data folder<br />
(e.g. named hemi_final). Both folders should be kept with the other project files either<br />
on a network drive or on your local computer.<br />
7.2 A final copy <strong>of</strong> the sites.csv file should be stored in the hemi_final directory. The<br />
sites.csv file may be shared with other HemiView © users. This file should be renamed<br />
so that users know which project sites are contained in that file, e.g.<br />
Snoqualmie_sites.csv.<br />
8.0 Quality Control and Quality Assurance Section<br />
8.1 Image processing should not include substantial changes to the image (adding or<br />
subtracting vegetation not in the original image would be entirely improper). Any<br />
changes made should be consistent with the vegetation in the original image.<br />
8.2 The final spreadsheet output should be reviewed before finalizing to ensure that:<br />
X:\EA PROGRAM\ECYEAPSOP\Approved SOPs\ECY_EAP_SOP_<strong>Hemispherical</strong>_Photography_<strong>Computer</strong>_<strong>Analysis</strong>_v2_1<strong>EAP046</strong>_.doc_1/22/2014_Page 21
8.2.1 All images were processed correctly using the correct site and image orientation<br />
settings.<br />
8.2.2 Any duplicate results or calculations with errors have been removed.<br />
8.2.3 The image was classified with the 255 Red pixels ignored.<br />
8.2.4 The analysis day is correct.<br />
9.0 Safety<br />
9.1 This procedure involves working at a computer in an <strong>of</strong>fice setting and no special safety<br />
procedures are necessary other than normal <strong>of</strong>fice guidelines. Give your eyes a break<br />
occasionally from staring at these images.<br />
X:\EA PROGRAM\ECYEAPSOP\Approved SOPs\ECY_EAP_SOP_<strong>Hemispherical</strong>_Photography_<strong>Computer</strong>_<strong>Analysis</strong>_v2_1<strong>EAP046</strong>_.doc_1/22/2014_Page 22
10.0 References<br />
10.1 Stohr, A. and D. Bilhimer. 2008. Standard Operating Procedures for hemispherical<br />
digital photography field surveys conducted as part <strong>of</strong> a temperature Total Maximum<br />
Daily Load (TMDL) or Forests and Fish Unit technical study. EAP045. Environmental<br />
Assessment Program, WA Department <strong>of</strong> Ecology.<br />
10.2 Rich, Paul M., et al. 1999. HemiView © User Manual. Delta-T Devices, Ltd.<br />
http://www.delta-t.co.uk/product-downloads.asp?$=Product%20Manuals<br />
Appendix A<br />
Table A-1 Example descriptive data file for Forests and Fish project stations.<br />
YY REGION_ID REG CD STAND_ID STAND_CD STREAM TYPE STATION LAT LONG THRESHOLD ASPECT SLOPE (%) SLOPE (DEC) ARCTAN DEGREE<br />
03 CAPITOL_FOREST CF SEESAW SESA M T3 Top 46.93232 123.12258 169 308 0 0.0000 0.0000<br />
03 CAPITOL_FOREST CF SEESAW SESA M T3 B 46.93685 123.12361 131 32 0 0.0000 0.0000<br />
03 CAPITOL_FOREST CF SEESAW SESA A T5 C 46.93068 123.12269 154 360 30 0.3 0.2915 16.6992<br />
03 CAPITOL_FOREST CF SEESAW SESA A T5 P 46.92996 123.12201 154 332 22 0.22 0.2166 12.4074<br />
03 CAPITOL_FOREST CF SEESAW SESA B T5 C 46.56181 123.7506 135 342 10 0.1 0.0997 5.7106<br />
03 CAPITOL_FOREST CF SEESAW SESA B T5 P 46.56104 123.7449 135 342 15 0.15 0.1489 8.5308<br />
X:\EA PROGRAM\ECYEAPSOP\Approved SOPs\ECY_EAP_SOP_<strong>Hemispherical</strong>_Photography_<strong>Computer</strong>_<strong>Analysis</strong>_v2_1<strong>EAP046</strong>_.doc_1/22/2014_Page 23