EFFECTS OF SURFACE ELASTIC MODULUS AND CURVATURE ...
EFFECTS OF SURFACE ELASTIC MODULUS AND CURVATURE ...
EFFECTS OF SURFACE ELASTIC MODULUS AND CURVATURE ...

You also want an ePaper? Increase the reach of your titles
YUMPU automatically turns print PDFs into web optimized ePapers that Google loves.
<strong>EFFECTS</strong> <strong>OF</strong> <strong>SURFACE</strong> <strong>ELASTIC</strong> <strong>MODULUS</strong> <strong>AND</strong> <strong>CURVATURE</strong><br />
ON PLANTAR PRESSURE DISTRIBUTION BENEATH THE HEEL<br />
Martine Mientjes 1 and Martyn Shorten 1,2<br />
1 NIKE Sport Research Laboratory, Beaverton, Oregon, USA<br />
2 BioMechanica LLC, Portland, Oregon, USA<br />
INTRODUCTION<br />
There is experimental evidence that both the compliance of shoe cushioning materials and the shape of the cushioned surface affect the<br />
distribution of pressure under the heel. Softer cushioning in the heel of a walking shoe reduces the peak pressure under the calcaneus,<br />
transferring load to the peripheral regions of the heel (Shorten et al., 1999). Similarly, a custom-moulded viscoelastic insert was found<br />
to reduce the peak plantar pressure beneath a pathological foot more effectively than a flat insert (Kogler & Shorten, 2001).<br />
Furthermore, a contoured innersole board was shown to reduce the peak pressures under the heel during running and kicking in soccer<br />
(Morag et al., 2002).<br />
The purpose of this study was to directly determine the effects of surface elastic modulus and surface curvature on the pressure<br />
distribution beneath the heel, using systematically varying, controlled conditions.<br />
METHODS<br />
An adjustable mold was used to manufacture polyurethane foam<br />
blocks with heel cups moulded into one surface. The cups were<br />
all 80 mm wide but differed in radius of curvature and hence in<br />
depth (Table 1a). The polyurethane foam formulation was<br />
varied to create samples of each heel cup in materials with four<br />
different elastic moduli (Table 1b), giving 16 different<br />
experimental conditions. Stress-strain curves for each material<br />
were recorded by compression testing on a Tinius Olsen<br />
Universal Testing Machine and elastic moduli were estimated<br />
by the average slope of the stress-strain curve in the 5% – 65%<br />
strain range (Table 1b).<br />
Table 1: Surface Sample Characteristics.<br />
(a) Surface Geometry (b) Material Properties<br />
Depth Radius Density Elastic<br />
Modulus<br />
mm mm g cm -3 MPa<br />
C0 0 ∞ H0 0.35 1.20<br />
C1 5 163 H1 0.34 0.54<br />
C2 10 85 H2 0.31 0.46<br />
C3 15 61 H3 0.32 0.32<br />
Eight male volunteers participated in this study (mean mass<br />
80.2 kg ± 15.4; stature 1.80 m ± 0.05; US shoe size 9.4 ± 0.5).<br />
Subjects balanced on one leg with the heel and forefoot<br />
supported by separate PU foam blocks. Foam blocks under the<br />
heel, representing the 16 experimental conditions, were<br />
presented to each subject three times in random order. Plantar<br />
pressure distribution beneath the heel was measured using an F-<br />
Scan insole system (Tekscan, Inc., Boston, USA). Insoles were<br />
calibrated against an appropriate range of pressures applied<br />
with an air bladder. A force plate (Kistler, Winterthur,<br />
Switzerland) was used to measure the ground reaction force<br />
beneath the heel and to scale the F-Scan data. Subjects<br />
controlled heel-forefoot weight distribution by lightly gripping<br />
a stationary bar, using visual feedback of force data. Force and<br />
pressure data were collected for 1.0 s at 100 Hz. The average<br />
force and pressure distribution were calculated for each trial.<br />
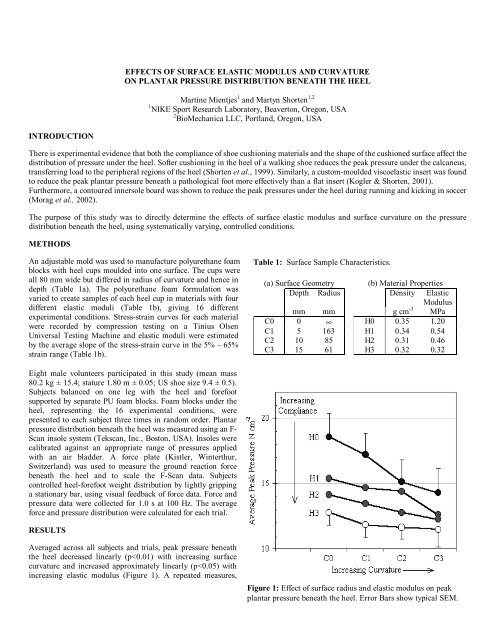
RESULTS<br />
Averaged across all subjects and trials, peak pressure beneath<br />
the heel decreased linearly (p
two-way analysis of variance of the pressure distribution data, applied sensor by sensor, revealed significant effects due to both surface<br />
geometry and material properties (Figure 1). More compliant surfaces (i.e. those with lower elastic moduli) had lower pressures<br />
beneath the center of the heel, while corresponding increases in pressure were observed in peripheral regions. Curvature of the surface<br />
had a similar effect, with smaller radii (i.e. greater curvature) producing a “flattening” of the pressure distribution. The area of the heel<br />
showing a significant interaction effect between the curvature and elastic modulus is explained by the observation that differences<br />
among curvature conditions were greater among trials with the<br />
Factor 1<br />
Elastic Modulus<br />
Factor 2<br />
Surface Curvature<br />
Interaction<br />
Modulus x Curvature<br />
highest foam elastic modulus than with softer foams.<br />
DISCUSSION<br />
Our results show that, within the range of conditions examined, changes in the hardness and curvature of the surface beneath the heel<br />
have similar effects on the distribution of plantar pressure. Classical Hertz contact theory (Johnson, 1985) describes the interaction of<br />
linear elastic surfaces with elliptical surface geometry. According to Hertz, the peak pressure, p 0 between two contacting surfaces<br />
(denoted by subscripts 1 and 2) is a function of E* the composite elastic modulus and R*, the composite radius.<br />
2<br />
3<br />
*<br />
⎞ ⎛ E<br />
⎜ p<br />
0<br />
∝<br />
[1] where<br />
R<br />
* ⎟ ⎠<br />
⎝<br />
1<br />
R<br />
*<br />
1 1<br />
= + [2] and<br />
R R<br />
1<br />
2<br />
1<br />
E<br />
*<br />
1 1<br />
= + [3]<br />
E E<br />
1<br />
2<br />
Equation [1] presages this study’s finding that the effects of surface elastic modulus and curvature on peak plantar pressure are<br />
qualitatively equivalent. Since Hertzian contact theory assumes linear elastic properties, it cannot be quantitatively applied to the<br />
Figure 2: Regions of the heel demonstrating significant differences<br />
in pressure due to the experimental conditions. Shaded areas<br />
indicate a significant reduction or increase in pressure with<br />
decreasing elastic modulus or increasing surface curvature.<br />
interaction between the foot and the cushioning system. Both elements of<br />
the system are non-linear and the radius and elastic properties of the heel cannot be simply described. However, the proportionality<br />
predicted by Hertz does describe a large portion of the observed variance in peak pressure (Figure 3) and the high correlation is robust<br />
over a wide range of assumed heel geometries and material properties.<br />
The mechanism of pressure redistribution appears to be the increase in contact area caused by softer and more conforming materials.<br />
Thus when reductions in plantar pressure are desirable but increases in the softness or thickness of cushioning beneath the foot are<br />
undesirable, changes in the curvature of the foot-surface interface may substitute for cushioning. Such applications include athletic<br />
footwear for which cushioning is not a primary goal, low profile cushioning systems and orthotic inserts.<br />
REFERENCES<br />
Figure 3: Relationship of peak pressure and the<br />
constant E*/R* 2/3 assuming E heel = 5MPa and<br />
R heel =35 mm.<br />
Johnson, K.L (1985) Contact Mechanics. Cambridge University Press.<br />
Kogler, G.F. & Shorten, M.R. (2001) Proc. 5 th ISB Symp. Footwear Biomechanics, Zurich / Switzerland, (Eds. E. Hennig, A. Stacoff).<br />
Morag, E. et al. (2002) Proc. 8 th Emed Scientific Meeting, Kananaskis / Canada, (Eds. B. Nigg, M.A. Nurse).<br />
Shorten, M.R. et al. (1999) Proc. 4 th ISB Symp. Footwear Biomechanics, Calgary / Canada, (Ed. D. Stefanyshyn).