Download - NT-MDT
Download - NT-MDT
Download - NT-MDT

You also want an ePaper? Increase the reach of your titles
YUMPU automatically turns print PDFs into web optimized ePapers that Google loves.
+ Models<br />
Applied Surface Science xxx (2006) xxx–xxx<br />
www.elsevier.com/locate/apsusc<br />
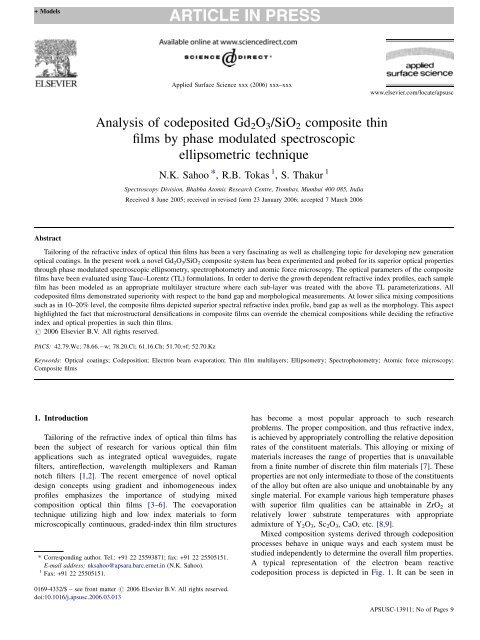
Analysis of codeposited Gd 2 O 3 /SiO 2 composite thin<br />
films by phase modulated spectroscopic<br />
ellipsometric technique<br />
N.K. Sahoo *, R.B. Tokas 1 , S. Thakur 1<br />
Spectroscopy Division, Bhabha Atomic Research Centre, Trombay, Mumbai 400 085, India<br />
Received 8 June 2005; received in revised form 23 January 2006; accepted 7 March 2006<br />
Abstract<br />
Tailoring of the refractive index of optical thin films has been a very fascinating as well as challenging topic for developing new generation<br />
optical coatings. In the present work a novel Gd 2 O 3 /SiO 2 composite system has been experimented and probed for its superior optical properties<br />
through phase modulated spectroscopic ellipsometry, spectrophotometry and atomic force microscopy. The optical parameters of the composite<br />
films have been evaluated using Tauc–Lorentz (TL) formulations. In order to derive the growth dependent refractive index profiles, each sample<br />
film has been modeled as an appropriate multilayer structure where each sub-layer was treated with the above TL parameterizations. All<br />
codeposited films demonstrated superiority with respect to the band gap and morphological measurements. At lower silica mixing compositions<br />
such as in 10–20% level, the composite films depicted superior spectral refractive index profile, band gap as well as the morphology. This aspect<br />
highlighted the fact that microstructural densifications in composite films can override the chemical compositions while deciding the refractive<br />
index and optical properties in such thin films.<br />
# 2006 Elsevier B.V. All rights reserved.<br />
PACS: 42.79.Wc; 78.66.<br />
w; 78.20.Ci; 61.16.Ch; 51.70.+f; 52.70.Kz<br />
Keywords: Optical coatings; Codeposition; Electron beam evaporation; Thin film multilayers; Ellipsometry; Spectrophotometry; Atomic force microscopy;<br />
Composite films<br />
1. Introduction<br />
Tailoring of the refractive index of optical thin films has<br />
been the subject of research for various optical thin film<br />
applications such as integrated optical waveguides, rugate<br />
filters, antireflection, wavelength multiplexers and Raman<br />
notch filters [1,2]. The recent emergence of novel optical<br />
design concepts using gradient and inhomogeneous index<br />
profiles emphasizes the importance of studying mixed<br />
composition optical thin films [3–6]. The coevaporation<br />
technique utilizing high and low index materials to form<br />
microscopically continuous, graded-index thin film structures<br />
* Corresponding author. Tel.: +91 22 25593871; fax: +91 22 25505151.<br />
E-mail address: nksahoo@apsara.barc.ernet.in (N.K. Sahoo).<br />
1 Fax: +91 22 25505151.<br />
has become a most popular approach to such research<br />
problems. The proper composition, and thus refractive index,<br />
is achieved by appropriately controlling the relative deposition<br />
rates of the constituent materials. This alloying or mixing of<br />
materials increases the range of properties that is unavailable<br />
from a finite number of discrete thin film materials [7]. These<br />
properties are not only intermediate to those of the constituents<br />
of the alloy but often are also unique and unobtainable by any<br />
single material. For example various high temperature phases<br />
with superior film qualities can be attainable in ZrO 2 at<br />
relatively lower substrate temperatures with appropriate<br />
admixture of Y 2 O 3 ,Sc 2 O 3 , CaO, etc. [8,9].<br />
Mixed composition systems derived through codeposition<br />
processes behave in unique ways and each system must be<br />
studied independently to determine the overall film properties.<br />
A typical representation of the electron beam reactive<br />
codeposition process is depicted in Fig. 1. It can be seen in<br />
0169-4332/$ – see front matter # 2006 Elsevier B.V. All rights reserved.<br />
doi:10.1016/j.apsusc.2006.03.013<br />
APSUSC-13911; No of Pages 9
+ Models<br />
2<br />
N.K. Sahoo et al. / Applied Surface Science xxx (2006) xxx–xxx<br />
Fig. 1. A typical pictorial representation of a reactive electron beam codeposition process depicting the different zones of the vapour mixing and monitoring.<br />
this figure that there are several zones in the vapour mixings and<br />
one can select an appropriate region as per the need of the<br />
application. Although refractive indices of mixed composition<br />
films often vary somewhat linearly with atomic<br />
composition, the mechanical and structural properties<br />
generally do not and therefore cannot be predicted based<br />
on those of the pure constituents. This behavior is due to the<br />
fact that the microstructure, which strongly affects mechanical<br />
properties, does not vary linearly with the composition.<br />
Factors such as bond strengths, chemical environment of the<br />
atoms and grains, surface mobility of the species during<br />
deposition and both short- and long-range order can induce<br />
a microstructure that is unique to the mixed composition<br />
film [5,10]. For example, the composition dependence of<br />
intrinsic stress shows linear behavior in layered films but<br />
non-linear in codeposited films in mixtures of Ge with ZnS,<br />
CdTe, MgF 2 and CeF 3 [11]. In the present work also it has<br />
been noticed that the presence of certain volume mixture of
+ Models<br />
N.K. Sahoo et al. / Applied Surface Science xxx (2006) xxx–xxx 3<br />
SiO 2 in Gd 2 O 3 has improved the refractive index, which is<br />
representative of the density as well as polycrystalline phase<br />
of the material.<br />
With respect to optical coating applications, only a<br />
handful of thin film materials have been experimented in<br />
order to achieve the refractive index tunability. There have<br />
been several research experiments concerning the most<br />
popular TiO 2 –SiO 2 system [5,12,13]. This system has an<br />
advantage of giving wide range of index tunability. However,<br />
the applicability of this composite system is limited to visible<br />
and near infrared wavelength region only, due to their band<br />
gap constraints. Crystallization and phase segregation in<br />
codeposited and alternating layered TiO 2 –SiO 2 films were<br />
studied by X-ray diffraction and TEM analysis [14]. The<br />
addition of small amounts of a glass forming solute (e.g.,<br />
SiO 2 ) into some oxides has reported to prevent crystallization<br />
of the host material. Admixture of SiO 2 into sputter<br />
deposited TiO 2 films was also observed to retard crystallization<br />
[15–17]. Below certain critical thickness (500 Å)<br />
crystallization in pure TiO 2 films is reported to be inhibited<br />
[18]. This has been attributed to the increasing role of surface<br />
energy as the area-to-volume ratio increases with decreasing<br />
film thickness. This implies that different ratios in mixing of<br />
the component materials can lead to different type of<br />
outcome in the evolution in microstructural as well as optical<br />
properties.<br />
In this work on a novel Gd 2 O 3 /SiO 2 composite thin film<br />
system similar effects are noticed in various films codeposited<br />
with different component ratios. It is worth mentioning that the<br />
gadolinia–silica (Gd 2 O 3 /SiO 2 ) combinations have recently<br />
drawn attention to develop deep ultraviolet optical coatings<br />
especially for excimer laser applications [19–21]. In the present<br />
study it is observed that it is possible to achieve a superior band<br />
gap in codeposited films so that its application can be extended<br />
well below the ArF laser (193 nm) wavelength. Presently only<br />
fluorides with poor index contrasts are being used to develop<br />
optical filters and coatings in this deep or extreme ultraviolet<br />
(DUV/EUV) spectral region [22–26]. The present codeposited<br />
system can be conveniently used to meet such challenging task<br />
through its superior properties related to refractive index as well<br />
as band gap tunability. Besides the index tunability, like most<br />
codeposited films, the present composite films have also<br />
demonstrated superior microstructural and morphological<br />
properties [27].<br />
The most interesting result in the microstructural properties<br />
of the present gadolinia–silica system is noticed at<br />
mixing ratios of 90:10 and 80:20 for Gd 2 O 3 :SiO 2 composition.<br />
Not only the refractive index increased to a better value<br />
than the pure Gd 2 O 3 but also a superior topography with<br />
more dense and fine morphological features was distinctly<br />
noticed. Although the mean index for each composite film<br />
follows a systematic somewhat linear trend with respect to<br />
the mixing ratios, a more detailed probe in to the<br />
microstructure revealed interesting growth dependent nonlinear<br />
behaviours in the spectral refractive index profiles.<br />
The appearance of such non-linear behaviour may be attributed<br />
to either due to the growth dependent microstructural<br />
changes or process-instability or combinations of both. Such<br />
changes have been very conveniently modeled through the<br />
phase modulated spectroscopic ellipsometric technique using<br />
Tauc–Lorentz (TL) parameterization.<br />
2. Tauc–Lorentz formulations for Gd 2 O 3 /SiO 2<br />
codeposited system<br />
Recent progress in ellipsometry instrumentation permits<br />
precise measurement and characterization of optical coating<br />
materials in the deep-UV wavelength range. Dielectric<br />
coating materials exhibit their first electronic interband<br />
transition in this spectral range. The Tauc–Lorentz model is a<br />
powerful tool with which it has now become extremely<br />
convenient to parameterize interband absorption above the<br />
band edge [28]. Although this model was derived for<br />
amorphous semiconductor, it can be conveniently applied<br />
to polycrystalline and nanocrystalline thin films as well [29].<br />
For example to model the dielectric functions in HfO 2 films,<br />
the Tauc–Lorentz dispersion was successfully adopted for the<br />
amorphous and polycrystalline films by Cho et al. [30]. The<br />
application of this model for the parameterization of the<br />
optical absorption of TiO 2 ,Ta 2 O 5 ,HfO 2 ,Al 2 O 3 and LaF 3<br />
polycrystalline thin-film materials has been described by von<br />
Blanckenhagen et al. [31].<br />
In Tauc–Lorentz (TL) formulation, for semiconductors<br />
and insulators, the imaginary part of the dielectric constant<br />
is determined by multiplying the Tauc joint density of states<br />
by e 2 obtained from the Lorentz oscillator model. The<br />
imaginary part of the dielectric constant is given as following<br />
[32]:<br />
e 2TL ðEÞ ¼<br />
AE0 CðE E g Þ 2 <br />
1<br />
ðE 2 E0 2 ; E > E ÞþC2 E 2 g ; (1)<br />
E<br />
e 2TL ðEÞ ¼0; E E g (2)<br />
The subscript TL indicates that the model is based on the<br />
Tauc joint density of state and Lorentz oscillator; the four<br />
fitting parameters are E g , A, E 0 and C, andallareinunitsof<br />
energy [33]. All these parameters have very special significances<br />
and contribute immensely to the dielectric function.<br />
For instance, E 0 is the peak transition energy, E g the band<br />
gapenergyandC is a broadening parameter, which can be<br />
related to the degree of disorder in the material. A is<br />
another parameter which is proportional to the height of<br />
e 2 , related to the film density. The real part of the dielectric<br />
function e 1 is obtained by Kramers–Kroning integration,<br />
given by [34]:<br />
e 1 ¼ jð1Þ þ 2 Z 1<br />
p P je 2 ðjÞ<br />
j 2 dj; (3)<br />
E2 E 2<br />
where the P stands for Cauchy principal part of the integral<br />
and an additional fitting parameter e 1TL (1) has been<br />
included. The integral is taken over the positive energies. The
+ Models<br />
4<br />
N.K. Sahoo et al. / Applied Surface Science xxx (2006) xxx–xxx<br />
integral can be solved in closed form and can be given by<br />
[35]:<br />
e 1TL ðEÞ ¼e 1TL ð1Þ þ 1 <br />
A C a ln E<br />
2<br />
0 þ Eg 2<br />
2 p & 4 ln<br />
þ aE <br />
g<br />
aE 0 E0 2 þ E2 g aE g<br />
<br />
A a tan<br />
2Eg þ a<br />
p:& 4 p a tan<br />
E 0 C<br />
2Eg þ a<br />
þ a tan<br />
þ 2 AE 0<br />
C<br />
p& 4 a<br />
<br />
<br />
E g ðE 2 g 2 Þ p þ 2a tan 2 g2 Eg<br />
2 <br />
aC<br />
where<br />
AE 0 C<br />
p& 4<br />
jE<br />
ln<br />
E 2 þ Eg<br />
2<br />
E<br />
<br />
jE<br />
p<br />
þ 2 AE 0C<br />
p& 4 E g ln<br />
þ 2 AE 0C<br />
p& 4 E g ln<br />
ffiffiffiffiffiffiffi<br />
ðE 2 0<br />
<br />
jE<br />
p<br />
ffiffiffiffiffiffiffi<br />
ðE 2 0<br />
<br />
Eg j<br />
E þ E g<br />
<br />
E g jðE þ E g Þ<br />
Eg 2Þ2 þ Eg 2C2 <br />
E g jðE þ E g Þ<br />
Eg 2Þ2 þ Eg 2C2 a ln ¼ðEg 2 E0 2 ÞE2 þ Eg 2 C2 E0 2 ðE2 0 þ 3E2 gÞ; (5a)<br />
a tan ¼ðE E 2 0 ÞðE2 0 þ E2 g ÞþE2 g C2 ; (5b)<br />
& 4 ¼ðE 2 g 2 Þ 2 þ b2 C 2<br />
4 ; (5c)<br />
qffiffiffiffiffiffiffiffiffiffiffiffiffiffiffiffiffiffiffi<br />
rffiffiffiffiffiffiffiffiffiffiffiffiffiffiffiffi<br />
b ¼ 4E0 2 C 2<br />
E0 2 C<br />
; g ¼<br />
2<br />
(5d)<br />
2<br />
Although the TL expression (Eqs. (1)–(3)) is empirical, it does<br />
satisfy the major criteria for models of most thin film dielectric<br />
functions. The TL expression is consistent with known physical<br />
phenomena, within the limitations of the model. Also, it should<br />
be mentioned that the TL model does not account for any<br />
absorption below the band gap, nor does it possess the correct<br />
high frequency limit. But in case of our present composite thin<br />
film system, the model has provided several useful information<br />
and parameters consistent with the results of the complementary<br />
characterization techniques.<br />
For the present codeposited composite Gd 2 O 3 /SiO 2 system<br />
one has to consider an effective dielectric function e if the<br />
individual dielectric strengths are e g and e s for Gd 2 O 3 and SiO 2 ,<br />
respectively. The effective dielectric strength e is then given by<br />
[36]:<br />
e ¼ 1 <br />
e g þ<br />
c s<br />
2 1 L ðe L<br />
s e g Þ e s<br />
1 L<br />
<br />
2 1=2 <br />
L c s<br />
þ e s e g<br />
1 L 1 L ðe L<br />
s e g Þ þ 4e g e s<br />
1 L<br />
This expression gives the dielectric constant of the composite<br />
thin film medium consisting of spheroidal particles of<br />
dielectric constant e s embedded in a dielectric constant of e g or<br />
(4)<br />
(6)<br />
vice versa. The shape of the spheroidal particles is described in<br />
terms of a form factor L, which assumes values 0 and 1.<br />
With these parameterizations, the refractive index n f and<br />
extinction coefficient k f of the codeposited Gd 2 O 3 /SiO 2 films<br />
obey the following equation:<br />
p<br />
ˆn f ¼ n f þ ik f ¼<br />
ffiffiffiffiffiffiffiffiffi<br />
êðEÞ<br />
(7)<br />
where<br />
ê ¼ e 1 þ ie 2 (8)<br />
With this substitution, the film refractive index n f (E), absorption<br />
coefficient k f (E) and absorption constant a(E) can be<br />
established from,<br />
½ðe<br />
2<br />
n f ðEÞ ¼ 1 þ e 2 1=2<br />
2 Þ1=2 þ e 1 Š<br />
(9)<br />
2<br />
½ðe<br />
2<br />
k f ðEÞ ¼ 1 þ e 2 2 Þ1=2<br />
2<br />
aðEÞ ¼ 4pk fðEÞ<br />
l<br />
¼<br />
2E<br />
hc<br />
1=2<br />
e 1 Š<br />
(10)<br />
½ðe<br />
2<br />
1 þ e 2 2 Þ1=2<br />
2<br />
<br />
e 1 Š 1=2<br />
(11)<br />
The inhomogeneities of the codeposited films are given by a<br />
profile of the complex refractive index ˆn f across these films.<br />
Such inhomogeneities have been probed using appropriate<br />
multilayer models.<br />
For our present Gd 2 O 3 /SiO 2 system, most of the composite<br />
films under TL formulations have demonstrated very small<br />
numerical values for the parameter ‘‘C’’, which implied a<br />
highly ordered structure in all these films with respect to their<br />
pure counterparts. The parameter ‘‘A’’ which is the representation<br />
of film density has shown substantial higher values for the<br />
codeposited films especially with a Gd 2 O 3 :SiO 2 compositions<br />
as 60:40. The pure gadolinia films demonstrated higher disorder<br />
parameter as well as lower film density and lower band gap<br />
values. By codeposition, all these microstructural parameters<br />
have been substantially improved depicting better film<br />
properties [37]. Some of the earlier research publications have<br />
very emphatically stated the microstructural densifications and<br />
void fraction reductions of composite films leading to superior<br />
refractive index and microstructural properties [38–40]. Soit<br />
can be easily inferred that by addition of SiO 2 in Gd 2 O 3 matrix,<br />
not only it lead to refractive index tunability but also superior<br />
stabilized composite phases are resulted. The mean refractive<br />
index profiles of pure Gd 2 O 3 film and composite films of<br />
compositions 90:10 and 80:20 of Gd 2 O 3 :SiO 2 have been<br />
depicted in Fig. 2. It can be distinctly noticed that the addition<br />
of 10–20% SiO 2 in to the Gd 2 O 3 system has enhanced the<br />
packing density and there by the spectral refractive index.<br />
Subsequent sections highlight more details on the experimental<br />
aspects of this codeposition process.<br />
3. Experimental<br />
Under the present investigation, we have carried out some<br />
systematic experiments and analysis of co-deposited thin films
+ Models<br />
N.K. Sahoo et al. / Applied Surface Science xxx (2006) xxx–xxx 5<br />
Fig. 2. Spectral mean refractive index profiles of the pure Gd 2 O 3 and the<br />
composite Gd 2 O 3 /SiO 2 thin films with the composition ratios of 90:10 and<br />
80:20. Composite film with 10% and 20% silica components have depicted a<br />
superior refractive index values supporting the morphological measurements<br />
presented in subsequent figures.<br />
of Gd 2 O 3 /SiO 2 system using phase modulated ellipsometry,<br />
spectrophotometry and multimode scanning probe microscope<br />
techniques. However, as mentioned above this research paper<br />
predominantly presents the results of ellipsometric measurements<br />
and analyses. The samples were deposited in a fully<br />
automatic thin film vacuum system ‘‘VERA-902’’ by adopting<br />
the reactive electron beam deposition technique. The depositions<br />
of the films were carried out using two 8KW VTD<br />
electron beam guns with sweep and automatic emission<br />
controls. The film materials for SiO 2 and Gd 2 O 3 were chosen<br />
from Cerac’s batch number ‘‘S-1060’’ (purity 99.99%) and ‘‘G-<br />
1076’’ (purity 99.9%), respectively. The substrate temperature<br />
was maintained at 70 8C for the deposited films. The total<br />
pressure inside the chamber during the deposition process was<br />
maintained at 1 10 4 mbar through MKS mass flow<br />
controllers. The constituents of the gases present during the<br />
deposition were analyzed by a residual gas analyzer (RGA)<br />
model; Pffeier’s Prisma-200. The film thicknesses were<br />
monitored both using the Leybold’s OMS-2000 optical<br />
thickness monitor (OTM) as well as Inficon’s XTC/2 quartz<br />
crystal monitors (QCM). The individual rates of depositions<br />
were very accurately monitored as well as controlled in<br />
automatic mode as per the requirements of the co-deposition<br />
process. The proportional, integration and differential (PID)<br />
parameters of the thickness as process control system were<br />
judiciously optimized in order to avoid unwanted rate<br />
fluctuations during codeposition processes. By such appropriate<br />
and accurate rate controls, it was possible to obtain<br />
Gd 2 O 3 /SiO 2 codeposited composite films with the desired<br />
compositions in the ranges of 10–90%. The entire deposition<br />
process parameters such as substrate temperature, optical<br />
thicknesses, rates of deposition, total reacting gas pressure were<br />
monitored and controlled by a Siemen’s industrial programmable<br />
logic controller (PLC) with appropriate front-end<br />
software. The co-deposited film optical thicknesses were<br />
decided to remain 6–8 quarter wave in order to obtain<br />
appropriate numbers of interference fringes for spectrophotometric<br />
as well as ellipsometric analysis techniques.<br />
For ellipsometric studies, Jobin Yvon’s phase modulated<br />
spectroscopic ellipsometer model UVISEL has been employed<br />
to analyze the growth dependent spectral optical properties. As<br />
described above Tauc–Lorentz (TL) formulation has been<br />
adopted to probe the co-deposited films for their refractive<br />
index profile using a discrete multilayer approach. For AFM<br />
characterization, <strong>NT</strong>-<strong>MDT</strong>’s solver P-47H multimode ambientbased<br />
scanning probe system has been utilized. The cantilever<br />
used was a Si 3 N 4 with typical spring constant of 0.6 N/m and<br />
resonant frequency of 75 KHz. We have adopted the contact<br />
mode operation without any image filtering technique for the<br />
topographic measurements. For Fourier analysis, the built-in<br />
FFT module of the control software ‘‘NOVA-SPM’’ was<br />
employed to generate the mappings. In order to have the<br />
consistency in the experimental results, the same cantilever was<br />
used for all the topographic measurements. All the co-deposited<br />
films were spectrally measured for their reflectance as well as<br />
transmittance characteristics using Shimadzu UV3101PC<br />
spectrophotometer system equipped with an integrating sphere<br />
accessory. The results of various characterization techniques<br />
have been presented in the subsequent section.<br />
4. Results and discussions<br />
In the present experiment, several codeposited films with the<br />
Gd 2 O 3 /SiO 2 compositions (Fig. 1) in the mixing range of<br />
10:90–90:10 have been prepared under certain predefined<br />
substrate temperature and oxygen partial pressure conditions<br />
decided through previous experiments. As mentioned above, in<br />
Fig. 2 the spectral refractive index profiles of pure Gd 2 O 3 and<br />
codeposited Gd 2 O 3 /SiO 2 with the compositions of 90:10 and<br />
80:20 have been depicted. In this figure it can be noticed the<br />
Fig. 3. Spectral mean refractive index profiles of the codeposited composite<br />
Gd 2 O 3 /SiO 2 thin films with various composition ratios in the mixing ratio<br />
ranges of 90:10–10:90. The computed mean refractive indices follow a systematic<br />
trend as per their mixing compositions.
+ Models<br />
6<br />
N.K. Sahoo et al. / Applied Surface Science xxx (2006) xxx–xxx<br />
Fig. 4. Spectral transmittances of composite Gd 2 O 3 /SiO 2 thin films for the<br />
compositions of 90:10, 40:60 and 10:90. The transmittance curve for 40:60<br />
(Gd 2 O 3 :SiO 2 ) composition displays interference peak modulation distinctly<br />
indicating inhomogeneity in the film growth properties.<br />
index profiles follow a very systematic trend as per the<br />
compositional mixings. Fig. 4 presents spectral transmission of<br />
three different codeposited films in which the respective<br />
transmittance amplitudes and band edge positions can be<br />
distinctly noticed. The spectral transmission for a Gd 2 O 3 /SiO 2<br />
composition of 40:60 depicted non-dispersive peak amplitudes<br />
highlighting the growth dependent non-linear refractive index<br />
characteristics. These aspects are also highlighted from the<br />
ellipsometric measurements. The band gap analysis results of<br />
all these composite sample films using TL parameterizations<br />
have been presented in Fig. 5. It can be noticed from the plots<br />
that as expected, the higher the SiO 2 composition, the higher is<br />
the band gap. The highest band gap value of 7.7 eV has been<br />
obtained for the codeposited film that carries Gd 2 O 3 /SiO 2<br />
compositions of 10:90. The band gap evolutions with respect to<br />
the mixing compositions have distinctly depicted a multi-slope<br />
behaviour. As pointed out earlier, it can be noticed from the<br />
spectrophotometric measurements that most of the films<br />
demonstrated some sort of microstructural inhomogeneities<br />
reflected in the spectral transmittance profiles. Such aspects<br />
mean spectral refractive index profile of the pure Gd 2 O 3 film<br />
lies below that of the codeposited composite films with Gd 2 O 3 /<br />
SiO 2 mixing ratios of 90:10 and 80:20. This is a very interesting<br />
situation, which generates a possibility of attaining superior<br />
optical properties from a high index material by stabilizing it<br />
with silica components. Such a situation is only possible where<br />
microstructural and morphological densifications override the<br />
chemical compositions or the stoichiometry. The mean<br />
refractive spectral indices of all these films computed using<br />
Tauc–Lorentz (TL) formulations, effective medium approximations<br />
(EMA) and multilayer modeling approach. The results<br />
of all the codeposited composite films have been presented in<br />
Fig. 3. It is to be emphasized that in spite of microstructural<br />
inhomogeneities developed in thicker films, the mean refractive<br />
Fig. 5. Band gap values of the composite films with respect to various mixing<br />
ratios of Gd 2 O 3 and SiO 2 . As expected all the codeposited composite films<br />
depicted superior band gaps.<br />
Fig. 6. Experimental and fitted ellipsometric data of the composite films with:<br />
(a) mixing ratio of 90:10 and (b) 40:60 of Gd 2 O 3 :SiO 2 . In the mixing ratio of<br />
40:60, the growth dependent non-linear properties are highlighted as spectral<br />
peak modulations of the C parameter.
+ Models<br />
N.K. Sahoo et al. / Applied Surface Science xxx (2006) xxx–xxx 7<br />
Table 1<br />
Tauc–Lorentz (TL) model<br />
Sample<br />
no.<br />
Compositions<br />
Gd 2 O 3 :SiO 2<br />
A<br />
(eV)<br />
E 0<br />
(eV)<br />
E g<br />
(eV)<br />
C<br />
(eV)<br />
S30 10:90 200.00 12.30 7.7 0.000001 0.410<br />
S29 20:80 171.21 12.49 7.68 0.013726 0.672<br />
S28 40:60 192.75 11.80 7.46 0.000001 0.825<br />
S27 50:50 202.00 11.80 7.40 0.00000001 0.564<br />
S25 60:40 213.00 11.85 7.30 0.000001 0.711<br />
S24 70:30 192.97 12.04 7.25 0.091331 0.795<br />
S23 80:20 200.00 11.21 6.62 0.000001 0.342<br />
S22 90:10 195.01 11.80 6.58 0.028252 0.300<br />
Gd 2 O 3 100:0 145.99 11.90 6.07 1.10 0.320<br />
Tauc–Lorentz fitting parameters for the various codeposited composite Gd 2 O 3 /<br />
SiO 2 films as well as pure Gd 2 O 3 film derived through ellipsometric analysis<br />
and modeling. The most important parameters A, E g and C are related to the film<br />
density, band gap and the film disorder, respectively.<br />
e 1<br />
were highlighted in the ellipsometric measurements as well.<br />
The origin of these inhomogeneities can be ascribed to the<br />
process dependent microstructural growth as well as due to<br />
process instabilities. It is well known that such optical<br />
inhomogeneities are best tackled by appropriate discrete<br />
multilayer models [41–44]. In view of this, the analyses of<br />
the spectral ellipsometric parameters were carried out using a<br />
multilayer approach that suits best to the present sample films<br />
characteristics. The results of modeling using TL formulations<br />
are presented in Table 1. It can be seen from this table that the<br />
composite films have superior parameters representing film<br />
density and ordered structure in comparison to pure Gd 2 O 3<br />
films. It was noticed that most of the composite films could be<br />
modeled with five to eight sub-layers in the systems. The<br />
goodness of fit to the parameter C and D justifies such a<br />
multilayer modeling approach. The results of two different<br />
composite films have been presented in Fig. 6(a and b). It can be<br />
Fig. 7. Multilayer ellipsometric modeling of the composite films with: (a)<br />
mixing ratio of 90:10 and (b) 40:60 of Gd 2 O 3 :SiO 2 . As expected the composite<br />
film with a mixing ratio of 40:60 depicted distinct non-linearity in the growth<br />
dependent non-linear refractive index profile.<br />
Fig. 8. Topographic properties of the composite film with: (a) mixing ratio of<br />
90:10 and (b) pure Gd 2 O 3 film. The mixed composite film has depicted a<br />
superior morphology with dense microstructure as compared to the pure Gd 2 O 3<br />
film.
+ Models<br />
8<br />
N.K. Sahoo et al. / Applied Surface Science xxx (2006) xxx–xxx<br />
Fig. 9. Mean refractive index evolution of the composite films at a wavelength<br />
of 500 nm with respect to the various compositional mixing ratios. It can be<br />
noticed that the presence of certain amount of SiO 2 (10–20%) in the composite<br />
film has increased the effective refractive index values.<br />
noticed from Fig. 6(b) that the plot of C has demonstrated a<br />
non-dispersive spectral behaviour, which is dominantly due to<br />
the non-linear inhomogeneities appeared during the growth of<br />
this film. Fig. 7(a and b) depict the results of the multilayer<br />
models adopted for the above two composite films. Both the<br />
films have been modeled using eight (8) sub-layers in the<br />
system. Fig. 7(b) depicted a more prominent non-linearity in<br />
the growth of the refractive index profile. It is worth mentioning<br />
that such ellipsometric spectral characteristics cannot be fit<br />
using a single layer model. The topography results for pure<br />
Gd 2 O 3 and codeposited films with Gd 2 O 3 :SiO 2 as 90:10 are<br />
presented in Fig. 8(a and b). It can be noticed that composite<br />
film at this composition of 90:10 has demonstrated superior<br />
morphology with a rms value of 3.53 nm in comparison to the<br />
pure thin films of Gd 2 O 3 , which has rms value 4.2 nm. The<br />
grains are much smaller and well packed compared to the pure<br />
Gd 2 O 3 film. The interesting microstructural developments<br />
round about this composition need further investigations and<br />
task of our future plans. At present, however, it can be inferred<br />
that such a condition in superior film properties might be due to<br />
stabilization of thin film phase to a different one compared to<br />
the pure film. The mean spectral refractive index profile with<br />
respect to different Gd 2 O 3 /SiO 2 compositions is depicted in<br />
Fig. 9. It distinctly indicates a rise in the refractive index for the<br />
composition 90:10 that supports the morphological as well as<br />
ellipsometric results. Besides, this plot indicated a non-linear<br />
growth in the refractive index profile with respect to various<br />
compositions in the codeposited films.<br />
5. Conclusion<br />
The codeposited composite films of Gd 2 O 3 /SiO 2 have been<br />
analysed for their optical properties primarily by phasemodulated<br />
ellipsometry. The spectral refractive index profiles<br />
and band gap values of the films were derived from the Tauc–<br />
Lorentz formulations. Morphological properties have been<br />
acquired using a multimode scanning probe microscope<br />
technique. It was noticed that almost all the composite films<br />
have superior band gap as well as morphologies. The best<br />
optical parameters were obtained for the composite film that<br />
carries a mixing ratio of 90:10 of Gd 2 O 3 :SiO 2 . Under this<br />
composition both the refractive index as well as band gap<br />
demonstrated superior numerical values with respect to the pure<br />
gadolinia films. The presence of 10–20% SiO 2 in gadolinia<br />
matrix has resulted into microstructural densifications as<br />
observed in some composite thin film systems. Such a<br />
composition required more probing in order to understand<br />
the superior film properties of the composite system. The<br />
compositional band gap variations have distinctly depicted<br />
different slopes in their evolutions with respect to the<br />
compositions. Such a result clearly indicates that microstructural<br />
properties do not follow a linear trend with respect to the<br />
mixing compositions. This behavior is due to the fact that the<br />
microstructure, which strongly affects opto-mechanical properties,<br />
does not vary linearly with composition. As pointed out<br />
earlier, factors such as bond strengths, chemical environment of<br />
the atoms and grains, surface mobility of the species during<br />
deposition and both short- and long-range order can induce a<br />
microstructure that is unique to the mixed composition film.<br />
Acknowledgements<br />
The authors wish to acknowledge the contribution of Mr. A.<br />
Biswas of Spectroscopy Division in carrying out ellipsometric<br />
measurements of all these samples and Mr. M. Senthilkumar for<br />
the AFM measurements. The authors also wish to acknowledge<br />
the support and encouragement of Dr. R.P. Shukla, former<br />
Head, Spectroscopy Division, Bhabha Atomic Research<br />
Centre, Mumbai during the course of this work.<br />
References<br />
[1] J.G. Yoon, H.K. Oh, Y.J. Kwag, J. Kor. Phys. Soc. 33 (1998) 699.<br />
[2] W.H. Southwell, Appl. Opt. 24 (1985) 457.<br />
[3] P.G. Verly, Appl. Opt. 37 (1998) 7327.<br />
[4] J.M. Yang, C.Y. Kao, Appl. Opt. 40 (2001) 3256.<br />
[5] R. Bertram, M.F. Ouellette, P.Y. Tse, Appl. Opt. 28 (1989) 2935.<br />
[6] N.S. Gluck, H. Sankur, J. Heuer, J. DeNatale, W.J. Gunning, J. Appl. Phys.<br />
69 (1991) 3037.<br />
[7] R. Jacobson, J.O. Martensson, Appl. Opt. 5 (1966) 29.<br />
[8] P. Camagni, P. Galinetto, G. Samoggia, Solid State Commun. 83 (1992)<br />
943.<br />
[9] M.A. Taylor, M. Kilo, G. Borchardt, S. Weber, H. Scherrer, J. Eur. Ceram.<br />
Soc. 25 (2005) 1591.<br />
[10] G.A. Niklasson, C.G. Granqvist, O. Hunderi, Appl. Opt. 20 (1981) 26.<br />
[11] H. Sankur, W. Gunning, J. DeNatale, Appl. Opt. 27 (1988) 1564.<br />
[12] A. Alvarez-Herrero, G. Ramos, F. del Monte, E. Bernabeu, D. Levy, Thin<br />
Solid Films 455–456 (2004) 356.<br />
[13] V.V. Kriventsova, D.I. Kochubeya, M.V. Tsodikovb, J.A. Navioc, G.M.<br />
Restrepod, M. Maciasc, Nucl. Instrum. Meth. Phys. Res. A 470 (2001)<br />
347.<br />
[14] H. Sankur, W. Gunning, J. Appl. Phys. 66 (1989) 807.<br />
[15] E.N. Farabaugh, E.M. Sanders, J. Vac. Sci. Technol. A 1 (1983) 356.<br />
[16] E.N. Farabaugh, A. Feldman, J. Sun, Y.N. Sun, J. Vac. Sci. Technol. A 5<br />
(1987) 1671.<br />
[17] H. Sankur, W. Gunning, J. Appl. Phys. 66 (1989) 4747.
+ Models<br />
N.K. Sahoo et al. / Applied Surface Science xxx (2006) xxx–xxx 9<br />
[18] D.G. Howitt, A.B. Harker, J. Mater. Sci. 2 (1987) 201.<br />
[19] N.K. Sahoo, M. Senthilkumar, S. Thakur, D. Bhattacharyya, Appl. Surf.<br />
Sci. 200 (2002) 219.<br />
[20] N.K. Sahoo, S. Thakur, M. Senthilkumar, D. Bhattacharyya, N.C. Das,<br />
Thin Solid Films 440 (2003) 155.<br />
[21] A.A. Dakhel, J. Opt. A, Pure Appl. Opt. 3 (2001) 452.<br />
[22] B. Bates, D.J. Bradley, Appl. Opt. 5 (1966) 971.<br />
[23] A.P. Bradford, G. Hass, J.F. Osantowski, A.R. Tort, Appl. Opt. 8 (1969)<br />
1183.<br />
[24] F. Rainer, W.H. Lowdermilk, D. Milam, C.K. Carniglia, T.T. Hart, T.L.<br />
Lichtenstein, Appl. Opt. 24 (1985) 496.<br />
[25] E. Quesnel, L. Dumas, D. Jacob, F. Peiró, J. Vac. Sci. Technol. A 18 (2000)<br />
2869.<br />
[26] E. Eva, K. Mann, N. Kaiser, B. Anton, R. Henking, D. Ristau, P.<br />
Weissbrodt, D. Mademann, L. Raupach, E. Hacker, Appl. Opt. 35<br />
(1996) 5613.<br />
[27] A. Portinha, V. Teixeira, J. Carneiroa, M.F. Costa, N.P. Barradas, A.D.<br />
Sequeira, Surf. Coat. Technol. 188–189 (2004) 107.<br />
[28] H. Lee, I.Y. Kim, S.S. Han, B.S. Bae, M.K. Choi, I.S. Yang, J. Appl. Phys.<br />
90 (2001) 813.<br />
[29] A.V. Osipov, F. Schmitt, P. Hess, Thin Solid Films 472 (2005) 31.<br />
[30] Y.J. Cho, N.V. Nguyen, C.A. Richter, J.R. Ehrstein, B.H. Lee, J.C. Lee,<br />
Appl. Phys. Lett. 80 (2002) 1249.<br />
[31] B. von Blanckenhagen, D. Tonova, J. Ullmann, Appl. Opt. 41 (2002) 3137.<br />
[32] H. Chen, W.Z. Shena, Eur. Phys. J. B 43 (2005) 503.<br />
[33] A.C. Diebold, J. Canterbury, W. Chism, C. Richter, N. Nguyen, J. Ehrstein,<br />
C. Weintraub, Mater. Sci. Semicond. Process. 4 (2001) 3.<br />
[34] G.E. Jellison Jr., V.I. Merkulov, A.A. Puretzky, D.B. Geohegan, G.<br />
Eres, D.H. Lowndes, J.B. Caughman, Thin Solid Films 377–378 (2000)<br />
68.<br />
[35] G.E. Jellison Jr., F.A. Modine, Appl. Phys. Lett. 69 (1996) 371.<br />
[36] R. Jacobson, Inhomogeneous and coevaporated homogeneous films for<br />
optical applications, in: G. Hass, M.H. Francombe, R.W. Hoffman (Eds.),<br />
Physics of Thin Films, vol. 8, Academic Press, New York, 1975, pp. 51–<br />
98.<br />
[37] N. Jun, G. Binglin, Comp. Phys. Commun. 147 (2002) 234.<br />
[38] A. Feldman, E.N. Farabaugh, W.K. Haller, D.M. Sanders, R.A. Stempniak,<br />
J. Vac. Sci. Technol. A 4 (1986) 2969.<br />
[39] F. Tcheliebou, A. Boyer, L. Martin, Thin Solid Films 249 (1994) 86.<br />
[40] W.H. Koo, S.M. Jeong, S.H. Choi, H.K. Baik, S.J. Lee, S.M. Lee, J. Vac.<br />
Sci. Technol. A 22 (2004) 2048.<br />
[41] A.V. Tikhonravov, M.K. Trubetskov, A.V. Krasilnikova, Appl. Opt. 37<br />
(1998) 5902.<br />
[42] P. Chindaudom, K. Vedam, Appl. Opt. 33 (1994) 2664.<br />
[43] G.P. de Lariviere, J.M. Frigerio, J. Rivory, F. Abeles, Appl. Opt. 31 (1992)<br />
6056.<br />
[44] A.V. Tikhonravov, M.K. Trubetskov, B.T. Sullivan, J.A. Dobrowolski,<br />
Appl. Opt. 36 (1997) 7188.