Average level of satisfaction in 10 European countries - Erasmus ...
Average level of satisfaction in 10 European countries - Erasmus ...
Average level of satisfaction in 10 European countries - Erasmus ...

You also want an ePaper? Increase the reach of your titles
YUMPU automatically turns print PDFs into web optimized ePapers that Google loves.
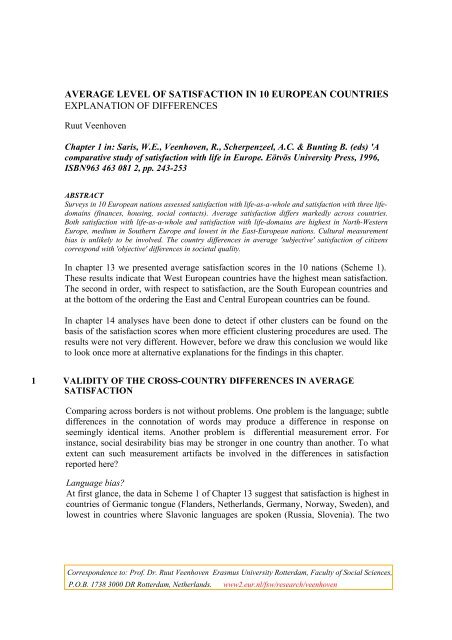
AVERAGE LEVEL OF SATISFACTION IN <strong>10</strong> EUROPEAN COUNTRIES<br />
EXPLANATION OF DIFFERENCES<br />
Ruut Veenhoven<br />
Chapter 1 <strong>in</strong>: Saris, W.E., Veenhoven, R., Scherpenzeel, A.C. & Bunt<strong>in</strong>g B. (eds) 'A<br />
comparative study <strong>of</strong> <strong>satisfaction</strong> with life <strong>in</strong> Europe. Eötvös University Press, 1996,<br />
ISBN963 463 081 2, pp. 243-253<br />
ABSTRACT<br />
Surveys <strong>in</strong> <strong>10</strong> <strong>European</strong> nations assessed <strong>satisfaction</strong> with life-as-a-whole and <strong>satisfaction</strong> with three lifedoma<strong>in</strong>s<br />
(f<strong>in</strong>ances, hous<strong>in</strong>g, social contacts). <strong>Average</strong> <strong>satisfaction</strong> differs markedly across <strong>countries</strong>.<br />
Both <strong>satisfaction</strong> with life-as-a-whole and <strong>satisfaction</strong> with life-doma<strong>in</strong>s are highest <strong>in</strong> North-Western<br />
Europe, medium <strong>in</strong> Southern Europe and lowest <strong>in</strong> the East-<strong>European</strong> nations. Cultural measurement<br />
bias is unlikely to be <strong>in</strong>volved. The country differences <strong>in</strong> average 'subjective' <strong>satisfaction</strong> <strong>of</strong> citizens<br />
correspond with 'objective' differences <strong>in</strong> societal quality.<br />
In chapter 13 we presented average <strong>satisfaction</strong> scores <strong>in</strong> the <strong>10</strong> nations (Scheme 1).<br />
These results <strong>in</strong>dicate that West <strong>European</strong> <strong>countries</strong> have the highest mean <strong>satisfaction</strong>.<br />
The second <strong>in</strong> order, with respect to <strong>satisfaction</strong>, are the South <strong>European</strong> <strong>countries</strong> and<br />
at the bottom <strong>of</strong> the order<strong>in</strong>g the East and Central <strong>European</strong> <strong>countries</strong> can be found.<br />
In chapter 14 analyses have been done to detect if other clusters can be found on the<br />
basis <strong>of</strong> the <strong>satisfaction</strong> scores when more efficient cluster<strong>in</strong>g procedures are used. The<br />
results were not very different. However, before we draw this conclusion we would like<br />
to look once more at alternative explanations for the f<strong>in</strong>d<strong>in</strong>gs <strong>in</strong> this chapter.<br />
1 VALIDITY OF THE CROSS-COUNTRY DIFFERENCES IN AVERAGE<br />
SATISFACTION<br />
Compar<strong>in</strong>g across borders is not without problems. One problem is the language; subtle<br />
differences <strong>in</strong> the connotation <strong>of</strong> words may produce a difference <strong>in</strong> response on<br />
seem<strong>in</strong>gly identical items. Another problem is differential measurement error. For<br />
<strong>in</strong>stance, social desirability bias may be stronger <strong>in</strong> one country than another. To what<br />
extent can such measurement artifacts be <strong>in</strong>volved <strong>in</strong> the differences <strong>in</strong> <strong>satisfaction</strong><br />
reported here?<br />
Language bias?<br />
At first glance, the data <strong>in</strong> Scheme 1 <strong>of</strong> Chapter 13 suggest that <strong>satisfaction</strong> is highest <strong>in</strong><br />
<strong>countries</strong> <strong>of</strong> Germanic tongue (Flanders, Netherlands, Germany, Norway, Sweden), and<br />
lowest <strong>in</strong> <strong>countries</strong> where Slavonic languages are spoken (Russia, Slovenia). The two<br />
Correspondence to: Pr<strong>of</strong>. Dr. Ruut Veenhoven <strong>Erasmus</strong> University Rotterdam, Faculty <strong>of</strong> Social Sciences,<br />
P.O.B. 1738 3000 DR Rotterdam, Netherlands. www2.eur.nl/fsw/research/veenhoven
Ruut Veenhoven 2 Level <strong>of</strong> <strong>satisfaction</strong> <strong>in</strong> <strong>10</strong> <strong>countries</strong><br />
<strong>countries</strong> where Romanic languages are spoken (Italy, Spa<strong>in</strong>) appear <strong>in</strong> the middle<br />
position. However, at a closer look we see that <strong>satisfaction</strong> is also high <strong>in</strong> Belgium-<br />
Wallonia, where a Romanic language is spoken (French). This is <strong>in</strong> l<strong>in</strong>e with earlier<br />
studies <strong>in</strong> Canada which have shown that French speak<strong>in</strong>g Canadians do not score<br />
lower on <strong>satisfaction</strong> scales than English speak<strong>in</strong>g Canadians (Blishen and Atk<strong>in</strong>son,<br />
1980). The low <strong>satisfaction</strong> <strong>in</strong> Hungary cannot be attributed to language either. The<br />
Hungarian language is close to F<strong>in</strong>nish, but the <strong>level</strong> <strong>of</strong> <strong>satisfaction</strong> <strong>in</strong> F<strong>in</strong>land is closer<br />
to the (high) <strong>level</strong> <strong>in</strong> Norway and Sweden, than to the <strong>level</strong> <strong>of</strong> <strong>satisfaction</strong> <strong>in</strong> Hungary<br />
(Veenhoven, 1992: 202).<br />
It is thus unlikely that variation <strong>in</strong> language is responsible for all the differences <strong>in</strong><br />
<strong>satisfaction</strong> observed here. Still, it is possible that some language-distortion is <strong>in</strong>volved.<br />
If so, such effects will show <strong>in</strong> residual variation, when <strong>satisfaction</strong> is regressed on<br />
quality <strong>of</strong> life. In <strong>countries</strong> where the word '<strong>satisfaction</strong>' is used rather easily, average<br />
<strong>satisfaction</strong> should appear more satisfied than predicted, on the basis <strong>of</strong> their liv<strong>in</strong>g<br />
conditions. Whereas, <strong>in</strong> <strong>countries</strong> where the term denotes higher demands, average<br />
<strong>satisfaction</strong> will be below prediction. In this context it is worth tak<strong>in</strong>g a look at Scheme 1,<br />
which presents a plot <strong>of</strong> life-<strong>satisfaction</strong> aga<strong>in</strong>st <strong>in</strong>come per head <strong>in</strong> the country. The<br />
residuals appear to be small; all cases are close to the regression l<strong>in</strong>e. That does not<br />
suggest a considerable <strong>in</strong>fluence for language. Moreover, the pattern <strong>of</strong> residuals does<br />
not show systematic differences <strong>in</strong> language-families. Three <strong>countries</strong> where Germanic<br />
languages are spoken appear above the regression l<strong>in</strong>e (Netherlands, Norway, Sweden),<br />
but one (Germany) appears to be less satisfied than its <strong>level</strong> <strong>of</strong> affluence would predict.<br />
Social desirability bias?<br />
All responses to questions on <strong>satisfaction</strong> are probably affected by desirability-bias;<br />
especially questions adm<strong>in</strong>istered <strong>in</strong> a face-to-face <strong>in</strong>terviews. If this bias is about<br />
equally strong everywhere, there is no problem for cross-national comparison.<br />
However, if the bias is stronger <strong>in</strong> one country than another, it can seriously distort the<br />
picture. This study did not <strong>in</strong>volve items about the desirability <strong>of</strong> be<strong>in</strong>g satisfied or not,<br />
so we cannot check this possibility on our data. However, the <strong>European</strong> Value Study did<br />
<strong>in</strong>volve such items. In an earlier analysis <strong>of</strong> that study, Veenhoven (1994: 139) found no<br />
higher life-<strong>satisfaction</strong> <strong>in</strong> nations where <strong>satisfaction</strong> is valued most (r=+.00). Five<br />
nations <strong>in</strong>volved <strong>in</strong> the <strong>European</strong> Value Study are <strong>in</strong>volved <strong>in</strong> the present study as well:<br />
Belgium, Germany, Italy, Netherlands and Spa<strong>in</strong>. The <strong>European</strong> Value Study found<br />
<strong>satisfaction</strong> to be least desirable <strong>in</strong> Italy, and most desirable <strong>in</strong> Spa<strong>in</strong>. Belgium,<br />
Germany and the Netherlands scored <strong>in</strong> between. If these differences <strong>in</strong> the moral<br />
desirability <strong>of</strong> be<strong>in</strong>g satisfied do distort reports <strong>of</strong> <strong>satisfaction</strong>, it is likely to be<br />
manifested <strong>in</strong> the residuals. Italians will then report less <strong>satisfaction</strong> than expected on<br />
the basis <strong>of</strong> quality <strong>of</strong> life <strong>in</strong> that country, and the Spanish will report more <strong>satisfaction</strong>.<br />
That pattern does not appear <strong>in</strong> the residuals <strong>of</strong> Scheme 1 either. Though Italians are<br />
<strong>in</strong>deed slightly less happy than expected on the basis <strong>of</strong> their wealth, the Spanish are not<br />
more satisfied. The deviations <strong>of</strong> Germany and the Netherlands also do not fit the<br />
expected pattern.
Ruut Veenhoven 3 Level <strong>of</strong> <strong>satisfaction</strong> <strong>in</strong> <strong>10</strong> <strong>countries</strong><br />
Plausibility <strong>of</strong> further measurement bias<br />
Obviously, more sources <strong>of</strong> differential measurement error can be <strong>in</strong>volved. It is not<br />
easy to check all possible distortions. Yet we can obta<strong>in</strong> a global <strong>in</strong>dication <strong>of</strong> the<br />
validity <strong>of</strong> the observed differences <strong>in</strong> life-<strong>satisfaction</strong> by compar<strong>in</strong>g it with life-expectancy.<br />
<strong>Average</strong> life-expectancy also <strong>in</strong>dicates how well people flourish <strong>in</strong> a country, but<br />
its measurement is not vulnerable to response bias. If responses to survey questions<br />
about <strong>satisfaction</strong> are heavily biased, we can expect little correlation with lifeexpectancy.<br />
Cases (<strong>countries</strong>) <strong>of</strong> great distortion will show up <strong>in</strong> eccentric positions <strong>in</strong><br />
the scatter-plot.<br />
Scheme 2 presents the scatter-plot <strong>of</strong> average life <strong>satisfaction</strong> and average lifeexpectancy<br />
<strong>in</strong> the ten nations. The correlation is high: r=+.82 (p
Ruut Veenhoven 4 Level <strong>of</strong> <strong>satisfaction</strong> <strong>in</strong> <strong>10</strong> <strong>countries</strong><br />
Livability-theory assumes that <strong>satisfaction</strong>-with-life depends on quality-<strong>of</strong>-life; the<br />
better the liv<strong>in</strong>g-conditions <strong>in</strong> a country, the more satisfied its <strong>in</strong>habitants will be. 'Good'<br />
liv<strong>in</strong>g-conditions are presumed to be conditions that fit human nature well. Livabilitytheory<br />
is closely connected to the idea that there are universal human needs. It sees<br />
human societies as collective arrangements for need-gratification, and assumes that<br />
societies can be more or less effective <strong>in</strong> this respect. Gratification <strong>of</strong> needs is seen to<br />
result <strong>in</strong> positive affect, frustration <strong>in</strong> negative affective experience. In its turn, affective<br />
tone would determ<strong>in</strong>e appraisals <strong>of</strong> <strong>satisfaction</strong> (I feel good so I must be satisfied). (See<br />
Chapter 1; the section concern<strong>in</strong>g the determ<strong>in</strong>ants <strong>of</strong> life <strong>satisfaction</strong>).<br />
Comparison-theory and folklore-theory imply that 'subjective' <strong>satisfaction</strong> <strong>in</strong> nations<br />
will bear little relationship with 'objective' quality-<strong>of</strong>-life. On the other hand, livabilitytheory<br />
predicts a close relationship with it. This cross-national study allows an<br />
empirical test <strong>of</strong> these implications.<br />
3 SATISFACTION WITH LIFE DOMAINS AND QUALITY OF LIVING<br />
CONDITIONS<br />
This study assessed <strong>satisfaction</strong> with three life-doma<strong>in</strong>s: <strong>satisfaction</strong> with one's f<strong>in</strong>ancial<br />
situation, <strong>satisfaction</strong> with hous<strong>in</strong>g and <strong>satisfaction</strong> with social contacts. From other<br />
sources we have <strong>in</strong>dications <strong>of</strong> the actual quality which nations provide <strong>in</strong> the first two<br />
doma<strong>in</strong>s; <strong>in</strong>come per head <strong>in</strong> the country and number <strong>of</strong> persons per dwell<strong>in</strong>g.<br />
Unfortunately, we have no comparable data on density and quality <strong>of</strong> social contacts.<br />
In Scheme 3 these estimates <strong>of</strong> 'real' <strong>in</strong>come per capita are plotted aga<strong>in</strong>st average<br />
<strong>satisfaction</strong> with f<strong>in</strong>ances. A clear relationship appears: <strong>satisfaction</strong> with f<strong>in</strong>ances is<br />
lower <strong>in</strong> the poorer nations and higher <strong>in</strong> the richer ones; r=+.92 (p
Ruut Veenhoven 5 Level <strong>of</strong> <strong>satisfaction</strong> <strong>in</strong> <strong>10</strong> <strong>countries</strong><br />
As there are no comparable data regard<strong>in</strong>g social contacts <strong>in</strong> the nations exam<strong>in</strong>ed here,<br />
we cannot check whether the observed differences <strong>in</strong> subjective <strong>satisfaction</strong> with social<br />
contacts correspond with objective differences <strong>in</strong> quality <strong>of</strong> contacts.<br />
4 SATISFACTION WITH LIFE AND QUALITY OF SOCIETY<br />
In Chapter 1 we have reviewed studies that showed higher <strong>satisfaction</strong> with life as a<br />
whole <strong>in</strong> nations that provide better quality <strong>of</strong> life. Table 5 showed sizable correlations<br />
with ‘material comfort’, ‘social equality’, ‘political freedom’ and ‘access to<br />
knowledge’. The present study found similar relations between life <strong>satisfaction</strong> and<br />
nation characteristics. As we have seen earlier <strong>in</strong> this chapter, average life <strong>satisfaction</strong> is<br />
closely l<strong>in</strong>ked to <strong>in</strong>come per head (Scheme 1). The correlation is +.93. We also<br />
considered the relationship between life <strong>satisfaction</strong> and <strong>in</strong>come- <strong>in</strong>equality. In this case<br />
no correlation exists (r = -.05 ns). Remember that f<strong>in</strong>ancial <strong>satisfaction</strong> was not related<br />
to <strong>in</strong>come-<strong>in</strong>equality either (Scheme 3). Apparently, <strong>level</strong> <strong>of</strong> <strong>in</strong>come matters more than<br />
<strong>in</strong>come differences <strong>in</strong> the country. The importance <strong>of</strong> material comfort is also reflected<br />
<strong>in</strong> a sizable correlation with quality <strong>of</strong> hous<strong>in</strong>g. The more persons per household <strong>in</strong> a<br />
country, the lower the average life <strong>satisfaction</strong> (r = -.60). In fact, persons per dwell<strong>in</strong>g<br />
correlates equally strong with life <strong>satisfaction</strong> as with hous<strong>in</strong>g <strong>satisfaction</strong> (Scheme 5).<br />
Lastly, we also explored the relationship <strong>of</strong> average life <strong>satisfaction</strong> with ‘human rights’<br />
<strong>in</strong> the country. Data on that latter matter were found with Gupta et. al. (1994). A<br />
positive relationship appears. The more human rights are respected <strong>in</strong> a country, the<br />
higher average life <strong>satisfaction</strong> (r = +.85).<br />
The above discussed relation between average life <strong>satisfaction</strong> and quality <strong>of</strong> society are<br />
summarized <strong>in</strong> Scheme 6. The results were largely <strong>in</strong> l<strong>in</strong>e with livability theory. The<br />
better the liv<strong>in</strong>g conditions <strong>in</strong> a country, the more satisfied people are with the<br />
concerned liv<strong>in</strong>g doma<strong>in</strong>s and with life as a whole. The only exception is <strong>in</strong>come<strong>in</strong>equality.<br />
Apparently this matter is <strong>of</strong> m<strong>in</strong>or importance: at least <strong>in</strong> the fairly equal<br />
<strong>countries</strong> studied here. More detailed analysis on a broader dataset are reported <strong>in</strong><br />
Veenhoven (1995).<br />
5 CONCLUSIONS<br />
We have seen that the very strong relationship between liv<strong>in</strong>g conditions and<br />
<strong>satisfaction</strong> <strong>level</strong>s across <strong>countries</strong> cannot be discounted as method artifacts. On the<br />
other hand, we have given more evidence for the relationship between liv<strong>in</strong>g conditions<br />
and <strong>satisfaction</strong> <strong>level</strong>s across <strong>countries</strong>. Together, these f<strong>in</strong>d<strong>in</strong>gs leave no doubt that<br />
<strong>satisfaction</strong> is firmly l<strong>in</strong>ked to 'objective' quality <strong>of</strong> life. As such these observations<br />
confirm livability-theory. The data do not meet the above mentioned implications<br />
predicted from comparison-theory and folklore-theory.
Ruut Veenhoven 6 Level <strong>of</strong> <strong>satisfaction</strong> <strong>in</strong> <strong>10</strong> <strong>countries</strong><br />
Scheme 1.<br />
Plot <strong>of</strong> average life <strong>satisfaction</strong> by <strong>in</strong>come per head <strong>in</strong> nations.<br />
l<br />
i<br />
f 8,5<br />
e<br />
* Netherlands<br />
8 Norway * * Belgium<br />
s<br />
a 7,5 Sweden * Germany *<br />
t<br />
* Italy<br />
I 7<br />
s<br />
* Spa<strong>in</strong><br />
f 6,5 Slovenia*<br />
a<br />
Russia*<br />
c 6<br />
t<br />
* Hungary<br />
I 5,5<br />
o<br />
n 5<br />
5 7 9 11 13 15 17 19 21<br />
<strong>in</strong>come per head ($ x <strong>10</strong>00) r = + .93 (p < .001)<br />
Data: <strong>in</strong>come per head: UNPD 1994
Ruut Veenhoven 7 Level <strong>of</strong> <strong>satisfaction</strong> <strong>in</strong> <strong>10</strong> <strong>countries</strong><br />
Scheme 2.<br />
Plot <strong>of</strong> average life <strong>satisfaction</strong> by life expectancy <strong>in</strong> nations.<br />
8,5<br />
Netherlands *<br />
l<br />
* Belgium * Norway<br />
I 8<br />
f Sweden *<br />
e<br />
* Germany<br />
7,5<br />
s<br />
a<br />
t 7 * Italy<br />
I<br />
s Spa<strong>in</strong> *<br />
f 6,5<br />
a<br />
Russia*<br />
c<br />
t 6 * Hungary<br />
I<br />
o<br />
n 5,5<br />
69 70 71 72 73 74 75 76 77 78<br />
life expectancy (average <strong>in</strong> years) r = + .82 (p < .01)<br />
Data life expectancy: UNDP 1994
Ruut Veenhoven 8 Level <strong>of</strong> <strong>satisfaction</strong> <strong>in</strong> <strong>10</strong> <strong>countries</strong><br />
Scheme 3.<br />
Plot <strong>of</strong> average <strong>in</strong>come-<strong>satisfaction</strong> by <strong>in</strong>come-<strong>level</strong> <strong>in</strong> nations.<br />
s<br />
a<br />
t<br />
i 8<br />
s<br />
* Netherlands<br />
f 7,5 Germany *<br />
a Belgium *<br />
c 7 Sweden *<br />
t<br />
* Italy<br />
i 6,5 * Norway<br />
o<br />
n 6<br />
f 5,5<br />
i Russia ** * Spa<strong>in</strong><br />
n 5 Slovenia<br />
a<br />
n 4,5 * Hungary<br />
c<br />
e 4<br />
5 7 9 11 13 15 17 19 21<br />
<strong>in</strong>come per head ($ x <strong>10</strong>00) r = + .92 (p < .001)<br />
Data <strong>in</strong>come per head: UNDP 1994
Ruut Veenhoven 9 Level <strong>of</strong> <strong>satisfaction</strong> <strong>in</strong> <strong>10</strong> <strong>countries</strong><br />
Scheme 4.<br />
Plot <strong>of</strong> average <strong>in</strong>come-<strong>satisfaction</strong> by <strong>in</strong>come-<strong>in</strong>equality <strong>in</strong> nations.<br />
s<br />
a<br />
t<br />
i 8<br />
s<br />
f 7,5 * Netherlands<br />
a<br />
* Germany<br />
c 7 * Belgium * Sweden<br />
t<br />
* Italy<br />
i 6,5 * Norway<br />
o<br />
n 6<br />
f 5,5<br />
i<br />
n 5 Spa<strong>in</strong> ** Slovenia<br />
a<br />
n 4,5 * Hungary<br />
c<br />
e 4<br />
0,29 0,31 0,33 0,35 0,37 0,39 0,41<br />
<strong>in</strong>come <strong>in</strong>equality (G<strong>in</strong>i)<br />
r = -.<strong>10</strong> (ns)
Ruut Veenhoven <strong>10</strong> Level <strong>of</strong> <strong>satisfaction</strong> <strong>in</strong> <strong>10</strong> <strong>countries</strong><br />
Scheme 5.<br />
Plot <strong>of</strong> average hous<strong>in</strong>g-<strong>satisfaction</strong> by hous<strong>in</strong>g condition <strong>in</strong> nations.<br />
9<br />
s<br />
a<br />
t<br />
* Sweden * Norway<br />
i 8 * Netherlands<br />
s<br />
* Belgium<br />
f * * Italy<br />
a<br />
Germany<br />
c 7<br />
t Slovenia *<br />
i<br />
* Spa<strong>in</strong><br />
o<br />
n 6 Russia *<br />
h<br />
o<br />
u 5<br />
s<br />
i<br />
* Hungary<br />
n<br />
g 4<br />
2 2,5 3 3,5 4<br />
persons per household (number)<br />
r = -.46 (ns)
Ruut Veenhoven 11 Level <strong>of</strong> <strong>satisfaction</strong> <strong>in</strong> <strong>10</strong> <strong>countries</strong><br />
Scheme 6.<br />
Quality <strong>of</strong> society and average <strong>satisfaction</strong> <strong>in</strong> <strong>10</strong> <strong>European</strong> <strong>countries</strong>.<br />
_____________________________________________________________<br />
Indicators <strong>of</strong> <strong>satisfaction</strong> <strong>satisfaction</strong> <strong>satisfaction</strong> <strong>satisfaction</strong><br />
quality <strong>of</strong> society with with with with<br />
f<strong>in</strong>ance hous<strong>in</strong>g contact life<br />
_____________________________________________________________<br />
<strong>in</strong>come per head .92 .87 .59 .93<br />
<strong>in</strong>come-<strong>in</strong>equality -.<strong>10</strong> .27 -.00 -.05<br />
persons per dwell<strong>in</strong>g -.51 -.47 .07 -.60<br />
human rights .50 .29 .05 .58<br />
_____________________________________________________________<br />
REFERENCES<br />
Blishen, B. and T. Atk<strong>in</strong>son (1980).<br />
Anglophone and Francophone differences <strong>in</strong> perceptions <strong>of</strong> quality <strong>of</strong> life <strong>in</strong> Canada.<br />
In: Szalai, A. and F. Andrews (Eds.) The Quality <strong>of</strong> Life, London: Sage, 25-39.<br />
The Economist (1990).<br />
Book <strong>of</strong> vital world statistics.<br />
London: Random house.<br />
Gupta, D. K., A. J. Jongman and A. P. Schmid (1994).<br />
Creat<strong>in</strong>g a composite <strong>in</strong>dex for assess<strong>in</strong>g country-performance <strong>in</strong> the field <strong>of</strong> human<br />
rights.<br />
Human Rights Quarterly, 16, 131-162.<br />
Inglehart, R. (1990).<br />
Culture shift <strong>in</strong> advanced <strong>in</strong>dustrial society.<br />
New York: Pr<strong>in</strong>ceton University Press.<br />
Ostroot, N. and W. Snyder (1985).<br />
Measur<strong>in</strong>g cultural bias <strong>in</strong> a cross-national study.<br />
Social <strong>in</strong>dicators Research, 17, 243-251.<br />
UNPD (1990).<br />
Human Development Report 1990.<br />
Oxford: Oxford University Press.
Ruut Veenhoven 12 Level <strong>of</strong> <strong>satisfaction</strong> <strong>in</strong> <strong>10</strong> <strong>countries</strong><br />
UNPD (1994)<br />
Human Development Report 1994.<br />
Oxford: Oxford University Press.<br />
Veenhoven, R. (1993b)<br />
Happ<strong>in</strong>ess <strong>in</strong> Nations.<br />
RISBO, Rotterdam: <strong>Erasmus</strong> University Rotterdam.<br />
Veenhoven, R. (1994a).<br />
Is happ<strong>in</strong>ess a trait? Tests <strong>of</strong> the theory that a better society does not make people any<br />
happier.<br />
Social Indicators Research, 32, <strong>10</strong>1-160.<br />
Veenhoven, R. (1995b).<br />
The cross-national pattern <strong>of</strong> happ<strong>in</strong>ess: Test <strong>of</strong> predictions implied <strong>in</strong> three theories <strong>of</strong><br />
happ<strong>in</strong>ess.<br />
Social Indicators Research, 34, 33-68.