Brochure in PDF - SPM Instrument
Brochure in PDF - SPM Instrument
Brochure in PDF - SPM Instrument

You also want an ePaper? Increase the reach of your titles
YUMPU automatically turns print PDFs into web optimized ePapers that Google loves.
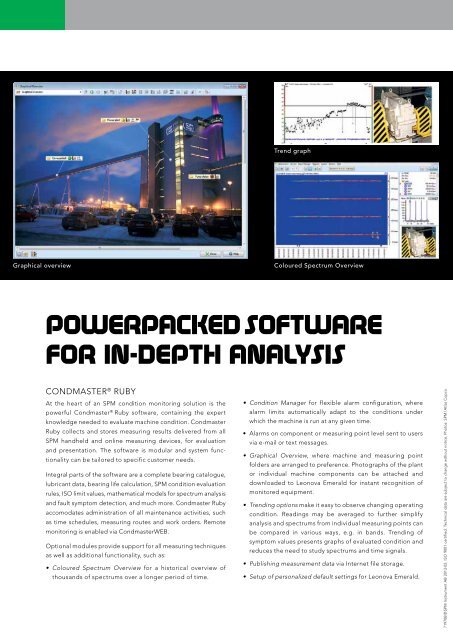
Trend graph<br />
Graphical overview<br />
Coloured Spectrum Overview<br />
powerpacked software<br />
for <strong>in</strong>-depth analysis<br />
conDmAster ® ruby<br />
At the heart of an spm condition monitor<strong>in</strong>g solution is the<br />
powerful condmaster ® ruby software, conta<strong>in</strong><strong>in</strong>g the expert<br />
knowledge needed to evaluate mach<strong>in</strong>e condition. condmaster<br />
ruby collects and stores measur<strong>in</strong>g results delivered from all<br />
spm handheld and onl<strong>in</strong>e measur<strong>in</strong>g devices, for evaluation<br />
and presentation. the software is modular and system functionality<br />
can be tailored to specific customer needs.<br />
<strong>in</strong>tegral parts of the software are a complete bear<strong>in</strong>g catalogue,<br />
lubricant data, bear<strong>in</strong>g life calculation, spm condition evaluation<br />
rules, iso limit values, mathematical models for spectrum analysis<br />
and fault symptom detection, and much more. condmaster ruby<br />
accomodates adm<strong>in</strong>istration of all ma<strong>in</strong>tenance activities, such<br />
as time schedules, measur<strong>in</strong>g routes and work orders. remote<br />
monitor<strong>in</strong>g is enabled via condmasterweb.<br />
optional modules provide support for all measur<strong>in</strong>g techniques<br />
as well as additional functionality, such as:<br />
• Coloured Spectrum Overview for a historical overview of<br />
thousands of spectrums over a longer period of time.<br />
• Condition Manager for flexible alarm configuration, where<br />
alarm limits automatically adapt to the conditions under<br />
which the mach<strong>in</strong>e is run at any given time.<br />
• Alarms on component or measur<strong>in</strong>g po<strong>in</strong>t level sent to users<br />
via e-mail or text messages.<br />
• Graphical Overview, where mach<strong>in</strong>e and measur<strong>in</strong>g po<strong>in</strong>t<br />
folders are arranged to preference. photographs of the plant<br />
or <strong>in</strong>dividual mach<strong>in</strong>e components can be attached and<br />
downloaded to leonova emerald for <strong>in</strong>stant recognition of<br />
monitored equipment.<br />
• Trend<strong>in</strong>g options make it easy to observe chang<strong>in</strong>g operat<strong>in</strong>g<br />
condition. read<strong>in</strong>gs may be averaged to further simplify<br />
analysis and spectrums from <strong>in</strong>dividual measur<strong>in</strong>g po<strong>in</strong>ts can<br />
be compared <strong>in</strong> various ways, e.g. <strong>in</strong> bands. trend<strong>in</strong>g of<br />
symptom values presents graphs of evaluated condition and<br />
reduces the need to study spectrums and time signals.<br />
• Publish<strong>in</strong>g measurement data via <strong>in</strong>ternet file storage.<br />
• Setup of personalized default sett<strong>in</strong>gs for leonova emerald.<br />
71970b © spm <strong>in</strong>strument Ab 2013-02. iso 9001 certified. technical data are subject to change without notice. photos: spm/Atlas copco
![[Machine Guard MG-4] - SPM Instrument](https://img.yumpu.com/26505839/1/184x260/machine-guard-mg-4-spm-instrument.jpg?quality=85)