Survey of the Competitive Aspects of Oil and Oil ... - Poyry.co.uk
Survey of the Competitive Aspects of Oil and Oil ... - Poyry.co.uk
Survey of the Competitive Aspects of Oil and Oil ... - Poyry.co.uk
You also want an ePaper? Increase the reach of your titles
YUMPU automatically turns print PDFs into web optimized ePapers that Google loves.
SURVEY OF THE COMPETITIVE ASPECTS OF OIL AND OIL PRODUCT MARKETS IN THE EU<br />
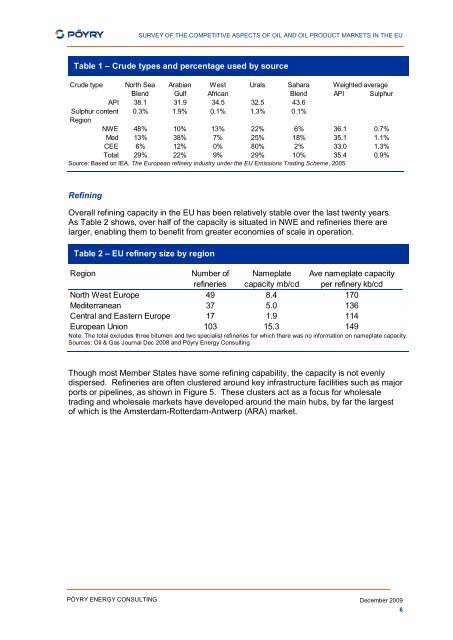
Table 1 – Crude types <strong>and</strong> percentage used by source<br />
Crude type North Sea Arabian West Urals Sahara Weighted average<br />
Blend Gulf African<br />
Blend API Sulphur<br />
API 38.1 31.9 34.5 32.5 43.6<br />
Sulphur <strong>co</strong>ntent 0.3% 1.9% 0.1% 1.3% 0.1%<br />
Region<br />
NWE 48% 10% 13% 22% 6% 36.1 0.7%<br />
Med 13% 38% 7% 25% 18% 35.1 1.1%<br />
CEE 6% 12% 0% 80% 2% 33.0 1.3%<br />
Total 29% 22% 9% 29% 10% 35.4 0.9%<br />
Source: Based on IEA, The European refinery industry under <strong>the</strong> EU Emissions Trading Scheme, 2005<br />
Refining<br />
Overall refining capacity in <strong>the</strong> EU has been relatively stable over <strong>the</strong> last twenty years.<br />
As Table 2 shows, over half <strong>of</strong> <strong>the</strong> capacity is situated in NWE <strong>and</strong> refineries <strong>the</strong>re are<br />
larger, enabling <strong>the</strong>m to benefit from greater e<strong>co</strong>nomies <strong>of</strong> scale in operation.<br />
Table 2 – EU refinery size by region<br />
Region<br />
Number <strong>of</strong><br />
refineries<br />
Nameplate<br />
capacity mb/cd<br />
Ave nameplate capacity<br />
per refinery kb/cd<br />
North West Europe 49 8.4 170<br />
Mediterranean 37 5.0 136<br />
Central <strong>and</strong> Eastern Europe 17 1.9 114<br />
European Union 103 15.3 149<br />
Note: The total excludes three bitumen <strong>and</strong> two specialist refineries for which <strong>the</strong>re was no information on nameplate capacity.<br />
Sources: <strong>Oil</strong> & Gas Journal Dec 2008 <strong>and</strong> Pöyry Energy Consulting<br />
Though most Member States have some refining capability, <strong>the</strong> capacity is not evenly<br />
dispersed. Refineries are <strong>of</strong>ten clustered around key infrastructure facilities such as major<br />
ports or pipelines, as shown in Figure 5. These clusters act as a focus for wholesale<br />
trading <strong>and</strong> wholesale markets have developed around <strong>the</strong> main hubs, by far <strong>the</strong> largest<br />
<strong>of</strong> which is <strong>the</strong> Amsterdam-Rotterdam-Antwerp (ARA) market.<br />
PÖYRY ENERGY CONSULTING<br />
December 2009<br />
6


