Survey of the Competitive Aspects of Oil and Oil ... - Poyry.co.uk
Survey of the Competitive Aspects of Oil and Oil ... - Poyry.co.uk
Survey of the Competitive Aspects of Oil and Oil ... - Poyry.co.uk

You also want an ePaper? Increase the reach of your titles
YUMPU automatically turns print PDFs into web optimized ePapers that Google loves.
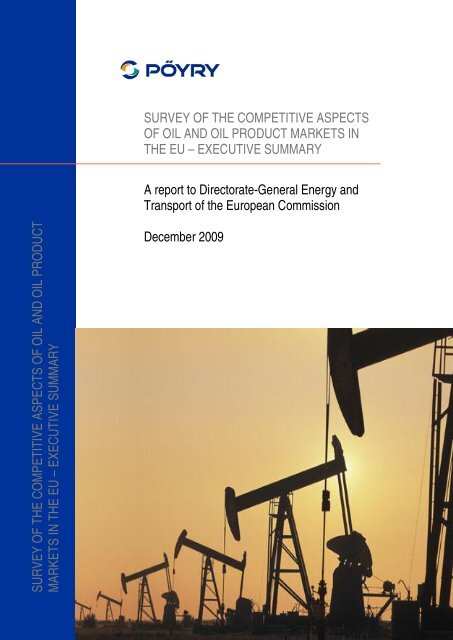
SURVEY OF THE COMPETITIVE ASPECTS<br />
OF OIL AND OIL PRODUCT MARKETS IN<br />
THE EU – EXECUTIVE SUMMARY<br />
A report to Directorate-General Energy <strong>and</strong><br />
Transport <strong>of</strong> <strong>the</strong> European Commission<br />
SURVEY OF THE COMPETITIVE ASPECTS OF OIL AND OIL PRODUCT<br />
MARKETS IN THE EU – EXECUTIVE SUMMARY<br />
December 2009
SURVEY OF THE COMPETITIVE ASPECTS OF OIL AND OIL PRODUCT MARKETS IN THE EU<br />
Pöyry Energy Consulting is Europe's leading energy <strong>co</strong>nsultancy providing strategic,<br />
<strong>co</strong>mmercial, regulatory <strong>and</strong> policy advice to Europe's energy markets. Part <strong>of</strong> Pöyry Plc,<br />
<strong>the</strong> global engineering <strong>and</strong> <strong>co</strong>nsulting firm, Pöyry Energy Consulting merges <strong>the</strong><br />
expertise <strong>of</strong> ILEX Energy Consulting, ECON <strong>and</strong> Convergence Utility Consultants with<br />
<strong>the</strong> management <strong>co</strong>nsulting arms <strong>of</strong> Electrowatt-Ekono <strong>and</strong> Verbundplan. Our team <strong>of</strong><br />
250 energy specialists, located across 15 European <strong>of</strong>fices in 12 <strong>co</strong>untries, <strong>of</strong>fers<br />
unparalleled expertise in <strong>the</strong> rapidly changing energy sector.<br />
Pöyry is a global <strong>co</strong>nsulting <strong>and</strong> engineering firm focusing on <strong>the</strong> energy, forest industry,<br />
infrastructure <strong>and</strong> environment sectors.<br />
Copyright © 2009 E<strong>co</strong>n Pöyry AB<br />
All rights reserved<br />
No part <strong>of</strong> this publication may be reproduced, stored in a retrieval system or transmitted in any<br />
form or by any means electronic, mechanical, photo<strong>co</strong>pying, re<strong>co</strong>rding or o<strong>the</strong>rwise without <strong>the</strong><br />
prior written permission <strong>of</strong> E<strong>co</strong>n Pöyry AB.<br />
Where tables, figures <strong>and</strong> charts are not specifically sourced <strong>the</strong>y should be attributed to Pöyry<br />
Energy Consulting.<br />
PÖYRY ENERGY CONSULTING<br />
December 2009
SURVEY OF THE COMPETITIVE ASPECTS OF OIL AND OIL PRODUCT MARKETS IN THE EU<br />
EXECUTIVE SUMMARY<br />
Introduction<br />
Over <strong>the</strong> last five years, <strong>co</strong>mmercial <strong>and</strong> retail fuel prices across <strong>the</strong> EU have risen<br />
significantly only to fall dramatically during <strong>the</strong> last half <strong>of</strong> 2008. This is illustrated in Figure<br />
1 below, which shows <strong>the</strong> volatile movements in <strong>the</strong> EU average pre-tax retail price <strong>of</strong><br />
gasoline, diesel <strong>and</strong> heating oil, over <strong>the</strong> period 1999 to 2009. As can be seen, <strong>the</strong><br />
volatility over <strong>the</strong> last five years <strong>co</strong>ntrasts with <strong>the</strong> previous five year period across all<br />
products.<br />
Figure 1 – EU weighted average pre tax retail fuel prices<br />
90<br />
Euro cents per litre (nominal)<br />
80<br />
70<br />
60<br />
50<br />
40<br />
30<br />
20<br />
Gasoline<br />
Diesel<br />
Heating oil<br />
10<br />
0<br />
Jan-99<br />
Jul-99<br />
Jan-00<br />
Jul-00<br />
Jan-01<br />
Jul-01<br />
Jan-02<br />
Jul-02<br />
Jan-03<br />
Jul-03<br />
Jan-04<br />
Jul-04<br />
Jan-05<br />
Jul-05<br />
Jan-06<br />
Jul-06<br />
Jan-07<br />
Jul-07<br />
Jan-08<br />
Jul-08<br />
Jan-09<br />
Source: EU <strong>Oil</strong> Bulletin<br />
Though movements in <strong>the</strong> average price broadly track <strong>the</strong> price <strong>of</strong> crude oil, <strong>the</strong>re is a<br />
wide variation in <strong>the</strong> level <strong>and</strong> change <strong>of</strong> retail prices across <strong>the</strong> Member States. This is<br />
illustrated for gasoline in Figure 2 <strong>and</strong> similar variations are observed for diesel <strong>and</strong><br />
heating oil.<br />
PÖYRY ENERGY CONSULTING<br />
December 2009<br />
1
SURVEY OF THE COMPETITIVE ASPECTS OF OIL AND OIL PRODUCT MARKETS IN THE EU<br />
Figure 2 – Variations in gasoline prices across <strong>co</strong>untries, net <strong>of</strong> tax<br />
11%<br />
Annual change in retail price 2005 to 2008<br />
10%<br />
9%<br />
8%<br />
7%<br />
6%<br />
5%<br />
SE<br />
FR<br />
SI<br />
EE<br />
UK<br />
SK<br />
DE<br />
PL<br />
AT<br />
FI<br />
CZ<br />
LV<br />
BEPT<br />
HU CY<br />
IE<br />
LT ES IT<br />
DK<br />
GR<br />
LU<br />
NL<br />
MT<br />
4%<br />
40 45 50 55 60 65 70<br />
Retail price in 2008 €cents/litre<br />
Source: EU <strong>Oil</strong> Bulletin<br />
The level <strong>of</strong> prices, toge<strong>the</strong>r with <strong>the</strong> extent <strong>and</strong> speed <strong>of</strong> observed price movements, is<br />
driven by <strong>the</strong> interaction between <strong>the</strong> underlying <strong>co</strong>st <strong>of</strong> supplying <strong>the</strong> product <strong>and</strong> <strong>the</strong><br />
effectiveness <strong>and</strong> form <strong>of</strong> <strong>co</strong>mpetition throughout <strong>the</strong> supply chain. Given <strong>the</strong> importance<br />
<strong>of</strong> oil for <strong>the</strong> e<strong>co</strong>nomies <strong>of</strong> <strong>the</strong> EU (oil-based products ac<strong>co</strong>unted for around 42% <strong>of</strong> EU<br />
final energy <strong>co</strong>nsumption in 2006), <strong>the</strong> efficient <strong>and</strong> <strong>co</strong>mpetitive operation <strong>of</strong> <strong>the</strong><br />
downstream oil products market in <strong>the</strong> EU is important for domestic <strong>and</strong> industrial<br />
<strong>co</strong>nsumers as well as for overall EU <strong>co</strong>mpetitiveness.<br />
Approach <strong>of</strong> <strong>the</strong> study<br />
The overall aim <strong>of</strong> <strong>the</strong> study has been to investigate <strong>the</strong> extent to which <strong>the</strong> markets for<br />
gasoline, diesel <strong>and</strong> heating oil are <strong>co</strong>mpetitive <strong>and</strong> well-functioning 1 . Of particular<br />
interest in this <strong>co</strong>ntext were <strong>the</strong> following:<br />
• Is <strong>the</strong>re evidence <strong>of</strong> horizontal or vertical integration <strong>and</strong> has it facilitated <strong>co</strong>mpetition<br />
or introduced barriers?<br />
• Is <strong>the</strong> wholesale trading market efficient?<br />
• Is <strong>the</strong>re evidence <strong>of</strong> market integration across Member States?<br />
• Have market dynamics (i.e., entry <strong>and</strong> exit <strong>of</strong> firms) been <strong>co</strong>nsistent with <strong>co</strong>mpetitive<br />
pressures?<br />
1<br />
Due to <strong>the</strong> vast number <strong>of</strong> products it has been necessary to prioritise <strong>the</strong> most important<br />
ones. The selection has been based on <strong>the</strong> relative importance to society.<br />
PÖYRY ENERGY CONSULTING<br />
December 2009<br />
2
SURVEY OF THE COMPETITIVE ASPECTS OF OIL AND OIL PRODUCT MARKETS IN THE EU<br />
We have followed two <strong>co</strong>mplementary str<strong>and</strong>s <strong>of</strong> analysis to identify potential indicators <strong>of</strong><br />
distortions to <strong>the</strong> efficient operation <strong>of</strong> <strong>the</strong> market:<br />
• a review <strong>of</strong> <strong>the</strong> operation, structure <strong>and</strong> <strong>co</strong>ntractual relationships within <strong>the</strong><br />
downstream supply chain – focussing on <strong>the</strong> potential barriers raised by horizontal or<br />
vertical integration; <strong>and</strong><br />
• a quantitative assessment <strong>of</strong> <strong>the</strong> key price-<strong>co</strong>st relationships within <strong>the</strong> market – to<br />
determine whe<strong>the</strong>r prices are <strong>co</strong>st reflective, as would be expected in a <strong>co</strong>mpetitive<br />
market.<br />
The pricing analysis reviewed <strong>and</strong> <strong>co</strong>mpared trends in product prices (wholesale <strong>and</strong><br />
retail), gross retail margins (GRM) <strong>and</strong> refining <strong>and</strong> product (crack) spreads across<br />
regions <strong>and</strong> <strong>co</strong>untries. Where differences in price or margin behaviour were identified<br />
fur<strong>the</strong>r investigation was undertaken to establish if this was a <strong>co</strong>nsequence <strong>of</strong> underlying<br />
<strong>co</strong>st <strong>co</strong>nditions or an indicator <strong>of</strong> market distortions or failures.<br />
The investigations drew on <strong>the</strong> market structure review <strong>and</strong> <strong>the</strong> relationships throughout<br />
<strong>the</strong> supply chain <strong>and</strong> focussed around indicators <strong>of</strong> three broad drivers <strong>of</strong> pricing<br />
behaviour:<br />
• <strong>co</strong>st structure – for example, <strong>the</strong> level <strong>of</strong> fixed <strong>co</strong>sts, scale e<strong>co</strong>nomies realised <strong>and</strong><br />
transport <strong>co</strong>sts;<br />
• market structure – for example, <strong>the</strong> extent <strong>of</strong> horizontal <strong>and</strong> vertical integration within<br />
market; <strong>and</strong><br />
• business models – for example, whe<strong>the</strong>r <strong>the</strong>re is evidence <strong>of</strong> price <strong>and</strong> margin<br />
pressures on businesses through <strong>the</strong> existence <strong>of</strong> innovative or low-<strong>co</strong>st <strong>co</strong>mpetitors<br />
such as hypermarkets or pure-play refiners.<br />
In addition, fur<strong>the</strong>r qualitative assessment <strong>of</strong> potential regulatory barriers <strong>and</strong> recent<br />
<strong>co</strong>mpetition law cases was carried out. Where inefficiencies or distortions in pricing<br />
behaviour were identified, estimates <strong>of</strong> <strong>the</strong> associated adverse welfare impact (measured<br />
by lost <strong>co</strong>nsumer surplus <strong>and</strong> deadweight loss) were provided through application <strong>of</strong> a<br />
simple welfare analysis.<br />
A substantial data <strong>co</strong>llection exercise has underpinned <strong>the</strong> analysis. Much <strong>of</strong> <strong>the</strong><br />
information has been obtained from established sources <strong>and</strong> reference points in <strong>the</strong><br />
downstream market that analyse <strong>and</strong> report on prices <strong>and</strong> key performance indicators,<br />
including crude oil <strong>and</strong> wholesale product prices, refining <strong>and</strong> retail margins 2 .<br />
Overview <strong>of</strong> <strong>the</strong> supply chain<br />
Figure 3 shows a stylised representation <strong>of</strong> <strong>the</strong> downstream oil product supply chain,<br />
detailing <strong>the</strong> physical flows <strong>of</strong> crude oil <strong>and</strong> product through <strong>the</strong> system alongside <strong>the</strong><br />
supporting <strong>co</strong>ntractual relationships. The key physical stages are:<br />
• <strong>the</strong> purchase <strong>of</strong> crude oil;<br />
• refining <strong>of</strong> crude oil into a range <strong>of</strong> products;<br />
• distribution <strong>and</strong> storage <strong>of</strong> <strong>the</strong> refined products; <strong>and</strong><br />
2<br />
Six main sources were used during <strong>the</strong> study to ensure a degree <strong>of</strong> <strong>co</strong>nsistency in <strong>the</strong><br />
datasets. These were Platts <strong>and</strong> Argus for crude oil <strong>and</strong> product pricing, <strong>Oil</strong> <strong>and</strong> Gas<br />
Journal <strong>and</strong> (OGJ) <strong>and</strong> Concawe for refinery statistics, <strong>the</strong> International Energy Agency<br />
(IEA) for refinery margins <strong>and</strong> Experian Catalist for retail site data.<br />
PÖYRY ENERGY CONSULTING<br />
December 2009<br />
3
SURVEY OF THE COMPETITIVE ASPECTS OF OIL AND OIL PRODUCT MARKETS IN THE EU<br />
• marketing <strong>and</strong> retail to end-users.<br />
The wholesale product market sits alongside this physical chain as a means to obtain<br />
agreement <strong>of</strong> <strong>co</strong>ntractual relationships between refiners <strong>and</strong> distributors/retailers/large<br />
users <strong>and</strong> facilitate <strong>co</strong>mpetition through <strong>the</strong> removal <strong>of</strong> barriers to entry in both activities.<br />
We have investigated <strong>the</strong> operation within <strong>and</strong> between each <strong>of</strong> <strong>the</strong>se elements <strong>of</strong> <strong>the</strong><br />
supply chain <strong>and</strong> key findings are summarised below.<br />
Figure 3 – <strong>Oil</strong> products supply chain<br />
Crude oil purchase <strong>and</strong> import<br />
Mature, global traded market<br />
Refining<br />
Simple/<strong>co</strong>mplex<br />
Distribution <strong>and</strong> storage<br />
Pipeline, barge, rail, road<br />
Wholesale product<br />
market<br />
Marketing <strong>and</strong> retail<br />
Gasoline, diesel, heating oil<br />
Domestic, <strong>co</strong>mmercial, industrial, public services<br />
physical flows<br />
<strong>co</strong>ntractual flows<br />
Crude oil purchase<br />
Though <strong>the</strong> <strong>co</strong>mpetitiveness <strong>of</strong> <strong>the</strong> crude oil market is outside <strong>the</strong> s<strong>co</strong>pe <strong>of</strong> this study,<br />
some knowledge <strong>of</strong> <strong>the</strong> features <strong>of</strong> this market <strong>and</strong> <strong>of</strong> crude oil itself is necessary as <strong>the</strong>y<br />
have a major impact on <strong>the</strong> <strong>co</strong>st <strong>of</strong> production (both as a raw material <strong>and</strong> through <strong>the</strong><br />
associated refining requirements).<br />
The European Union is highly import-dependent. Though <strong>the</strong>re are indigenous sources –<br />
predominantly from <strong>the</strong> North Sea, Romania <strong>and</strong> nor<strong>the</strong>rn Italy – <strong>the</strong>y cannot meet EU<br />
requirements 3 . Key import sources include <strong>the</strong> Former Soviet Union, <strong>the</strong> Middle East <strong>and</strong><br />
nor<strong>the</strong>rn Africa.<br />
This diversity in potential sources <strong>of</strong> crude means refineries in different geographic<br />
locations will use different crude oils, sourcing that to which <strong>the</strong>y have easiest access.<br />
Throughout <strong>the</strong> report, <strong>the</strong> European oil product market is divided into three regions for<br />
discussions <strong>of</strong> refining <strong>and</strong> wholesale product markets – North West Europe (NWE), <strong>the</strong><br />
Mediterranean (MED) <strong>and</strong> <strong>the</strong> Central <strong>and</strong> Eastern Europe (CEE), as shown in Figure 4.<br />
This division is based on <strong>the</strong> <strong>co</strong>nsideration <strong>of</strong> transportation infrastructure, distribution<br />
markets <strong>and</strong> accessibility to different crude streams. For example, North Sea crude<br />
blends ac<strong>co</strong>unt for around a half <strong>of</strong> that used in refineries in NWE, whereas 80% <strong>of</strong> <strong>the</strong><br />
crude in <strong>the</strong> CEE is Urals crude (see Table 1).<br />
3<br />
This situation has deteriorated in recent years with rising dem<strong>and</strong> <strong>and</strong> falling production.<br />
PÖYRY ENERGY CONSULTING<br />
December 2009<br />
4
SURVEY OF THE COMPETITIVE ASPECTS OF OIL AND OIL PRODUCT MARKETS IN THE EU<br />
Figure 4 – <strong>Oil</strong> product regions in Europe<br />
These differences are important as crude oil is not a homogeneous product. In particular,<br />
crude will vary in its sulphur <strong>co</strong>ntent <strong>and</strong> its gravity, or thickness, as shown in Table 1.<br />
These characteristics affect <strong>the</strong> value <strong>of</strong> <strong>the</strong> crude as <strong>the</strong>y determine <strong>the</strong> effort required to<br />
extract higher value refined product <strong>and</strong> meet required sulphur st<strong>and</strong>ards. Light crudes<br />
with low sulphur <strong>co</strong>ntent, such as Brent, tend to attract a premium over heavier crudes<br />
such as Urals.<br />
PÖYRY ENERGY CONSULTING<br />
December 2009<br />
5
SURVEY OF THE COMPETITIVE ASPECTS OF OIL AND OIL PRODUCT MARKETS IN THE EU<br />
Table 1 – Crude types <strong>and</strong> percentage used by source<br />
Crude type North Sea Arabian West Urals Sahara Weighted average<br />
Blend Gulf African<br />
Blend API Sulphur<br />
API 38.1 31.9 34.5 32.5 43.6<br />
Sulphur <strong>co</strong>ntent 0.3% 1.9% 0.1% 1.3% 0.1%<br />
Region<br />
NWE 48% 10% 13% 22% 6% 36.1 0.7%<br />
Med 13% 38% 7% 25% 18% 35.1 1.1%<br />
CEE 6% 12% 0% 80% 2% 33.0 1.3%<br />
Total 29% 22% 9% 29% 10% 35.4 0.9%<br />
Source: Based on IEA, The European refinery industry under <strong>the</strong> EU Emissions Trading Scheme, 2005<br />
Refining<br />
Overall refining capacity in <strong>the</strong> EU has been relatively stable over <strong>the</strong> last twenty years.<br />
As Table 2 shows, over half <strong>of</strong> <strong>the</strong> capacity is situated in NWE <strong>and</strong> refineries <strong>the</strong>re are<br />
larger, enabling <strong>the</strong>m to benefit from greater e<strong>co</strong>nomies <strong>of</strong> scale in operation.<br />
Table 2 – EU refinery size by region<br />
Region<br />
Number <strong>of</strong><br />
refineries<br />
Nameplate<br />
capacity mb/cd<br />
Ave nameplate capacity<br />
per refinery kb/cd<br />
North West Europe 49 8.4 170<br />
Mediterranean 37 5.0 136<br />
Central <strong>and</strong> Eastern Europe 17 1.9 114<br />
European Union 103 15.3 149<br />
Note: The total excludes three bitumen <strong>and</strong> two specialist refineries for which <strong>the</strong>re was no information on nameplate capacity.<br />
Sources: <strong>Oil</strong> & Gas Journal Dec 2008 <strong>and</strong> Pöyry Energy Consulting<br />
Though most Member States have some refining capability, <strong>the</strong> capacity is not evenly<br />
dispersed. Refineries are <strong>of</strong>ten clustered around key infrastructure facilities such as major<br />
ports or pipelines, as shown in Figure 5. These clusters act as a focus for wholesale<br />
trading <strong>and</strong> wholesale markets have developed around <strong>the</strong> main hubs, by far <strong>the</strong> largest<br />
<strong>of</strong> which is <strong>the</strong> Amsterdam-Rotterdam-Antwerp (ARA) market.<br />
PÖYRY ENERGY CONSULTING<br />
December 2009<br />
6
SURVEY OF THE COMPETITIVE ASPECTS OF OIL AND OIL PRODUCT MARKETS IN THE EU<br />
Figure 5 – Map <strong>of</strong> refinery clusters<br />
Though capacity has been stable, <strong>the</strong> market has not been stagnant. There have been<br />
changes in ownership, including <strong>the</strong> establishment <strong>of</strong> several pure-play refiners such as<br />
Petroplus, Ineos <strong>and</strong> SARAS. We have also seen asset swaps, divestments <strong>and</strong><br />
acquisitions within <strong>the</strong> EU as players alter <strong>the</strong>ir portfolio positions <strong>and</strong> geographic focus,<br />
such as BP’s exit from <strong>the</strong> UK refining market <strong>and</strong> increase in capacity in <strong>the</strong> German<br />
market through <strong>the</strong> acquisition <strong>of</strong> Veba. As <strong>the</strong> relationships between NOCs <strong>and</strong><br />
governments in <strong>the</strong> MED <strong>and</strong> CEE regions alter over time, we may anticipate fur<strong>the</strong>r<br />
changes within <strong>the</strong>se regions.<br />
As <strong>of</strong> 2009, <strong>the</strong> top six refinery players in <strong>the</strong> EU ac<strong>co</strong>unt for around 50% <strong>of</strong> capacity (see<br />
Figure 6), but <strong>the</strong> market itself is not overly <strong>co</strong>ncentrated when assessed using a st<strong>and</strong>ard<br />
measure <strong>of</strong> market <strong>co</strong>ncentration such as <strong>the</strong> Herfindahl-Hirschmann Index (HHI).<br />
Interestingly, <strong>the</strong> main players differ between <strong>the</strong> regions. Whereas <strong>the</strong> International <strong>Oil</strong><br />
Companies (e.g. Shell, Total, BP, ExxonMobil) have a strong presence in <strong>the</strong> NWE<br />
market, <strong>the</strong>y are less prominent in <strong>the</strong> MED market. Here National <strong>Oil</strong> Companies, such<br />
as Repsol <strong>and</strong> ENI, are <strong>the</strong> major players. The CEE market, being smaller <strong>and</strong> less<br />
advanced in its liberalisation <strong>and</strong> privatisation remains very much <strong>the</strong> province <strong>of</strong> NOCs.<br />
Ano<strong>the</strong>r difference between regions is in <strong>the</strong> type <strong>of</strong> refining capacity <strong>the</strong>y have – simple<br />
or <strong>co</strong>mplex 4 . Complex refining, while more capital intensive <strong>and</strong> more expensive, enables<br />
higher yields <strong>of</strong> more valuable <strong>and</strong> marketable products – such as diesel. NWE has a<br />
higher proportion <strong>of</strong> simple refining capacity than ei<strong>the</strong>r <strong>the</strong> MED or CEE. In <strong>the</strong> longer<br />
term, possible reliance on heavier crudes <strong>and</strong> a <strong>co</strong>ntinuing shift in dem<strong>and</strong> towards higher<br />
value products such as diesel <strong>and</strong> away from gasoline, may require additional investment<br />
to increase <strong>the</strong> capacity <strong>of</strong> <strong>co</strong>mplex refining units.<br />
4<br />
The distinction is simplistic <strong>and</strong> <strong>the</strong>re are several types <strong>of</strong> refining process.<br />
PÖYRY ENERGY CONSULTING<br />
December 2009<br />
7
SURVEY OF THE COMPETITIVE ASPECTS OF OIL AND OIL PRODUCT MARKETS IN THE EU<br />
Figure 6 – Refinery players in <strong>the</strong> EU by distillation capacity – 2009<br />
Refinery capacity mb/cd<br />
2.5<br />
2.0<br />
1.5<br />
1.0<br />
0.5<br />
0.0<br />
Total S.A.<br />
ExxonMobil<br />
Shell<br />
Sources: <strong>Oil</strong> & Gas Journal Dec 2008 <strong>and</strong> Pöyry Energy Consulting<br />
Wholesale markets<br />
IOC<br />
NOC<br />
Independent<br />
Eni<br />
BP<br />
Repsol<br />
Petroplus<br />
PKN<br />
Cono<strong>co</strong>Phillips<br />
OMV<br />
L<strong>uk</strong>oil<br />
Ineos<br />
MOL<br />
Preem<br />
Hellenic<br />
Neste<br />
ERG<br />
Saras<br />
CEPSA (ex Total S.A.)<br />
Chevron<br />
Galp (ex ENI)<br />
Tamoil<br />
PDVSA<br />
Statoil<br />
LOTOS<br />
RomPetrol<br />
Hellas<br />
Mur<strong>co</strong><br />
Lyondell<br />
API<br />
KPC<br />
Rafo<br />
Petrom (ex OMV)<br />
Neftochim<br />
Iplom<br />
Unipetrol (ex PKN)<br />
Ar<strong>co</strong>la<br />
A vital link between refining <strong>and</strong> retail marketing is <strong>the</strong> wholesale petroleum products<br />
market. An efficient, open, wholesale market facilitates <strong>co</strong>mpetition by providing access<br />
for independent refiners <strong>and</strong> retailers to <strong>co</strong>ntractual <strong>co</strong>unterparties <strong>and</strong> improving price<br />
signals <strong>and</strong> transparency. Wholesale trading markets, centred around <strong>the</strong> refining<br />
clusters exist <strong>and</strong> are increasing in transparency, liquidity/depth <strong>and</strong> range <strong>of</strong> players<br />
involved. Our initial findings indicate that:<br />
• ARA is a transparent reference point for product prices;<br />
• <strong>the</strong> range <strong>of</strong> products traded in MED is narrower <strong>and</strong> <strong>the</strong> liquidity <strong>of</strong> <strong>the</strong> market is<br />
lower than in NWE; <strong>and</strong><br />
• CEE <strong>co</strong>untries price <strong>of</strong>f published reference prices in both <strong>the</strong> MED <strong>and</strong> ARA regions<br />
as a wholesale market has yet to develop in that region.<br />
Retail<br />
Fuel retail markets over <strong>the</strong> last 10 or 20 years have undergone significant <strong>co</strong>nsolidation<br />
<strong>and</strong> changes in <strong>the</strong> position <strong>of</strong> <strong>the</strong> main players. As Table 3 shows, though <strong>the</strong>re are<br />
differences in <strong>the</strong> market shares <strong>of</strong> <strong>the</strong> largest players, in general, <strong>the</strong> markets do not<br />
appear excessively <strong>co</strong>ncentrated.<br />
PÖYRY ENERGY CONSULTING<br />
December 2009<br />
8
SURVEY OF THE COMPETITIVE ASPECTS OF OIL AND OIL PRODUCT MARKETS IN THE EU<br />
Table 3 – Summary <strong>of</strong> throughput in motor fuel retail market<br />
Country<br />
MS <strong>of</strong><br />
largest<br />
player<br />
MS <strong>of</strong> 3<br />
largest<br />
players<br />
HHI<br />
Number <strong>of</strong><br />
players ><br />
5% MS<br />
Names <strong>of</strong> three<br />
largest players<br />
Austria 22% 58% 1,430 6 OMV, BP, Shell<br />
Belgium 18% 44% 1,061 7 Total S.A., Q8, Esso<br />
Denmark 23% 61% 1,733 5 Statoil, Shell, OK<br />
Finl<strong>and</strong> 35% 73% 1,066 5 Neste <strong>Oil</strong>, Teboil,<br />
ABC<br />
France 32% 56% 1,514 6 Total S.A.,<br />
Intermarche,<br />
Carrefour<br />
Germany 23% 56% 1,420 6 Aral, Shell,<br />
Cono<strong>co</strong>Phillips<br />
Irel<strong>and</strong> 17% 48% 1,134 6 Texa<strong>co</strong>, Esso,<br />
Topas/Statoil<br />
Italy 27% 55% 1,460 8 Agip, Esso, Api<br />
Luxembourg 19% 54% 1,472 6 Shell, Total S.A., Aral<br />
Ne<strong>the</strong>rl<strong>and</strong>s 20% 44% 1,096 6 Shell, Texa<strong>co</strong>, Total<br />
S.A.<br />
Portugal 37% 66% 1,967 4 Galp, Repsol, BP<br />
Spain 40% 69% 2,219 4 Repsol, Cepsa, BP<br />
Sweden 41% 81% 2,748 4 OKQ8, StatoilHydro,<br />
Preem<br />
UK 16% 41% 999 8 BP, Tes<strong>co</strong>, Shell<br />
Note: When four <strong>co</strong>mpanies are listed, <strong>the</strong> last two have <strong>the</strong> same market share<br />
Sources: Experian Catalyst 2008 for all <strong>co</strong>untries except Germany, <strong>and</strong> Energie Informationsdienst Feb 2009 for Germany<br />
Several trends have been identified from <strong>the</strong> overview:<br />
• <strong>co</strong>nsolidation in <strong>the</strong> number <strong>of</strong> sites, leading to rising average throughput <strong>and</strong><br />
reductions in <strong>the</strong> number <strong>of</strong> sites per capita, both <strong>of</strong> which should lower operating<br />
<strong>co</strong>sts;<br />
• <strong>the</strong> emergence <strong>of</strong> supermarkets <strong>and</strong> hypermarkets selling road fuel at <strong>the</strong>ir sites in<br />
some markets in NWE, most notably, <strong>the</strong> UK <strong>and</strong> France;<br />
• an increase in <strong>the</strong> provision <strong>of</strong> supplementary services, such as <strong>co</strong>nvenience stores,<br />
by retail players;<br />
• limited success <strong>of</strong> new entrant fuel suppliers (outside <strong>the</strong> supermarkets) in<br />
establishing market share (though Cono<strong>co</strong> in Sweden was an exception); <strong>and</strong><br />
• a reduction in <strong>the</strong> relative position <strong>of</strong> <strong>the</strong> larger IOCs in some <strong>of</strong> <strong>the</strong> retail markets.<br />
Table 4 below shows that <strong>the</strong> <strong>co</strong>mpany rankings <strong>of</strong> refining capacity <strong>and</strong> retail sales by<br />
volume are similar, suggesting a significant degree <strong>of</strong> vertical integration. However, our<br />
analysis does not indicate that this is a material issue within <strong>the</strong> NWE market, due to its<br />
active wholesale market, which mitigates <strong>the</strong> ability <strong>and</strong> incentive to exercise any implied<br />
market power. Vertical integration is still prevalent in some MED <strong>and</strong> CEE markets,<br />
reflecting <strong>the</strong> previous NOC incumbent positions.<br />
PÖYRY ENERGY CONSULTING<br />
December 2009<br />
9
SURVEY OF THE COMPETITIVE ASPECTS OF OIL AND OIL PRODUCT MARKETS IN THE EU<br />
Table 4 – Top ten refinery owner <strong>and</strong> fuel marketers<br />
Ranking Refinery owner by capacity Fuel marketer by sales volumes<br />
1 Total S.A. Shell<br />
2 ExxonMobil Total S.A.<br />
3 Shell BP<br />
4 ENI Esso (ExxonMobil)<br />
5 BP Agip (ENI)<br />
6 Repsol Repsol<br />
7 Petroplus Q8 (Kuwait Petroleum Company)<br />
8 PKN Intermarche<br />
9 Cono<strong>co</strong>Phillips Carrefour<br />
10 OMV Cono<strong>co</strong>Phillips<br />
Sources: OGJ, December 2008; Experian Catalist 2008 & 2009<br />
Summary<br />
In summary, we found <strong>the</strong> following.<br />
• The level <strong>of</strong> horizontal integration at refining <strong>and</strong> retail levels does not appear<br />
excessive. While <strong>the</strong>re has been some <strong>co</strong>nsolidation in both markets, <strong>co</strong>ncentration<br />
ratio measures such as <strong>the</strong> HHI are typically low to moderate.<br />
• There is vertical integration, but o<strong>the</strong>r <strong>co</strong>mpetitive pressures within <strong>the</strong> wholesale<br />
markets reduce <strong>the</strong> incentive or ability to use such a position to deter entry or<br />
increase pr<strong>of</strong>it.<br />
• Wholesale trading is well-established in NWE <strong>and</strong> is developing in <strong>the</strong> MED. The<br />
indexation <strong>of</strong> CEE prices to MED <strong>and</strong> NWE indices is beneficial but a well functioning<br />
regional trading market would be preferable for efficient integration.<br />
• There are high volumes <strong>of</strong> cross-border trading between <strong>co</strong>untries within <strong>and</strong> beyond<br />
EU boundaries.<br />
• Though overall market shares may appear stable, <strong>the</strong>re have been major asset<br />
ownership changes in <strong>the</strong> market. This process is likely to accelerate as NOCs in<br />
MED <strong>and</strong> CEE <strong>co</strong>me through liberalisation <strong>and</strong> privatisation processes.<br />
Price-<strong>co</strong>st relationships<br />
Price-<strong>co</strong>st relationships are important to analyse since <strong>the</strong>y provide us with evidence <strong>of</strong><br />
how well markets are functioning <strong>and</strong> whe<strong>the</strong>r any <strong>of</strong> <strong>the</strong> potential structural issues<br />
identified are materially impacting behaviour.<br />
Costs are incurred at each stage in <strong>the</strong> supply chain. The analysis in this study<br />
distinguishes between <strong>the</strong>:<br />
• refining to wholesale stage, where <strong>the</strong> <strong>co</strong>sts include <strong>the</strong> crude oil price <strong>and</strong> <strong>the</strong> <strong>co</strong>sts<br />
<strong>of</strong> refining <strong>the</strong> crude oil into <strong>the</strong> relevant product; <strong>and</strong><br />
• wholesale to retail stage, where <strong>the</strong> <strong>co</strong>sts include distribution, storage <strong>co</strong>sts, retail<br />
<strong>and</strong> marketing.<br />
PÖYRY ENERGY CONSULTING<br />
December 2009<br />
10
SURVEY OF THE COMPETITIVE ASPECTS OF OIL AND OIL PRODUCT MARKETS IN THE EU<br />
Figure 7 below illustrates how <strong>the</strong>se <strong>co</strong>sts feed into <strong>the</strong> final retail price. In addition, it<br />
shows <strong>the</strong> metrics used in <strong>the</strong> price-<strong>co</strong>st analysis:<br />
• <strong>the</strong> crack spread, which is <strong>the</strong> difference between <strong>the</strong> wholesale product <strong>and</strong> <strong>the</strong><br />
crude oil price 5 ; <strong>and</strong><br />
• gross retail margin (GRM) which is <strong>the</strong> difference between <strong>the</strong> retail <strong>and</strong> <strong>the</strong><br />
wholesale product price.<br />
Figure 7 – Components <strong>of</strong> pre tax retail fuel price<br />
Gross<br />
Retail<br />
Margin<br />
Crack<br />
Spread<br />
Crude<br />
Price<br />
Crude<br />
Refining Wholesale Distribution Retail &<br />
Price & Storage Marketing<br />
Retail<br />
Price<br />
Refinery to wholesale<br />
Figure 8 illustrates <strong>the</strong> crack spread over <strong>the</strong> last five years or so for <strong>the</strong> three main<br />
products under investigation in <strong>the</strong> NWE region. What this shows is that <strong>the</strong> crack<br />
spreads for each <strong>of</strong> <strong>the</strong> three products are materially different. This reflects <strong>the</strong> relative<br />
value <strong>of</strong> <strong>the</strong> products – in recent years, diesel/gasoil has been more valuable as a<br />
<strong>co</strong>nsequence <strong>of</strong> dieselisation (reinforced by structural imbalances in <strong>the</strong> EU refining<br />
<strong>co</strong>nfiguration). In general, LSFO crack spreads have been negative meaning it reduces<br />
<strong>the</strong> margin earned by a refiner.<br />
5<br />
This is not <strong>the</strong> refining margin (i.e. <strong>the</strong> pr<strong>of</strong>itability that results from processing a barrel <strong>of</strong><br />
crude oil). The crack spread looks at <strong>the</strong> gross value for a particular product, <strong>the</strong> refining<br />
margin at <strong>the</strong> net realised value <strong>of</strong> all products manufactured from that barrel. The latter is<br />
<strong>the</strong> sum <strong>of</strong> <strong>the</strong> realised value <strong>of</strong> all refined products manufactured from that barrel minus <strong>the</strong><br />
purchase price <strong>of</strong> <strong>the</strong> barrel <strong>of</strong> crude oil.<br />
PÖYRY ENERGY CONSULTING<br />
December 2009<br />
11
SURVEY OF THE COMPETITIVE ASPECTS OF OIL AND OIL PRODUCT MARKETS IN THE EU<br />
Figure 8 – Trends in NWE crack spreads<br />
40<br />
30<br />
€/bbl (nomiinal money)<br />
20<br />
10<br />
0<br />
-10<br />
-20<br />
-30<br />
LSFO NWE CIF Cargoes<br />
Diesel NWE CIF Cargoes<br />
Gasoline NWE FOB Barges<br />
Source: Platts & Pöyry Energy Consulting analysis<br />
Crack spreads have generally been found to follow <strong>the</strong> same pattern in <strong>the</strong> MED region,<br />
but <strong>the</strong> levels <strong>of</strong> <strong>the</strong> crack spreads have been greater. This may be due to three possible<br />
differences between <strong>the</strong> regions:<br />
• <strong>the</strong> input fuel <strong>co</strong>st (<strong>the</strong> <strong>co</strong>st <strong>of</strong> <strong>the</strong> crude used);<br />
• <strong>the</strong> refining <strong>co</strong>sts (related to <strong>the</strong> <strong>co</strong>mplexity <strong>of</strong> <strong>the</strong> assets in <strong>the</strong> region); <strong>and</strong><br />
• <strong>the</strong> wholesale price achievable in <strong>the</strong> market.<br />
Observed differences can largely be explained by <strong>co</strong>st differences:<br />
• MED uses cheaper (higher sulphur) crude than NWE;<br />
• this may be <strong>of</strong>fset by <strong>the</strong> higher upgrade ratio in refineries in <strong>the</strong> MED meaning that<br />
<strong>the</strong>y require greater margins to <strong>co</strong>ver <strong>the</strong> higher operating <strong>co</strong>sts, depreciation <strong>and</strong><br />
<strong>co</strong>st <strong>of</strong> capital; <strong>and</strong><br />
• as refineries in NWE are larger <strong>and</strong> larger refineries can spread <strong>the</strong>ir fixed <strong>co</strong>sts over<br />
greater volume <strong>of</strong> output, it is expected that on balance <strong>the</strong> unit <strong>co</strong>sts <strong>of</strong> production<br />
will be lower in NWE than in MED.<br />
Wholesale to Retail<br />
Our analysis at retail level focused on <strong>the</strong> levels <strong>of</strong> <strong>and</strong> changes in GRMs in <strong>the</strong> North<br />
West Europe <strong>and</strong> Mediterranean regions. Our analysis shows that:<br />
• higher gross retail margins are seen in <strong>the</strong> MED than NWE; <strong>and</strong><br />
• margins are generally similar for diesel <strong>and</strong> gasoline.<br />
PÖYRY ENERGY CONSULTING<br />
December 2009<br />
12
SURVEY OF THE COMPETITIVE ASPECTS OF OIL AND OIL PRODUCT MARKETS IN THE EU<br />
Figure 9 – Gross retail margins in 2008 by <strong>co</strong>untry <strong>and</strong> product<br />
30<br />
25<br />
Gasoline<br />
Diesel<br />
Heating <strong>Oil</strong><br />
€ cents per litre<br />
20<br />
15<br />
10<br />
5<br />
0<br />
Austria<br />
Belgium<br />
Cyprus<br />
Denmark<br />
France<br />
Germany<br />
Greece<br />
Irel<strong>and</strong><br />
Italy<br />
Luxembourg<br />
Malta<br />
Ne<strong>the</strong>rl<strong>and</strong>s<br />
Portugal<br />
Slovenia<br />
Spain<br />
Sweden<br />
UK<br />
Source: Platts, EU <strong>Oil</strong> Bulletin <strong>and</strong> Pöyry Energy Consulting analysis<br />
Figure 9 above shows <strong>the</strong> differentials in GRMs across <strong>co</strong>untries, which may be a<br />
<strong>co</strong>nsequence <strong>of</strong> one or more <strong>of</strong> <strong>the</strong> following factors:<br />
• <strong>co</strong>st structures <strong>and</strong> levels – since <strong>co</strong>mpetitive prices should reflect <strong>co</strong>sts, fundamental<br />
differences in <strong>co</strong>st should result in different margins;<br />
• market structure – to <strong>the</strong> extent that horizontal or vertical integration affects <strong>the</strong> ability<br />
<strong>of</strong> players to influence prices <strong>and</strong> extract monopoly rents;<br />
• <strong>co</strong>mmercial business models – affecting <strong>the</strong> extent <strong>of</strong> <strong>co</strong>mpetitive pressure on <strong>co</strong>sts<br />
<strong>and</strong> innovation in service models <strong>and</strong> operations; <strong>and</strong><br />
• regulatory interventions – barriers to entry <strong>and</strong> exit that arise from regulatory<br />
interventions or restrictions.<br />
To ascertain <strong>the</strong> impact <strong>of</strong> each <strong>of</strong> <strong>the</strong>se drivers we have identified a series <strong>of</strong> indicators<br />
that represent each driver. The indicators are presented in Table 5. These have been<br />
chosen after review <strong>of</strong> <strong>the</strong> available data <strong>and</strong> analytical <strong>co</strong>nsideration. They are, by<br />
necessity, imperfect <strong>and</strong> in<strong>co</strong>mplete – for example, <strong>the</strong> average distance travelled for<br />
distribution would have been a desirable <strong>co</strong>st proxy, but we were unable to obtain<br />
<strong>co</strong>nsistent data in this area. However, <strong>the</strong>y provide an indication <strong>of</strong> <strong>the</strong> strength <strong>of</strong> <strong>the</strong><br />
drivers as an explanation <strong>of</strong> market performance.<br />
We focused on a sub-set <strong>of</strong> <strong>co</strong>untries for this assessment, chosen because <strong>of</strong> <strong>the</strong>ir<br />
relatively high or low margins, so we are able to <strong>co</strong>mpare <strong>and</strong> <strong>co</strong>ntrast <strong>the</strong> market<br />
characteristics between <strong>the</strong> two groups.<br />
Table 5 summarises <strong>the</strong> main indicators <strong>co</strong>nsidered <strong>and</strong> Table 6 presents <strong>the</strong> implications<br />
<strong>of</strong> <strong>the</strong>se indicators. In <strong>the</strong> latter, <strong>the</strong> blue <strong>co</strong>lumn shows where a relation between <strong>the</strong><br />
PÖYRY ENERGY CONSULTING<br />
December 2009<br />
13
SURVEY OF THE COMPETITIVE ASPECTS OF OIL AND OIL PRODUCT MARKETS IN THE EU<br />
indicator <strong>and</strong> high GRMs would expect to be found, e.g. high GRMs are assumed to be<br />
related to high implied fixed <strong>co</strong>sts <strong>and</strong> low throughput per site.<br />
Table 5 – Parameters used in in-depth analysis<br />
Implied retail<br />
fixed <strong>co</strong>sts<br />
(€ cents/litre)<br />
Throughput<br />
per site<br />
(1,000 litre pa)<br />
C-stores sites<br />
share 1<br />
Hypermarket<br />
sites share,<br />
volume<br />
High<br />
<strong>co</strong>ncentration<br />
(HHI > 1,800)<br />
Vertical<br />
integration 4<br />
Country<br />
Austria 11.80 1,997 66% 0.1% No 22%<br />
France 6.10 3,583 36% 51.6% No 38%<br />
Germany 8.07 4,268 2 98% 10.0% 3 No 75% 3<br />
Sweden 12.10 3,015 42% 0.0% 6 Yes 35% 5<br />
UK 8.39 3,995 85% 36.0% No 39%<br />
Greece 15.29 n/a 71% n/a n/a n/a<br />
Italy 17.00 1,816 24% 0.2% No 47%<br />
Ne<strong>the</strong>rl<strong>and</strong>s 8.68 2,006 60% 0.9% No 54%<br />
Portugal 15.12 2,617 60% 9.8% Yes 34%<br />
Spain 13.81 2,949 78% 3.6% Yes 68%<br />
Hungary n/a n/a n/a 2.5% 7 No 9 n/a<br />
Pol<strong>and</strong> n/a n/a n/a 5.5% 8 Yes 9 n/a<br />
Estimated average 11.70 2,985 62% 19.8% n/a n/a<br />
1 Datamonitor 2007<br />
2 UPEI <strong>and</strong> Energie Informationsdienst<br />
3 Energie Informationsdienst<br />
4 Percentage <strong>of</strong> retail volume potentially supplied by refineries that are a) located in <strong>the</strong> same <strong>co</strong>untry; <strong>and</strong><br />
b) owned by <strong>the</strong> same <strong>co</strong>mpany as <strong>the</strong> retail site<br />
5 Swedish Petroleum Institute<br />
6 Hypermarkets are prevented from selling motor fuels in Sweden<br />
7 IEA Review <strong>of</strong> Hungary in 2006 cite <strong>the</strong> Hungarian Petroleum Association stating Tes<strong>co</strong> owns 24 out <strong>of</strong> 952 sites<br />
8 POPiHN<br />
9 Calculated on number <strong>of</strong> sites due to lack <strong>of</strong> volume data<br />
Source: Experian Catalist 2008 & 2009 <strong>and</strong> Pöyry Energy Consulting except where stated<br />
PÖYRY ENERGY CONSULTING<br />
December 2009<br />
14
SURVEY OF THE COMPETITIVE ASPECTS OF OIL AND OIL PRODUCT MARKETS IN THE EU<br />
Table 6 – Summary <strong>of</strong> marker out<strong>co</strong>mes <strong>and</strong> <strong>the</strong>ir impact on GRMs<br />
Country<br />
Low High Low High Low High Low High Low High Low High Low High<br />
Austria * <br />
France <br />
Germany <br />
Sweden * <br />
UK <br />
Greece <br />
Italy * <br />
Ne<strong>the</strong>rl<strong>and</strong>s * * <br />
Portugal * <br />
Spain * <br />
Hungary <br />
Pol<strong>and</strong> <br />
1 High is above average <strong>of</strong> 11.7<br />
2 High is above average <strong>of</strong> 2,985<br />
3 High is above average <strong>of</strong> 58%<br />
4 High is above average <strong>of</strong> 19.8%<br />
5 HHI more than 1800<br />
Implied fixed <strong>co</strong>sts Throughput per C-stores sites Hypermarket sites<br />
for retail sector 1 site 2 share 3 share, volume 4<br />
Concentration 5<br />
6 High is when more than 50% <strong>of</strong> retail sales can be supplied from <strong>the</strong> site owners' refineries within <strong>the</strong> same <strong>co</strong>untry.<br />
* Value lies close to border between high <strong>and</strong> low<br />
Vertical<br />
integration 6<br />
GRMs<br />
Using Table 5 <strong>and</strong> Table 6, <strong>the</strong> following observations can be made.<br />
• Countries with higher <strong>co</strong>sts, as indicated by low average site throughput <strong>and</strong> high<br />
estimated fixed <strong>co</strong>sts, do generally have higher GRMs, which would be expected<br />
since <strong>the</strong> GRM must re<strong>co</strong>ver <strong>the</strong> operating <strong>co</strong>sts <strong>of</strong> <strong>the</strong> site.<br />
• There is no clear <strong>co</strong>rrelation between <strong>co</strong>ncentration at <strong>the</strong> retail level <strong>and</strong> <strong>the</strong><br />
observed GRM nor vertical integration <strong>and</strong> GRM, suggesting that large players are<br />
not unduly able to influence prices. The one <strong>co</strong>untry with a high degree <strong>of</strong><br />
<strong>co</strong>ncentration in <strong>the</strong> retail sector <strong>and</strong> high vertical integration is Spain, which has<br />
GRMs above <strong>the</strong> EU average but below its regional average.<br />
• The <strong>co</strong>untries with low GRMs <strong>and</strong> low <strong>co</strong>st structures generally have higher levels <strong>of</strong><br />
hypermarket entry. This suggests that effective entry <strong>and</strong> <strong>co</strong>mpetition in <strong>the</strong> retail<br />
segment places downward pressure on <strong>co</strong>sts <strong>and</strong> margins where it is observed. The<br />
fact that <strong>the</strong>se pressures are not evident in some <strong>of</strong> <strong>the</strong> MED <strong>and</strong> CEE markets may<br />
explain <strong>the</strong>ir higher <strong>co</strong>st structures at present.<br />
• Responses to <strong>co</strong>mpetitive pressure include reliance on non-fuel activities to support<br />
margins. It is clear that <strong>the</strong> prevalence <strong>of</strong> C-stores in low margin <strong>co</strong>untries may be a<br />
good indicator that fuel market <strong>co</strong>mpetition is effective.<br />
• Sweden, despite having <strong>the</strong> lowest margins, does not appear to <strong>co</strong>nform. However,<br />
<strong>the</strong> high <strong>co</strong>ncentration is a function <strong>of</strong> recent <strong>co</strong>nsolidation activity <strong>and</strong> previous<br />
entrants had effectively introduced low-<strong>co</strong>st operating techniques through <strong>the</strong><br />
deployment <strong>of</strong> automat stations.<br />
PÖYRY ENERGY CONSULTING<br />
December 2009<br />
15
SURVEY OF THE COMPETITIVE ASPECTS OF OIL AND OIL PRODUCT MARKETS IN THE EU<br />
A fur<strong>the</strong>r cause <strong>of</strong> margin differentials may be data imperfections. The retail price data for<br />
<strong>the</strong> GRM calculations was taken from <strong>the</strong> EU <strong>Oil</strong> Bulletin <strong>and</strong> <strong>co</strong>ncerns with <strong>the</strong> reporting<br />
<strong>and</strong> <strong>co</strong>llection methodology for this time series have been raised in a recent report by <strong>the</strong><br />
Market Observatory for Energy (MOE). 6 The report specifically mentioned that <strong>the</strong><br />
Ne<strong>the</strong>rl<strong>and</strong>s reported retail prices, though based on wholesalers’ re<strong>co</strong>mmended prices,<br />
were generally 6 eurocents/litre above <strong>the</strong> average observed prices faced by <strong>co</strong>nsumers.<br />
This has significant implications for any analysis. For example, applying <strong>the</strong> lower figure<br />
for <strong>the</strong> Ne<strong>the</strong>rl<strong>and</strong>s results in a reduction in its estimated pre-tax gasoline GRM <strong>of</strong> 4.8<br />
eurocents/litre. These data in<strong>co</strong>nsistencies are not <strong>co</strong>nfined to <strong>the</strong> Ne<strong>the</strong>rl<strong>and</strong>s, as <strong>the</strong><br />
MOE report shows, though it also provides no indication that <strong>the</strong> extent <strong>of</strong> divergence<br />
between reported <strong>and</strong> observed prices is <strong>of</strong> <strong>the</strong> same order <strong>of</strong> magnitude in o<strong>the</strong>r Member<br />
States. Without more detailed analysis <strong>of</strong> <strong>the</strong> underlying data we are unable to make<br />
<strong>co</strong>nsistent adjustments to all <strong>co</strong>untries <strong>and</strong> have <strong>the</strong>refore retained use <strong>of</strong> <strong>the</strong> EU <strong>Oil</strong><br />
Bulletin time series.<br />
Consistent <strong>and</strong> <strong>co</strong>mparable retail price data is essential for effective <strong>and</strong> timely monitoring<br />
<strong>of</strong> <strong>the</strong> performance <strong>of</strong> <strong>the</strong> downstream oil retail markets <strong>and</strong> <strong>the</strong> extent <strong>of</strong> <strong>the</strong> differences<br />
in <strong>the</strong> Ne<strong>the</strong>rl<strong>and</strong>s data highlights <strong>the</strong> need for <strong>the</strong>se deficiencies to be addressed quickly<br />
<strong>and</strong> credibly.<br />
Potential impact <strong>of</strong> inefficiencies in gross retail margins<br />
Because EU27 expenditure on <strong>the</strong> three products analysed is substantive, even small<br />
inefficiencies identified may have a substantial welfare impact. For example, if <strong>the</strong><br />
estimated margins in <strong>the</strong> Ne<strong>the</strong>rl<strong>and</strong>s, Greece, Italy, Portugal, <strong>and</strong> Spain were to<br />
<strong>co</strong>nverge on <strong>the</strong> weighted average margins <strong>of</strong> <strong>the</strong>ir regional group, <strong>co</strong>nsumers in those<br />
<strong>co</strong>untries would potentially gain about €2.2 billion as shown in Table 7. However, since<br />
<strong>the</strong> larger part <strong>of</strong> this would be a pure transfer from producers, <strong>the</strong> net welfare impact is<br />
significantly lower, at only €21m, because <strong>co</strong>nsumption is not assumed to respond much<br />
to price changes. These figures are dependent both on assumptions <strong>of</strong> <strong>the</strong> extent to<br />
which prices or margins can be reduced <strong>and</strong> on <strong>the</strong> accuracy <strong>of</strong> <strong>the</strong> current GRM<br />
estimates. 7<br />
Table 7 – Potential <strong>co</strong>nsumer surplus <strong>and</strong> net welfare impact (€ million per annum)<br />
Consumer surplus Net welfare effect<br />
Ne<strong>the</strong>rl<strong>and</strong>s 1,148 19<br />
Greece 232 1<br />
Italy 830 1<br />
Portugal 24 0<br />
Spain 0 0<br />
TOTAL 2,234 21<br />
6<br />
7<br />
<strong>Survey</strong> on <strong>the</strong> Petroleum Products’ Price Data Collection Published in <strong>the</strong> Weekly <strong>Oil</strong><br />
Bulletin, Market Observatory for Energy (February 2009)<br />
As noted, in<strong>co</strong>nsistencies in <strong>the</strong> EU <strong>Oil</strong> Bulletin data reporting for <strong>the</strong> Ne<strong>the</strong>rl<strong>and</strong>s means<br />
that actual <strong>co</strong>nsumer prices may be <strong>co</strong>nsiderably lower than implied by <strong>the</strong> time series used.<br />
This would fur<strong>the</strong>r serve to lower <strong>the</strong> overall benefit from market interventions.<br />
PÖYRY ENERGY CONSULTING<br />
December 2009<br />
16
SURVEY OF THE COMPETITIVE ASPECTS OF OIL AND OIL PRODUCT MARKETS IN THE EU<br />
Conclusions <strong>and</strong> re<strong>co</strong>mmendations<br />
A <strong>co</strong>mpetitive market should be characterised by low barriers to entry <strong>and</strong> exit for<br />
suppliers <strong>and</strong> customers, non-discriminatory access to supplies <strong>and</strong> infrastructure. Our<br />
review <strong>of</strong> <strong>the</strong> physical <strong>and</strong> <strong>co</strong>ntractual relationships in <strong>the</strong> oil product supply chain shows:<br />
• <strong>the</strong>re is little evidence <strong>of</strong> overly <strong>co</strong>ncentrated markets at retail or refinery levels;<br />
• high vertical integration across <strong>the</strong> chain can be <strong>of</strong>fset by well functioning wholesale<br />
markets;<br />
• many <strong>of</strong> <strong>the</strong> price differences between regions <strong>and</strong> <strong>co</strong>untries are <strong>co</strong>nsistent with<br />
underlying <strong>co</strong>st differences; <strong>and</strong><br />
• <strong>the</strong> differences in <strong>co</strong>st structure at <strong>the</strong> retail level relate more to <strong>the</strong> strength <strong>of</strong><br />
<strong>co</strong>mpetitive pressure forcing innovation in service models.<br />
There do not appear to be any fundamental structural barriers at a pan-European level,<br />
though <strong>the</strong>re are specific national barriers that may affect welfare losses. An example<br />
would be regulations that prevent hypermarket sites from building retail fore<strong>co</strong>urts.<br />
A catalyst is needed to incentivise changes in retail market models in <strong>the</strong> future, whe<strong>the</strong>r<br />
this is through supermarket entry or aggressive retailers <strong>of</strong>fering new services <strong>and</strong><br />
adopting new <strong>co</strong>st saving practices. If <strong>the</strong>re are players in <strong>the</strong> market that <strong>co</strong>nstantly<br />
challenge <strong>the</strong> incumbents we would expect low GRMs <strong>and</strong> dynamic responses <strong>and</strong><br />
<strong>co</strong>nsolidation. In fact this seems to be <strong>the</strong> case in several <strong>of</strong> <strong>the</strong> low GRM <strong>co</strong>untries.<br />
Limited incentive for low-<strong>co</strong>st/price players in some markets is only a cause for <strong>co</strong>ncern if<br />
it is due to barriers to entry (e.g. hypermarket restrictions in Greece or lack <strong>of</strong> access to<br />
blending facilities in Hungary). In <strong>co</strong>ntrast low margins would function as a perfectly<br />
acceptable disincentive.<br />
Against this background <strong>the</strong>re is little formal action that can be undertaken at a European<br />
level. Never<strong>the</strong>less, regular benchmarking <strong>of</strong> performance across Member States based<br />
on identified key indicators for <strong>co</strong>mpetitiveness in oil <strong>and</strong> oil products market may be<br />
beneficial in monitoring progress in a similar manner to studies in o<strong>the</strong>r energy sectors.<br />
However, to do so <strong>the</strong> Commission will need accurate data. Two improvements are<br />
proposed in this regard.<br />
First, as pointed out in this report, information in most <strong>of</strong> <strong>the</strong> CEE <strong>co</strong>untries <strong>co</strong>uld be<strong>co</strong>me<br />
more transparent. Today <strong>the</strong>re is a lack <strong>of</strong> statistical data, not least on prices in crude <strong>and</strong><br />
product markets, in most CEE <strong>co</strong>untries, making informed <strong>co</strong>mparisons <strong>of</strong> markets<br />
difficult. This hampers any analysis <strong>of</strong> <strong>the</strong> market in this region <strong>and</strong> national agencies<br />
(e.g. NCAs) <strong>co</strong>uld <strong>co</strong>nsider establishing monitoring measures that focus on market<br />
performance including, for example, <strong>co</strong>mparisons regarding <strong>the</strong> level <strong>of</strong> <strong>and</strong> development<br />
<strong>of</strong> different spreads <strong>and</strong> GRMs <strong>and</strong> market accessibility.<br />
Se<strong>co</strong>nd, <strong>the</strong> lack <strong>of</strong> <strong>co</strong>nsistency <strong>and</strong> <strong>co</strong>mparability <strong>of</strong> reported retail price data across<br />
Member States needs to be addressed to ensure efficient monitoring <strong>of</strong> <strong>the</strong> relative<br />
performance across markets <strong>and</strong> fuels. The report <strong>of</strong> <strong>the</strong> MOE earlier in 2009 should<br />
serve as a basis for improving <strong>the</strong> reporting methodology <strong>of</strong> Member States for <strong>the</strong> EU <strong>Oil</strong><br />
Bulletin.<br />
At a national level <strong>the</strong>re is also a need for authorities to ensure regulatory barriers such as<br />
mentioned above are minimised. Predominantly this <strong>co</strong>uld be carried out by removing<br />
restrictive regulations regarding <strong>the</strong> establishment <strong>of</strong> hypermarket sites <strong>and</strong>/or by a swift<br />
<strong>and</strong> generous application <strong>of</strong> permits for establishing sites. In addition, ongoing monitoring<br />
PÖYRY ENERGY CONSULTING<br />
December 2009<br />
17
SURVEY OF THE COMPETITIVE ASPECTS OF OIL AND OIL PRODUCT MARKETS IN THE EU<br />
<strong>of</strong> <strong>the</strong> activities <strong>of</strong> <strong>the</strong> incumbent NOCs to prevent <strong>the</strong>m from exploiting <strong>the</strong> advantages <strong>of</strong><br />
<strong>the</strong>ir historic incumbency position should be performed.<br />
PÖYRY ENERGY CONSULTING<br />
December 2009<br />
18
SURVEY OF THE COMPETITIVE ASPECTS OF OIL AND OIL PRODUCT MARKETS IN THE EU<br />
[This page is intentionally blank]<br />
PÖYRY ENERGY CONSULTING<br />
December 2009<br />
19
Pöyry is a global <strong>co</strong>nsulting <strong>and</strong> engineering firm.<br />
Focusing on <strong>the</strong> energy, forest industry, infrastructure <strong>and</strong><br />
environment sectors, Pöyry employs 7200 experts globally <strong>and</strong><br />
has annual net sales <strong>of</strong> €718million.<br />
Pöyry Energy Consulting is <strong>the</strong> leading advisor to Europe’s<br />
energy markets, formed from <strong>the</strong> merger <strong>of</strong> ILEX Energy<br />
Consulting, ECON, Convergence Utility Consultants <strong>and</strong> <strong>the</strong><br />
management <strong>co</strong>nsulting arms <strong>of</strong> Electrowatt-Ekono <strong>and</strong><br />
Verbundplan.<br />
E<strong>co</strong>n Pöyry AB<br />
Banérgatan 16 Tel: +46 (0)8 5280 1200<br />
SE-115 23 Stockholm Fax: +46 (0)8 5280 1220<br />
Sweden<br />
www.e<strong>co</strong>n.se<br />
E-mail: Stockholm.ecse@poyry.<strong>co</strong>m<br />
E<strong>co</strong>n Pöyry report no R2010-LGH-EU <strong>Oil</strong> Review, Project no. 6A080018<br />
www.poyry.<strong>co</strong>m