

PDF version - Community Foundation of Southern Wisconsin
PDF version - Community Foundation of Southern Wisconsin
PDF version - Community Foundation of Southern Wisconsin

You also want an ePaper? Increase the reach of your titles
YUMPU automatically turns print PDFs into web optimized ePapers that Google loves.
2012-2013<br />
Financial Summary<br />
Donations to the <strong>Community</strong> <strong>Foundation</strong> <strong>of</strong> <strong>Southern</strong> <strong>Wisconsin</strong> are pooled for investment purposes with total returns<br />
allocated to each component fund. Component funds <strong>of</strong> the <strong>Community</strong> <strong>Foundation</strong> benefit from the greater<br />
diversification and effectiveness that the pool provides, more than would be possible for single funds.<br />
The Asset Management Committee <strong>of</strong> the <strong>Community</strong> <strong>Foundation</strong> monitors the performance <strong>of</strong> our investments in<br />
conjunction with a team <strong>of</strong> investment managers from area financial institutions. Our investment managers are from<br />
BMO Harris Bank N.A., First National Bank & Trust-Beloit, Johnson Bank, Union Bank & Trust, US Bank, and <strong>Wisconsin</strong><br />
Bank & Trust.<br />
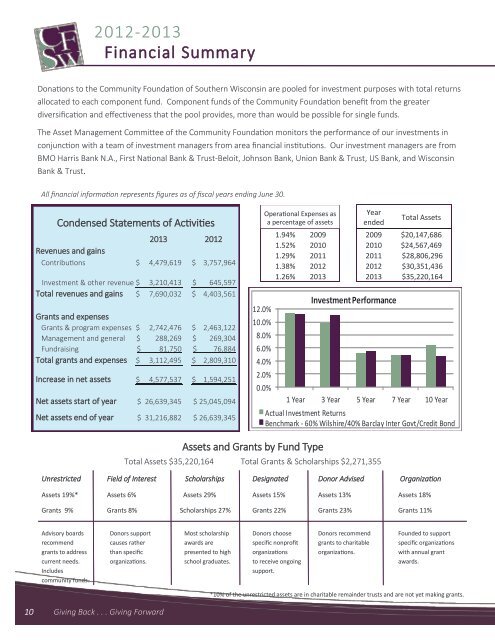
All financial information represents figures as <strong>of</strong> fiscal years ending June 30.<br />
Condensed Statements <strong>of</strong> Activities<br />
2013 2012<br />
Revenues and gains<br />
Contributions $ 4,479,619 $ 3,757,964<br />
Investment & other revenue $ 3,210,413 $ 645,597<br />
Total revenues and gains $ 7,690,032 $ 4,403,561<br />
Grants and expenses<br />
Grants & program expenses $ 2,742,476 $ 2,463,122<br />
Management and general $ 288,269 $ 269,304<br />
Fundraising $ 81,750 $ 76,884<br />
Total grants and expenses $ 3,112,495 $ 2,809,310<br />
Increase in net assets $ 4,577,537 $ 1,594,251<br />
Net assets start <strong>of</strong> year $ 26,639,345 $ 25,045,094<br />
Net assets end <strong>of</strong> year $ 31,216,882 $ 26,639,345<br />
12.0%<br />
10.0%<br />
8.0%<br />
6.0%<br />
4.0%<br />
2.0%<br />
0.0%<br />
Operational Expenses as<br />
a percentage <strong>of</strong> assets<br />
1.94% 2009<br />
1.52% 2010<br />
1.29% 2011<br />
1.38% 2012<br />
1.26% 2013<br />
Year<br />
ended<br />
Investment Performance<br />
Total Assets<br />
2009 $20,147,686<br />
2010 $24,567,469<br />
2011 $28,806,296<br />
2012 $30,351,436<br />
2013 $35,220,164<br />
1 Year 3 Year 5 Year 7 Year 10 Year<br />
Actual Investment Returns<br />
Benchmark - 60% Wilshire/40% Barclay Inter Govt/Credit Bond<br />
Assets and Grants by Fund Type<br />
Total Assets $35,220,164 Total Grants & Scholarships $2,271,355<br />
Unrestricted Field <strong>of</strong> Interest Scholarships Designated Donor Advised Organization<br />
Assets 19%* Assets 6% Assets 29% Assets 15% Assets 13% Assets 18%<br />
Grants 9% Grants 8% Scholarships 27% Grants 22% Grants 23% Grants 11%<br />
Advisory boards Donors support Most scholarship Donors choose Donors recommend Founded to support<br />
recommend causes rather awards are specific nonpr<strong>of</strong>it grants to charitable specific organizations<br />
grants to address than specific presented to high organizations organizations. with annual grant<br />
current needs. organizations. school graduates. to receive ongoing awards.<br />
Includes<br />
support.<br />
community funds.<br />
10 Giving Back . . . Giving Forward<br />
*10% <strong>of</strong> the unrestricted assets are in charitable remainder trusts and are not yet making grants.